11.5: Vaporization and Vapor Pressure
- Page ID
- 46974
\( \newcommand{\vecs}[1]{\overset { \scriptstyle \rightharpoonup} {\mathbf{#1}} } \)
\( \newcommand{\vecd}[1]{\overset{-\!-\!\rightharpoonup}{\vphantom{a}\smash {#1}}} \)
\( \newcommand{\id}{\mathrm{id}}\) \( \newcommand{\Span}{\mathrm{span}}\)
( \newcommand{\kernel}{\mathrm{null}\,}\) \( \newcommand{\range}{\mathrm{range}\,}\)
\( \newcommand{\RealPart}{\mathrm{Re}}\) \( \newcommand{\ImaginaryPart}{\mathrm{Im}}\)
\( \newcommand{\Argument}{\mathrm{Arg}}\) \( \newcommand{\norm}[1]{\| #1 \|}\)
\( \newcommand{\inner}[2]{\langle #1, #2 \rangle}\)
\( \newcommand{\Span}{\mathrm{span}}\)
\( \newcommand{\id}{\mathrm{id}}\)
\( \newcommand{\Span}{\mathrm{span}}\)
\( \newcommand{\kernel}{\mathrm{null}\,}\)
\( \newcommand{\range}{\mathrm{range}\,}\)
\( \newcommand{\RealPart}{\mathrm{Re}}\)
\( \newcommand{\ImaginaryPart}{\mathrm{Im}}\)
\( \newcommand{\Argument}{\mathrm{Arg}}\)
\( \newcommand{\norm}[1]{\| #1 \|}\)
\( \newcommand{\inner}[2]{\langle #1, #2 \rangle}\)
\( \newcommand{\Span}{\mathrm{span}}\) \( \newcommand{\AA}{\unicode[.8,0]{x212B}}\)
\( \newcommand{\vectorA}[1]{\vec{#1}} % arrow\)
\( \newcommand{\vectorAt}[1]{\vec{\text{#1}}} % arrow\)
\( \newcommand{\vectorB}[1]{\overset { \scriptstyle \rightharpoonup} {\mathbf{#1}} } \)
\( \newcommand{\vectorC}[1]{\textbf{#1}} \)
\( \newcommand{\vectorD}[1]{\overrightarrow{#1}} \)
\( \newcommand{\vectorDt}[1]{\overrightarrow{\text{#1}}} \)
\( \newcommand{\vectE}[1]{\overset{-\!-\!\rightharpoonup}{\vphantom{a}\smash{\mathbf {#1}}}} \)
\( \newcommand{\vecs}[1]{\overset { \scriptstyle \rightharpoonup} {\mathbf{#1}} } \)
\( \newcommand{\vecd}[1]{\overset{-\!-\!\rightharpoonup}{\vphantom{a}\smash {#1}}} \)
\(\newcommand{\avec}{\mathbf a}\) \(\newcommand{\bvec}{\mathbf b}\) \(\newcommand{\cvec}{\mathbf c}\) \(\newcommand{\dvec}{\mathbf d}\) \(\newcommand{\dtil}{\widetilde{\mathbf d}}\) \(\newcommand{\evec}{\mathbf e}\) \(\newcommand{\fvec}{\mathbf f}\) \(\newcommand{\nvec}{\mathbf n}\) \(\newcommand{\pvec}{\mathbf p}\) \(\newcommand{\qvec}{\mathbf q}\) \(\newcommand{\svec}{\mathbf s}\) \(\newcommand{\tvec}{\mathbf t}\) \(\newcommand{\uvec}{\mathbf u}\) \(\newcommand{\vvec}{\mathbf v}\) \(\newcommand{\wvec}{\mathbf w}\) \(\newcommand{\xvec}{\mathbf x}\) \(\newcommand{\yvec}{\mathbf y}\) \(\newcommand{\zvec}{\mathbf z}\) \(\newcommand{\rvec}{\mathbf r}\) \(\newcommand{\mvec}{\mathbf m}\) \(\newcommand{\zerovec}{\mathbf 0}\) \(\newcommand{\onevec}{\mathbf 1}\) \(\newcommand{\real}{\mathbb R}\) \(\newcommand{\twovec}[2]{\left[\begin{array}{r}#1 \\ #2 \end{array}\right]}\) \(\newcommand{\ctwovec}[2]{\left[\begin{array}{c}#1 \\ #2 \end{array}\right]}\) \(\newcommand{\threevec}[3]{\left[\begin{array}{r}#1 \\ #2 \\ #3 \end{array}\right]}\) \(\newcommand{\cthreevec}[3]{\left[\begin{array}{c}#1 \\ #2 \\ #3 \end{array}\right]}\) \(\newcommand{\fourvec}[4]{\left[\begin{array}{r}#1 \\ #2 \\ #3 \\ #4 \end{array}\right]}\) \(\newcommand{\cfourvec}[4]{\left[\begin{array}{c}#1 \\ #2 \\ #3 \\ #4 \end{array}\right]}\) \(\newcommand{\fivevec}[5]{\left[\begin{array}{r}#1 \\ #2 \\ #3 \\ #4 \\ #5 \\ \end{array}\right]}\) \(\newcommand{\cfivevec}[5]{\left[\begin{array}{c}#1 \\ #2 \\ #3 \\ #4 \\ #5 \\ \end{array}\right]}\) \(\newcommand{\mattwo}[4]{\left[\begin{array}{rr}#1 \amp #2 \\ #3 \amp #4 \\ \end{array}\right]}\) \(\newcommand{\laspan}[1]{\text{Span}\{#1\}}\) \(\newcommand{\bcal}{\cal B}\) \(\newcommand{\ccal}{\cal C}\) \(\newcommand{\scal}{\cal S}\) \(\newcommand{\wcal}{\cal W}\) \(\newcommand{\ecal}{\cal E}\) \(\newcommand{\coords}[2]{\left\{#1\right\}_{#2}}\) \(\newcommand{\gray}[1]{\color{gray}{#1}}\) \(\newcommand{\lgray}[1]{\color{lightgray}{#1}}\) \(\newcommand{\rank}{\operatorname{rank}}\) \(\newcommand{\row}{\text{Row}}\) \(\newcommand{\col}{\text{Col}}\) \(\renewcommand{\row}{\text{Row}}\) \(\newcommand{\nul}{\text{Nul}}\) \(\newcommand{\var}{\text{Var}}\) \(\newcommand{\corr}{\text{corr}}\) \(\newcommand{\len}[1]{\left|#1\right|}\) \(\newcommand{\bbar}{\overline{\bvec}}\) \(\newcommand{\bhat}{\widehat{\bvec}}\) \(\newcommand{\bperp}{\bvec^\perp}\) \(\newcommand{\xhat}{\widehat{\xvec}}\) \(\newcommand{\vhat}{\widehat{\vvec}}\) \(\newcommand{\uhat}{\widehat{\uvec}}\) \(\newcommand{\what}{\widehat{\wvec}}\) \(\newcommand{\Sighat}{\widehat{\Sigma}}\) \(\newcommand{\lt}{<}\) \(\newcommand{\gt}{>}\) \(\newcommand{\amp}{&}\) \(\definecolor{fillinmathshade}{gray}{0.9}\)- To know how and why the vapor pressure of a liquid varies with temperature.
- To understand that the equilibrium vapor pressure of a liquid depends on the temperature and the intermolecular forces present.
- To understand that the relationship between pressure, enthalpy of vaporization, and temperature is given by the Clausius-Clapeyron equation.
Nearly all of us have heated a pan of water with the lid in place and shortly thereafter heard the sounds of the lid rattling and hot water spilling onto the stovetop. When a liquid is heated, its molecules obtain sufficient kinetic energy to overcome the forces holding them in the liquid and they escape into the gaseous phase. By doing so, they generate a population of molecules in the vapor phase above the liquid that produces a pressure—the vapor pressure of the liquid. In the situation we described, enough pressure was generated to move the lid, which allowed the vapor to escape. If the vapor is contained in a sealed vessel, however, such as an unvented flask, and the vapor pressure becomes too high, the flask will explode (as many students have unfortunately discovered). In this section, we describe vapor pressure in more detail and explain how to quantitatively determine the vapor pressure of a liquid.
Evaporation and Condensation
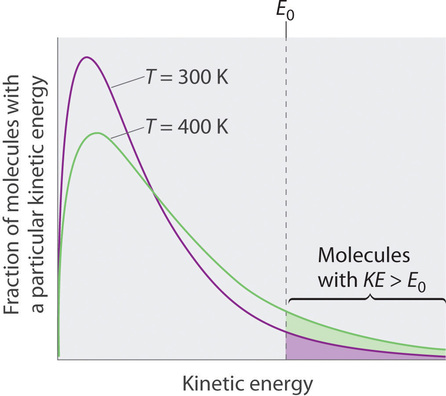
Because the molecules of a liquid are in constant motion, we can plot the fraction of molecules with a given kinetic energy (KE) against their kinetic energy to obtain the kinetic energy distribution of the molecules in the liquid (Figure \(\PageIndex{1}\)), just as we did for a gas. As for gases, increasing the temperature increases both the average kinetic energy of the particles in a liquid and the range of kinetic energy of the individual molecules. If we assume that a minimum amount of energy (\(E_0\)) is needed to overcome the intermolecular attractive forces that hold a liquid together, then some fraction of molecules in the liquid always has a kinetic energy greater than \(E_0\). The fraction of molecules with a kinetic energy greater than this minimum value increases with increasing temperature. Any molecule with a kinetic energy greater than \(E_0\) has enough energy to overcome the forces holding it in the liquid and escape into the vapor phase. Before it can do so, however, a molecule must also be at the surface of the liquid, where it is physically possible for it to leave the liquid surface; that is, only molecules at the surface can undergo evaporation (or vaporization), where molecules gain sufficient energy to enter a gaseous state above a liquid’s surface, thereby creating a vapor pressure.

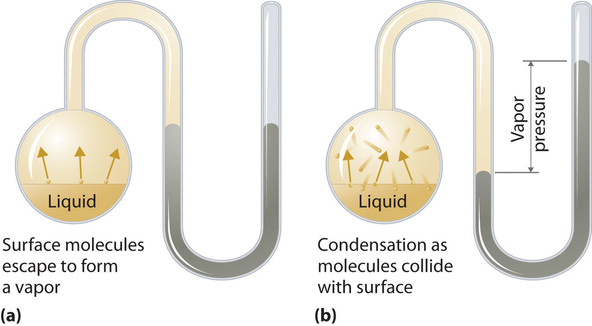
To understand the causes of vapor pressure, consider the apparatus shown in Figure \(\PageIndex{2}\). When a liquid is introduced into an evacuated chamber (part (a) in Figure \(\PageIndex{2}\)), the initial pressure above the liquid is approximately zero because there are as yet no molecules in the vapor phase. Some molecules at the surface, however, will have sufficient kinetic energy to escape from the liquid and form a vapor, thus increasing the pressure inside the container. As long as the temperature of the liquid is held constant, the fraction of molecules with \(KE > E_0\) will not change, and the rate at which molecules escape from the liquid into the vapor phase will depend only on the surface area of the liquid phase.

As soon as some vapor has formed, a fraction of the molecules in the vapor phase will collide with the surface of the liquid and reenter the liquid phase in a process known as condensation (part (b) in Figure \(\PageIndex{2}\)). As the number of molecules in the vapor phase increases, the number of collisions between vapor-phase molecules and the surface will also increase. Eventually, a steady state will be reached in which exactly as many molecules per unit time leave the surface of the liquid (vaporize) as collide with it (condense). At this point, the pressure over the liquid stops increasing and remains constant at a particular value that is characteristic of the liquid at a given temperature. The rates of evaporation and condensation over time for a system such as this are shown graphically in Figure \(\PageIndex{3}\).

Equilibrium Vapor Pressure
Two opposing processes (such as evaporation and condensation) that occur at the same rate and thus produce no net change in a system, constitute a dynamic equilibrium. In the case of a liquid enclosed in a chamber, the molecules continuously evaporate and condense, but the amounts of liquid and vapor do not change with time. The pressure exerted by a vapor in dynamic equilibrium with a liquid is the equilibrium vapor pressure of the liquid.
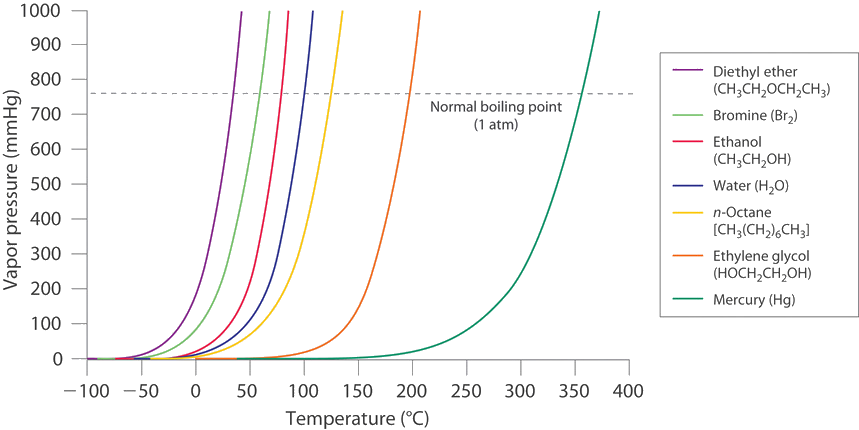
If a liquid is in an open container, however, most of the molecules that escape into the vapor phase will not collide with the surface of the liquid and return to the liquid phase. Instead, they will diffuse through the gas phase away from the container, and an equilibrium will never be established. Under these conditions, the liquid will continue to evaporate until it has “disappeared.” The speed with which this occurs depends on the vapor pressure of the liquid and the temperature. Volatile liquids have relatively high vapor pressures and tend to evaporate readily; nonvolatile liquids have low vapor pressures and evaporate more slowly. Although the dividing line between volatile and nonvolatile liquids is not clear-cut, as a general guideline, we can say that substances with vapor pressures greater than that of water (Figure \(\PageIndex{4}\)) are relatively volatile, whereas those with vapor pressures less than that of water are relatively nonvolatile. Thus diethyl ether (ethyl ether), acetone, and gasoline are volatile, but mercury, ethylene glycol, and motor oil are nonvolatile.

The equilibrium vapor pressure of a substance at a particular temperature is a characteristic of the material, like its molecular mass, melting point, and boiling point. It does not depend on the amount of liquid as long as at least a tiny amount of liquid is present in equilibrium with the vapor. The equilibrium vapor pressure does, however, depend very strongly on the temperature and the intermolecular forces present, as shown for several substances in Figure \(\PageIndex{4}\). Molecules that can hydrogen bond, such as ethylene glycol, have a much lower equilibrium vapor pressure than those that cannot, such as octane. The nonlinear increase in vapor pressure with increasing temperature is much steeper than the increase in pressure expected for an ideal gas over the corresponding temperature range. The temperature dependence is so strong because the vapor pressure depends on the fraction of molecules that have a kinetic energy greater than that needed to escape from the liquid, and this fraction increases exponentially with temperature. As a result, sealed containers of volatile liquids are potential bombs if subjected to large increases in temperature. The gas tanks on automobiles are vented, for example, so that a car won’t explode when parked in the sun. Similarly, the small cans (1–5 gallons) used to transport gasoline are required by law to have a pop-off pressure release.
Volatile substances have low boiling points and relatively weak intermolecular interactions; nonvolatile substances have high boiling points and relatively strong intermolecular interactions.
A Video Discussing Vapor Pressure and Boiling Points. Video Source: Vapor Pressure & Boiling Point(opens in new window) [youtu.be]
The exponential rise in vapor pressure with increasing temperature in Figure \(\PageIndex{4}\) allows us to use natural logarithms to express the nonlinear relationship as a linear one.
\[ \boxed{\ln P =\dfrac{-\Delta H_{vap}}{R}\left ( \dfrac{1}{T} \right) + C} \label{Eq1} \]
where
- \(\ln P\) is the natural logarithm of the vapor pressure,
- \(ΔH_{vap}\) is the enthalpy of vaporization,
- \(R\) is the universal gas constant [8.314 J/(mol•K)],
- \(T\) is the temperature in kelvins, and
- \(C\) is the y-intercept, which is a constant for any given line.
Plotting \(\ln P\) versus the inverse of the absolute temperature (\(1/T\)) is a straight line with a slope of −ΔHvap/R. Equation \(\ref{Eq1}\), called the Clausius–Clapeyron Equation, can be used to calculate the \(ΔH_{vap}\) of a liquid from its measured vapor pressure at two or more temperatures. The simplest way to determine \(ΔH_{vap}\) is to measure the vapor pressure of a liquid at two temperatures and insert the values of \(P\) and \(T\) for these points into Equation \(\ref{Eq2}\), which is derived from the Clausius–Clapeyron equation:
\[ \ln\left ( \dfrac{P_{1}}{P_{2}} \right)=\dfrac{-\Delta H_{vap}}{R}\left ( \dfrac{1}{T_{1}}-\dfrac{1}{T_{2}} \right) \label{Eq2} \]
Conversely, if we know ΔHvap and the vapor pressure \(P_1\) at any temperature \(T_1\), we can use Equation \(\ref{Eq2}\) to calculate the vapor pressure \(P_2\) at any other temperature \(T_2\), as shown in Example \(\PageIndex{1}\).
A Video Discussing the Clausius-Clapeyron Equation. Video Link: The Clausius-Clapeyron Equation(opens in new window) [youtu.be]
The experimentally measured vapor pressures of liquid Hg at four temperatures are listed in the following table:
| T (°C) | 80.0 | 100 | 120 | 140 |
|---|---|---|---|---|
| P (torr) | 0.0888 | 0.2729 | 0.7457 | 1.845 |
From these data, calculate the enthalpy of vaporization (ΔHvap) of mercury and predict the vapor pressure of the liquid at 160°C. (Safety note: mercury is highly toxic; when it is spilled, its vapor pressure generates hazardous levels of mercury vapor.)
Given: vapor pressures at four temperatures
Asked for: ΔHvap of mercury and vapor pressure at 160°C
Strategy:
- Use Equation \(\ref{Eq2}\) to obtain ΔHvap directly from two pairs of values in the table, making sure to convert all values to the appropriate units.
- Substitute the calculated value of ΔHvap into Equation \(\ref{Eq2}\) to obtain the unknown pressure (P2).
Solution:
A The table gives the measured vapor pressures of liquid Hg for four temperatures. Although one way to proceed would be to plot the data using Equation \(\ref{Eq1}\) and find the value of ΔHvap from the slope of the line, an alternative approach is to use Equation \(\ref{Eq2}\) to obtain ΔHvap directly from two pairs of values listed in the table, assuming no errors in our measurement. We therefore select two sets of values from the table and convert the temperatures from degrees Celsius to kelvin because the equation requires absolute temperatures. Substituting the values measured at 80.0°C (T1) and 120.0°C (T2) into Equation \(\ref{Eq2}\) gives
\[\begin{align*} \ln \left ( \dfrac{0.7457 \; \cancel{Torr}}{0.0888 \; \cancel{Torr}} \right) &=\dfrac{-\Delta H_{vap}}{8.314 \; J/mol\cdot K}\left ( \dfrac{1}{\left ( 120+273 \right)K}-\dfrac{1}{\left ( 80.0+273 \right)K} \right) \\[4pt] \ln\left ( 8.398 \right) &=\dfrac{-\Delta H_{vap}}{8.314 \; J/mol\cdot \cancel{K}}\left ( -2.88\times 10^{-4} \; \cancel{K^{-1}} \right) \\[4pt] 2.13 &=-\Delta H_{vap} \left ( -3.46 \times 10^{-4} \right) J^{-1}\cdot mol \\[4pt] \Delta H_{vap} &=61,400 \; J/mol = 61.4 \; kJ/mol \end{align*} \nonumber \]
B We can now use this value of ΔHvap to calculate the vapor pressure of the liquid (P2) at 160.0°C (T2):
\[ \ln\left ( \dfrac{P_{2} }{0.0888 \; torr} \right)=\dfrac{-61,400 \; \cancel{J/mol}}{8.314 \; \cancel{J/mol} \; K^{-1}}\left ( \dfrac{1}{\left ( 160+273 \right)K}-\dfrac{1}{\left ( 80.0+273 \right) K} \right) \nonumber \]
Using the relationship \(e^{\ln x} = x\), we have
\[\begin{align*} \ln \left ( \dfrac{P_{2} }{0.0888 \; Torr} \right) &=3.86 \\[4pt] \dfrac{P_{2} }{0.0888 \; Torr} &=e^{3.86} = 47.5 \\[4pt] P_{2} &= 4.21 Torr \end{align*} \nonumber \]
At 160°C, liquid Hg has a vapor pressure of 4.21 torr, substantially greater than the pressure at 80.0°C, as we would expect.
The vapor pressure of liquid nickel at 1606°C is 0.100 torr, whereas at 1805°C, its vapor pressure is 1.000 torr. At what temperature does the liquid have a vapor pressure of 2.500 torr?
- Answer
-
1896°C
Boiling Points
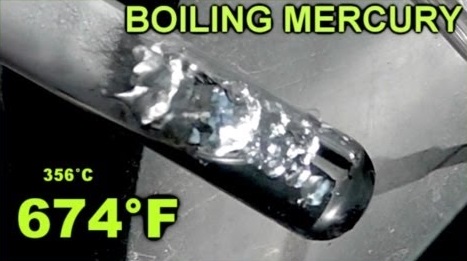
As the temperature of a liquid increases, the vapor pressure of the liquid increases until it equals the external pressure, or the atmospheric pressure in the case of an open container. Bubbles of vapor begin to form throughout the liquid, and the liquid begins to boil. The temperature at which a liquid boils at exactly 1 atm pressure is the normal boiling point of the liquid. For water, the normal boiling point is exactly 100°C. The normal boiling points of the other liquids in Figure \(\PageIndex{4}\) are represented by the points at which the vapor pressure curves cross the line corresponding to a pressure of 1 atm. Although we usually cite the normal boiling point of a liquid, the actual boiling point depends on the pressure. At a pressure greater than 1 atm, water boils at a temperature greater than 100°C because the increased pressure forces vapor molecules above the surface to condense. Hence the molecules must have greater kinetic energy to escape from the surface. Conversely, at pressures less than 1 atm, water boils below 100°C.
| Place | Altitude above Sea Level (ft) | Atmospheric Pressure (mmHg) | Boiling Point of Water (°C) |
|---|---|---|---|
| Mt. Everest, Nepal/Tibet | 29,028 | 240 | 70 |
| Bogota, Colombia | 11,490 | 495 | 88 |
| Denver, Colorado | 5280 | 633 | 95 |
| Washington, DC | 25 | 759 | 100 |
| Dead Sea, Israel/Jordan | −1312 | 799 | 101.4 |
Typical variations in atmospheric pressure at sea level are relatively small, causing only minor changes in the boiling point of water. For example, the highest recorded atmospheric pressure at sea level is 813 mmHg, recorded during a Siberian winter; the lowest sea-level pressure ever measured was 658 mmHg in a Pacific typhoon. At these pressures, the boiling point of water changes minimally, to 102°C and 96°C, respectively. At high altitudes, on the other hand, the dependence of the boiling point of water on pressure becomes significant. Table \(\PageIndex{1}\) lists the boiling points of water at several locations with different altitudes. At an elevation of only 5000 ft, for example, the boiling point of water is already lower than the lowest ever recorded at sea level. The lower boiling point of water has major consequences for cooking everything from soft-boiled eggs (a “three-minute egg” may well take four or more minutes in the Rockies and even longer in the Himalayas) to cakes (cake mixes are often sold with separate high-altitude instructions). Conversely, pressure cookers, which have a seal that allows the pressure inside them to exceed 1 atm, are used to cook food more rapidly by raising the boiling point of water and thus the temperature at which the food is being cooked.
As pressure increases, the boiling point of a liquid increases and vice versa.
Use Figure \(\PageIndex{4}\) to estimate the following.
- the boiling point of water in a pressure cooker operating at 1000 mmHg
- the pressure required for mercury to boil at 250°C

Given: Data in Figure \(\PageIndex{4}\), pressure, and boiling point
Asked for: corresponding boiling point and pressure
Strategy:
- To estimate the boiling point of water at 1000 mmHg, refer to Figure \(\PageIndex{4}\) and find the point where the vapor pressure curve of water intersects the line corresponding to a pressure of 1000 mmHg.
- To estimate the pressure required for mercury to boil at 250°C, find the point where the vapor pressure curve of mercury intersects the line corresponding to a temperature of 250°C.
Solution:
- A The vapor pressure curve of water intersects the P = 1000 mmHg line at about 110°C; this is therefore the boiling point of water at 1000 mmHg.
- B The vertical line corresponding to 250°C intersects the vapor pressure curve of mercury at P ≈ 75 mmHg. Hence this is the pressure required for mercury to boil at 250°C.
Ethylene glycol is an organic compound primarily used as a raw material in the manufacture of polyester fibers and fabric industry, and polyethylene terephthalate resins (PET) used in bottling. Use the data in Figure \(\PageIndex{4}\) to estimate the following.
- the normal boiling point of ethylene glycol
- the pressure required for diethyl ether to boil at 20°C.
- Answer a
-
200°C
- Answer b
-
450 mmHg
Summary
Because the molecules of a liquid are in constant motion and possess a wide range of kinetic energies, at any moment some fraction of them has enough energy to escape from the surface of the liquid to enter the gas or vapor phase. This process, called vaporization or evaporation, generates a vapor pressure above the liquid. Molecules in the gas phase can collide with the liquid surface and reenter the liquid via condensation. Eventually, a steady state is reached in which the number of molecules evaporating and condensing per unit time is the same, and the system is in a state of dynamic equilibrium. Under these conditions, a liquid exhibits a characteristic equilibrium vapor pressure that depends only on the temperature. We can express the nonlinear relationship between vapor pressure and temperature as a linear relationship using the Clausius–Clapeyron equation. This equation can be used to calculate the enthalpy of vaporization of a liquid from its measured vapor pressure at two or more temperatures. Volatile liquids are liquids with high vapor pressures, which tend to evaporate readily from an open container; nonvolatile liquids have low vapor pressures. When the vapor pressure equals the external pressure, bubbles of vapor form within the liquid, and it boils. The temperature at which a substance boils at a pressure of 1 atm is its normal boiling point.
Contributors and Attributions
Modified by Joshua Halpern (Howard University)

