
5.5: Population models
- Page ID
- 294566

\( \newcommand{\vecs}[1]{\overset { \scriptstyle \rightharpoonup} {\mathbf{#1}} } \)
\( \newcommand{\vecd}[1]{\overset{-\!-\!\rightharpoonup}{\vphantom{a}\smash {#1}}} \)
\( \newcommand{\id}{\mathrm{id}}\) \( \newcommand{\Span}{\mathrm{span}}\)
( \newcommand{\kernel}{\mathrm{null}\,}\) \( \newcommand{\range}{\mathrm{range}\,}\)
\( \newcommand{\RealPart}{\mathrm{Re}}\) \( \newcommand{\ImaginaryPart}{\mathrm{Im}}\)
\( \newcommand{\Argument}{\mathrm{Arg}}\) \( \newcommand{\norm}[1]{\| #1 \|}\)
\( \newcommand{\inner}[2]{\langle #1, #2 \rangle}\)
\( \newcommand{\Span}{\mathrm{span}}\)
\( \newcommand{\id}{\mathrm{id}}\)
\( \newcommand{\Span}{\mathrm{span}}\)
\( \newcommand{\kernel}{\mathrm{null}\,}\)
\( \newcommand{\range}{\mathrm{range}\,}\)
\( \newcommand{\RealPart}{\mathrm{Re}}\)
\( \newcommand{\ImaginaryPart}{\mathrm{Im}}\)
\( \newcommand{\Argument}{\mathrm{Arg}}\)
\( \newcommand{\norm}[1]{\| #1 \|}\)
\( \newcommand{\inner}[2]{\langle #1, #2 \rangle}\)
\( \newcommand{\Span}{\mathrm{span}}\) \( \newcommand{\AA}{\unicode[.8,0]{x212B}}\)
\( \newcommand{\vectorA}[1]{\vec{#1}} % arrow\)
\( \newcommand{\vectorAt}[1]{\vec{\text{#1}}} % arrow\)
\( \newcommand{\vectorB}[1]{\overset { \scriptstyle \rightharpoonup} {\mathbf{#1}} } \)
\( \newcommand{\vectorC}[1]{\textbf{#1}} \)
\( \newcommand{\vectorD}[1]{\overrightarrow{#1}} \)
\( \newcommand{\vectorDt}[1]{\overrightarrow{\text{#1}}} \)
\( \newcommand{\vectE}[1]{\overset{-\!-\!\rightharpoonup}{\vphantom{a}\smash{\mathbf {#1}}}} \)
\( \newcommand{\vecs}[1]{\overset { \scriptstyle \rightharpoonup} {\mathbf{#1}} } \)
\( \newcommand{\vecd}[1]{\overset{-\!-\!\rightharpoonup}{\vphantom{a}\smash {#1}}} \)
\(\newcommand{\avec}{\mathbf a}\) \(\newcommand{\bvec}{\mathbf b}\) \(\newcommand{\cvec}{\mathbf c}\) \(\newcommand{\dvec}{\mathbf d}\) \(\newcommand{\dtil}{\widetilde{\mathbf d}}\) \(\newcommand{\evec}{\mathbf e}\) \(\newcommand{\fvec}{\mathbf f}\) \(\newcommand{\nvec}{\mathbf n}\) \(\newcommand{\pvec}{\mathbf p}\) \(\newcommand{\qvec}{\mathbf q}\) \(\newcommand{\svec}{\mathbf s}\) \(\newcommand{\tvec}{\mathbf t}\) \(\newcommand{\uvec}{\mathbf u}\) \(\newcommand{\vvec}{\mathbf v}\) \(\newcommand{\wvec}{\mathbf w}\) \(\newcommand{\xvec}{\mathbf x}\) \(\newcommand{\yvec}{\mathbf y}\) \(\newcommand{\zvec}{\mathbf z}\) \(\newcommand{\rvec}{\mathbf r}\) \(\newcommand{\mvec}{\mathbf m}\) \(\newcommand{\zerovec}{\mathbf 0}\) \(\newcommand{\onevec}{\mathbf 1}\) \(\newcommand{\real}{\mathbb R}\) \(\newcommand{\twovec}[2]{\left[\begin{array}{r}#1 \\ #2 \end{array}\right]}\) \(\newcommand{\ctwovec}[2]{\left[\begin{array}{c}#1 \\ #2 \end{array}\right]}\) \(\newcommand{\threevec}[3]{\left[\begin{array}{r}#1 \\ #2 \\ #3 \end{array}\right]}\) \(\newcommand{\cthreevec}[3]{\left[\begin{array}{c}#1 \\ #2 \\ #3 \end{array}\right]}\) \(\newcommand{\fourvec}[4]{\left[\begin{array}{r}#1 \\ #2 \\ #3 \\ #4 \end{array}\right]}\) \(\newcommand{\cfourvec}[4]{\left[\begin{array}{c}#1 \\ #2 \\ #3 \\ #4 \end{array}\right]}\) \(\newcommand{\fivevec}[5]{\left[\begin{array}{r}#1 \\ #2 \\ #3 \\ #4 \\ #5 \\ \end{array}\right]}\) \(\newcommand{\cfivevec}[5]{\left[\begin{array}{c}#1 \\ #2 \\ #3 \\ #4 \\ #5 \\ \end{array}\right]}\) \(\newcommand{\mattwo}[4]{\left[\begin{array}{rr}#1 \amp #2 \\ #3 \amp #4 \\ \end{array}\right]}\) \(\newcommand{\laspan}[1]{\text{Span}\{#1\}}\) \(\newcommand{\bcal}{\cal B}\) \(\newcommand{\ccal}{\cal C}\) \(\newcommand{\scal}{\cal S}\) \(\newcommand{\wcal}{\cal W}\) \(\newcommand{\ecal}{\cal E}\) \(\newcommand{\coords}[2]{\left\{#1\right\}_{#2}}\) \(\newcommand{\gray}[1]{\color{gray}{#1}}\) \(\newcommand{\lgray}[1]{\color{lightgray}{#1}}\) \(\newcommand{\rank}{\operatorname{rank}}\) \(\newcommand{\row}{\text{Row}}\) \(\newcommand{\col}{\text{Col}}\) \(\renewcommand{\row}{\text{Row}}\) \(\newcommand{\nul}{\text{Nul}}\) \(\newcommand{\var}{\text{Var}}\) \(\newcommand{\corr}{\text{corr}}\) \(\newcommand{\len}[1]{\left|#1\right|}\) \(\newcommand{\bbar}{\overline{\bvec}}\) \(\newcommand{\bhat}{\widehat{\bvec}}\) \(\newcommand{\bperp}{\bvec^\perp}\) \(\newcommand{\xhat}{\widehat{\xvec}}\) \(\newcommand{\vhat}{\widehat{\vvec}}\) \(\newcommand{\uhat}{\widehat{\uvec}}\) \(\newcommand{\what}{\widehat{\wvec}}\) \(\newcommand{\Sighat}{\widehat{\Sigma}}\) \(\newcommand{\lt}{<}\) \(\newcommand{\gt}{>}\) \(\newcommand{\amp}{&}\) \(\definecolor{fillinmathshade}{gray}{0.9}\)5.5. Population models
Authors: A. Jan Hendriks and Nico van Straalen
Reviewers: Aafke Schipper, John D. Stark and Thomas G. Preuss
Learning objectives
You should be able to
- explain the assumptions underlying exponential and logistic population modelling
- calculate intrinsic population growth rate from a given set of demographic data
- outline the conclusions that may be drawn from population modelling in ecotoxicology
- indicate the possible contribution of population models to chemical risk assessment
Keywords: intrinsic rate of increase, carrying capacity, exponential growth,
Introduction
Ecological risk assessment of toxicants usually focuses on the risks run by individuals, by comparing exposures with no-effect levels. However, in many cases it is not the protection of individual plants or animals that is of interest but the protection of a viable population of a species in an ecological context. Risk assessment generally does not take into account the quantitative dynamics of populations and communities. Yet, understanding and predicting effects of chemicals at levels beyond that of individuals is urgently needed for several reasons. First, we need to know whether quality standards are sufficiently but not overly protective at the population level, when extrapolated from toxicity tests. Second, responses of isolated, homogenous cohorts in the laboratory may be different from those of interacting, heterogeneous populations in the field. Third, to set the right priorities in management, we need to know the relative and cumulative effect of chemicals in relation to other environmental pressures.
Ecological population models for algae, macrophytes, aquatic invertebrates, insects, birds and mammals have been widely used to address the risk of potentially toxic chemicals, however, until recently, these models were only rarely used in the regulatory risk assessment process due to a lack of connection between model output and risk assessment needs (Schmolke et al., 2010). Here, we will sketch the basic principles of population dynamics for environmental toxicology applications.
Exponential growth
Ecological textbooks usually start their chapter on population ecology by introducing exponential and logistic growth. Consider a population of size N. If resources are unlimited, and the per capita birth (b) and death rates (d) are constant in a population closed to migration, the number of individuals added to the population per time unit (dN/dt) can be written as:
 or
or 
where r is called the intrinsic rate of increase. This differential equation can be solved with boundary condition N(0) = N0 to yield

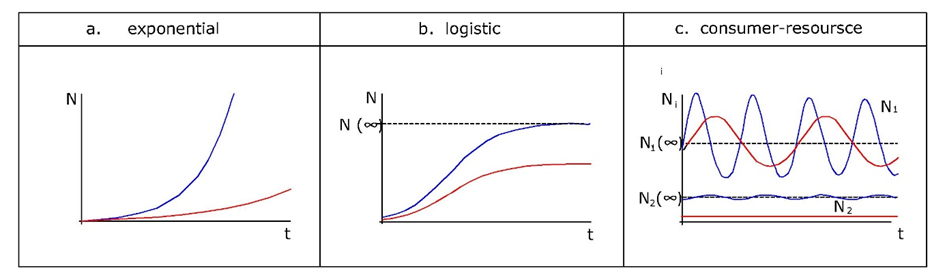
Since toxicants will affect either reproduction or survival, or both, they will also affect the exponential growth rate (Figure 1a). This suggests that r can be considered a measure of population performance under toxic stress. But rather than from observed population trajectories, r is usually estimated from life-history data. We know from basic demographic theory that any organism with "time-invariant" vital rates (that is, fertility and survival may depend on age, but not on time), will be growing exponentially at rate r. The intrinsic rate of increase can be derived from age-specific survival and fertility rates using the so-called Euler-Lotka equation, which reads:

in which x is age, xm maximal age, l(x) survivorship from age zero to age x and m(x) the number of offspring produced per time unit at age x. Unfortunately this equation does not allow for a simple derivation of r; r must be obtained by iteration and the correct value is the one that, when combined with the l(x) and m(x) data, makes the integral equal to 1. Due to this complication approximate approaches are often applied. For example, in many cases a reasonably good estimate for r can be obtained from the age at first reproduction α, survival to first reproduction, S, and reproductive output, m, according to the following formula:

This is due to the fact that for many animals in the environment, especially those with high reproductive output and low juvenile survivorship, age at first reproduction is the dominant variable determining population growth (Forbes and Calow, 1999).
The classical demographic modelling approach, including the Euler-Lotka equation, considers time as a continuous variable and solves the equations by calculus. However, there is an equivalent formalism based on discrete time, in which population events are assumed to take place only at equidistant moments. The vital rates are then summarized in a so-called Leslie matrix, a table of survival and fertility scores for each age class, organized in such a way that when multiplied by the age distribution at any moment, the age distribution at the following time point is obtained. This type of modelling lends itself more easily to computer simulation. The outcome is much the same: if the Leslie matrix is time-invariant the population will grow each time step by a factor λ, which is related to r as ln λ = r (λ = 1 corresponds to r = 0). Mathematically speaking λ is the dominant eigenvalue of the Leslie matrix. The advantage of the discrete-time version is that λ can be more easily decomposed into its component parts, that is, the life-history traits that are affected by toxicants (Caswell, 1996).
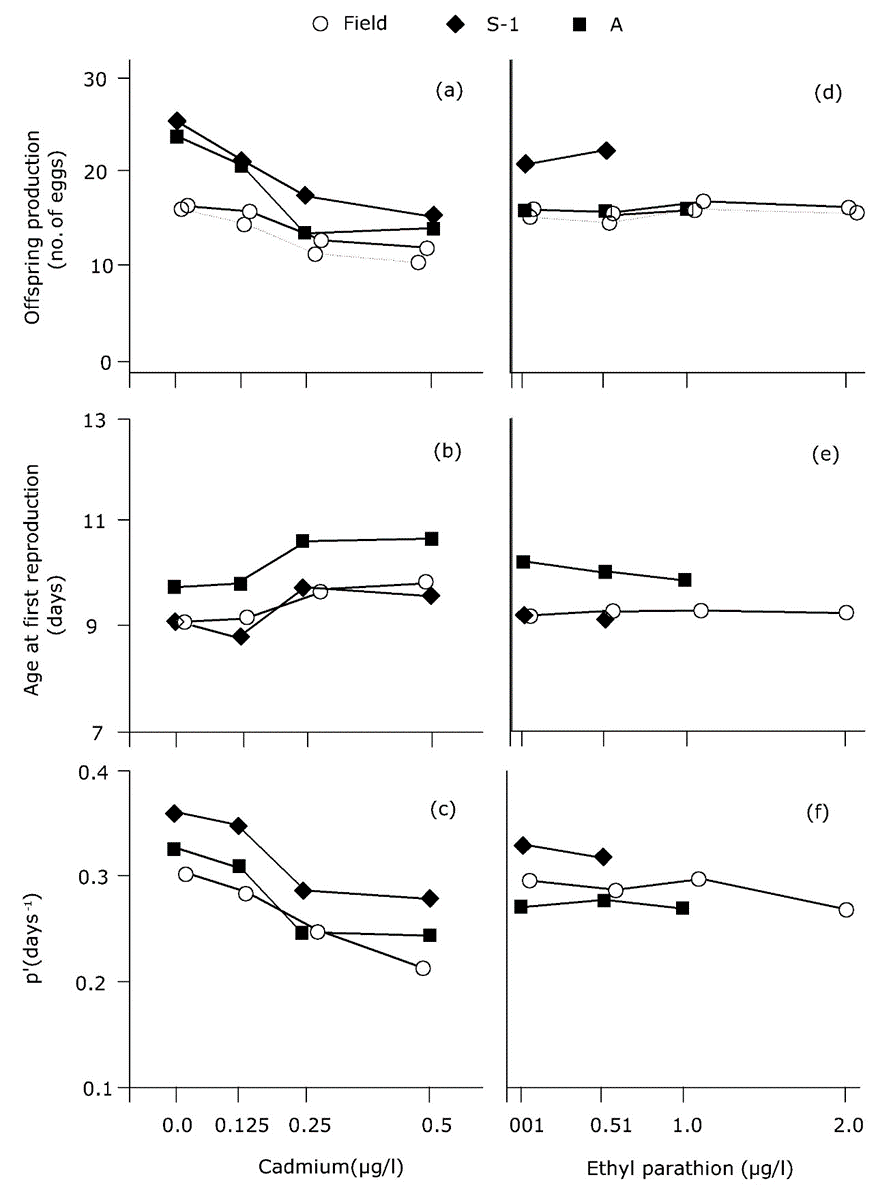
The demographic approach to exponential growth has been applied numerous times in environmental toxicology, most often in studies of water fleas (Suhett et al., 2015), and insects (Stark and Banks, 2003). The tests are called "life-table response experiments" (see section on Population ecotoxicology in a laboratory setting). The investigator observes the effects of toxicants on age-specific survival and fertility, and calculates r as a measure of population performance for each exposure concentration. An example is given in Figure 2, derived from a study by Barata et al. (2000). Forbes and Calow (1999) concluded that the use of r in ecotoxicology adds ecological relevance to the analysis, but it does not necessarily provide a more sensitive or less sensitive endpoint: r is as sensitive as the vital rates underlying its estimation.
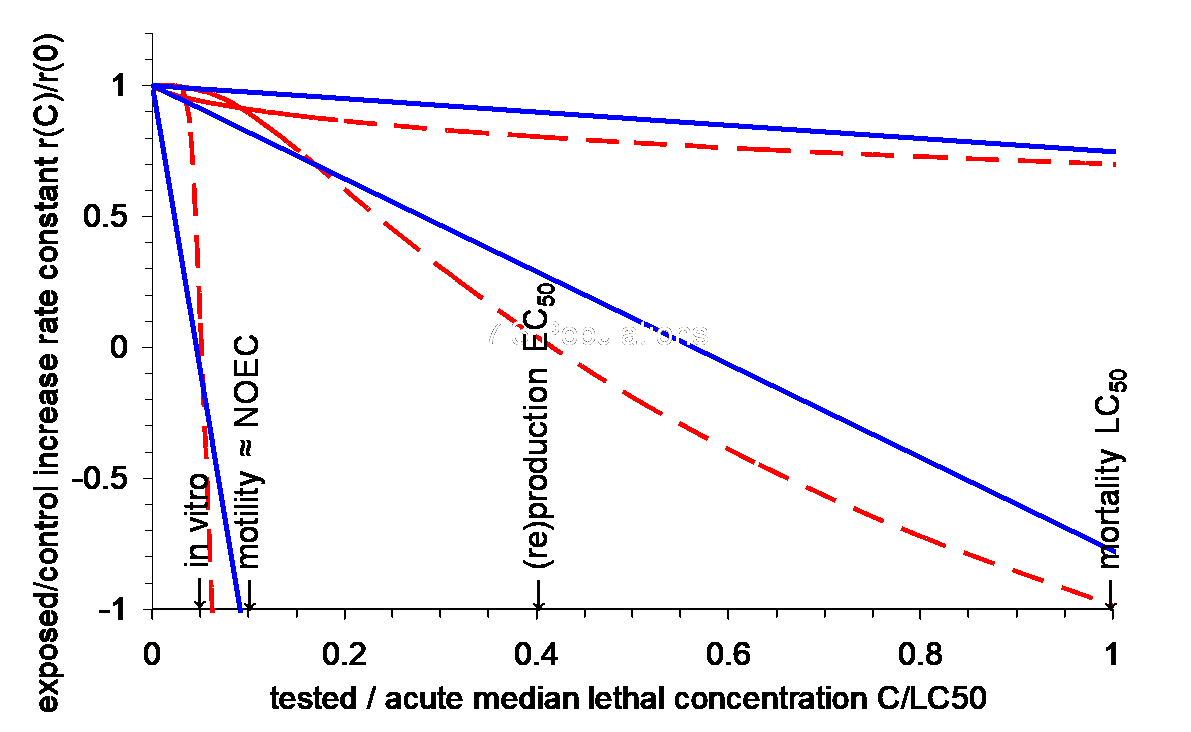
Hendriks et al. (2005) postulated that r should show a near-linear decrease with the concentration of a chemical, scaled to the LC50 (Figure 3). This relationship was confirmed in a meta-analysis of 200 laboratory experiments, mostly concerning invertebrate species (Figure 3). Anecdotal underpinning for large vertebrates comes from field cases where pollution limits population development.
Logistic growth
As exponentially growing populations are obviously rare, models that include some form of density-dependence are more realistic. One common approach is to assume that the birth rate b decreases with density due to increasing scarcity of resources. The simplest assumption is a linear decrease with N, expressed as follows:


The question is, can the parameters of the logistic growth equation be used to measure population performance like in the case of exponential growth? Practical application is limited because the carrying capacity is difficult to measure under natural and contaminated conditions. Many field populations of arthropods, for example, fluctuate widely due to predator-prey dynamics, and hardly ever reach their carrying capacity within a growing season. An experimental study on the springtail Folsomia candida (Noël et al., 2006) showed that zinc in the diet did not affect the carrying capacity of contained laboratory populations, although there were several interactions below K that were influenced by zinc, including hormesis (growth stimulation by low doses of a toxicant), and Allee effects (loss of growth potential at low density due to lower encounter rate).
Density-dependence is expected to act as buffering mechanism at the population level because toxicity-induced population decline diminishes competition, however, the effects very much depend on the details of population regulation. This was demonstrated in a model for peregrine falcon exposed to DDE and PBDEs (Schipper et al., 2013). While the equilibrium size of the population declined by toxic exposure, the probability of individual birds finding a suitable territory increased. However, at the same time the number of non-breeding birds shifting to the breeding stage became limiting and this resulted in a strong decrease in the equilibrium number of breeders.
Mechanistic effect models
To enhance the potential for application of population models in risk assessment, more ecological details of the species under consideration must be included, e.g. effects of dispersal, abiotic factors, predators and parasites, dispersal, landscape structure and many more. A further step is to track the physiology and ecology of each individual in the population. This is done in the dynamic energy budget modelling approach (DEB) developed by (Kooijman et al., 2009). By including such details, a model will become more realistic, and more precise predictions can be made on the effects of toxic exposures. These types of models are generally called "mechanistic effect models' (MEMs). They allow a causal link between the protection goal, a scenario of exposure to toxicants and the adverse population effects generated by model output (Hommen et al., 2015). The European Food Safety Authority (EFSA) in 2014 issued an opinion paper containing detailed guidelines on the development of such models and how to adjust them to be useful in the risk assessment of plant protection products.
References
Caswell, H. (1996). Demography meets ecotoxicology: untangling the population level effects of toxic substances. In: Newman, M.C., Jagoe, C.H. (Eds.). Ecotoxicology. A hierarchical treatment. Lewis Publishers, Boca Raton, pp. 255-292.
Barata, C., Baird, D.G., Amata, F., Soares, A.M.V.M. (2000). Comparing population response to contaminants between laboratory and field: an approach using Daphnia magna ephippial egg banks. Functional Ecology 14, 513-523.
EFSA (2014). Scientific Opinion on good modeling practice in the context of mechanistic effect models for risk assessment of plant protection products. EFSA Panel on Plant Protection and their Residues (PPR). EFSA Journal 12, 3589.
Forbes, V.E., Calow, P. (1999). Is the per capita rate of increase a good measure of population-level effects in ecotoxicology. Environmental Toxicology and Chemistry 18, 1544-1556.
Hendriks, A.J., Maas, J.L., Heugens, E.H.W., Van Straalen, N.M. (2005). Meta-analysis of intrinsic rates of increase and carrying capacity of populations affected by toxic and other stressors. Environmental Toxicology and Chemistry 24, 2267-2277
Hommen, U., Forbes, V., Grimm, V., Preuss, T.G., Thorbek, P., Ducrot, V. (2015). How to use mechanistic effect models in environmental risk assessment of pesticides: case studies and recommendations from the SETAC workshop Modelink. Integrated Environmental Assessment and Management 12, 21-31.
Kooijman, S.A.L.M., Baas, J., Bontje, D., Broerse, M., Van Gestel, C.A.M., Jager, T. (2009). Ecotoxicological Applications of Dynamic Energy Budget theory. In: Devillers, J. (Ed.). Ecotoxicology Modeling, Volume 2, Springer, Dordrecht, pp. 237-260.
Noël, H.L., Hopkin, S.P., Hutchinson, T.H., Williams, T.D., Sibly, R.M. (2006). Towards a population ecology of stressed environments: the effects of zinc on the springtail Folsomia candida. Journal of Applied Ecology 43, 325-332.
Schipper, A.M., Hendriks, H.W.M., Kaufmann, M.J., Hendriks, A.J., Huijbregts, M.A.J. (2013). Modelling interactions of toxicants and density dependence in wildlife populations. Journal of Applied Ecology 50, 1469-1478.
Schmolke, A., Thorbek, P., Chapman, P., Grimm, V. (2010) Ecological models and pesticide risk assessment: current modelling practice. Environmental Toxicology and Chemistry 29, 1006-1012.
Stark, J.D., Banks, J.E. (2003) Population effects of pesticides and other toxicants on arthropods. Annual Review of Entomology 48, 505-519.
Suhett, A.L. et al. (2015) An overview of the contribution of studies with cladocerans to environmental stress research. Acta Limnologica Brasiliensia 27, 145-159.