
2.2: Pollutants with specific properties
- Page ID
- 294541

\( \newcommand{\vecs}[1]{\overset { \scriptstyle \rightharpoonup} {\mathbf{#1}} } \)
\( \newcommand{\vecd}[1]{\overset{-\!-\!\rightharpoonup}{\vphantom{a}\smash {#1}}} \)
\( \newcommand{\id}{\mathrm{id}}\) \( \newcommand{\Span}{\mathrm{span}}\)
( \newcommand{\kernel}{\mathrm{null}\,}\) \( \newcommand{\range}{\mathrm{range}\,}\)
\( \newcommand{\RealPart}{\mathrm{Re}}\) \( \newcommand{\ImaginaryPart}{\mathrm{Im}}\)
\( \newcommand{\Argument}{\mathrm{Arg}}\) \( \newcommand{\norm}[1]{\| #1 \|}\)
\( \newcommand{\inner}[2]{\langle #1, #2 \rangle}\)
\( \newcommand{\Span}{\mathrm{span}}\)
\( \newcommand{\id}{\mathrm{id}}\)
\( \newcommand{\Span}{\mathrm{span}}\)
\( \newcommand{\kernel}{\mathrm{null}\,}\)
\( \newcommand{\range}{\mathrm{range}\,}\)
\( \newcommand{\RealPart}{\mathrm{Re}}\)
\( \newcommand{\ImaginaryPart}{\mathrm{Im}}\)
\( \newcommand{\Argument}{\mathrm{Arg}}\)
\( \newcommand{\norm}[1]{\| #1 \|}\)
\( \newcommand{\inner}[2]{\langle #1, #2 \rangle}\)
\( \newcommand{\Span}{\mathrm{span}}\) \( \newcommand{\AA}{\unicode[.8,0]{x212B}}\)
\( \newcommand{\vectorA}[1]{\vec{#1}} % arrow\)
\( \newcommand{\vectorAt}[1]{\vec{\text{#1}}} % arrow\)
\( \newcommand{\vectorB}[1]{\overset { \scriptstyle \rightharpoonup} {\mathbf{#1}} } \)
\( \newcommand{\vectorC}[1]{\textbf{#1}} \)
\( \newcommand{\vectorD}[1]{\overrightarrow{#1}} \)
\( \newcommand{\vectorDt}[1]{\overrightarrow{\text{#1}}} \)
\( \newcommand{\vectE}[1]{\overset{-\!-\!\rightharpoonup}{\vphantom{a}\smash{\mathbf {#1}}}} \)
\( \newcommand{\vecs}[1]{\overset { \scriptstyle \rightharpoonup} {\mathbf{#1}} } \)
\( \newcommand{\vecd}[1]{\overset{-\!-\!\rightharpoonup}{\vphantom{a}\smash {#1}}} \)
2.2. Pollutants with specific properties
2.2.1. Metals and metalloids
Author: Kees van Gestel
Reviewers: John Parsons, Jose Alvarez Rogel
Learning objectives:
You should be able to:
- describe the difference between metals and metalloids
- describe a classification using different binding affinities of metals to macromolecules and infer on its importance for their toxicity and/or bioaccumulation
- mention important sources of metal pollution
Keywords: Heavy metals, Metalloids, Rare earth elements, Essential elements
Introduction
The majority of the elements in the periodic table consists of metals: Figure 1.

The distinction between metals and heavy metals (density relative to water < or >5 g cm-3) is not very meaningful for such a heterogeneous group of elements with rather different biological and chemical properties. The rare earth elements (REEs), lanthanides and actinides, have, for example, a high density or specific weight but are usually not considered heavy metals because of their rather different chemical behaviour. Metalloids have both metallic and non-metallic properties or are nonmetallic elements that can combine with a metal to produce an alloy. Figure 1 shows the periodic table of elements, indicating the groups of (heavy) metals, metalloids and rare earth elements.
Also indicated in Figure 1 are the elements that are known to be essential to life and include besides C, H, O and N, the major essential elements Ca, P, K, Mg, Na, Cl and S, the trace elements Fe, I, Cu, Mn, Zn, Co, Mo, Se, Cr, Ni, V, Si, As and B (the latter only for plants) and some elements that may support physiological functions at ultra-trace levels (Li, Al, F and Sn) (Walker et al., 2012).
Chemical and physical properties
Except for mercury, most pure metals are solid at room temperature. In general, metals are good electrical and thermal conductors having high luster and malleability. Upon heating, metals readily emit electrons. These descriptors of metals, however, are not very helpful when having to deal with elements that do not exist prominently in the pure elemental state, but rather are present as metal compounds, complexes, and ions at fairly low environmental concentrations.
More useful are characteristics that influence metal transport between environmental compartments and their interaction with abiotic and biotic components of the environment. The speciation, the chemical form in which an element occurs (e.g., oxidized, free ion or complexed to inorganic or organic molecules), determines its transport and interaction in the environment (see Section on Metal Speciation). Chemical bonding is determined by outer orbital electron behavior, with metals tending to lose electrons when reacting with nonmetals. In many normal biological reactions, metals are cofactors within coenzymes (e.g. in vitamins) and can act as electron acceptors and donors during oxidation and reduction reactions (Newman, 2015).
Nieboer and Richardson (1980) proposed a classification, based on the equilibrium constant for the formation of metal complexes. They distinguished:
- Class A-metals: acting as hard Lewis acids (electron acceptors) with high affinity for oxygen-containing groups in macromolecules, such as carboxyl and alcohol groups. Al, Ba, Be, Ca, K, Li, Mg, Na and Sr belong to this group;
- Class B-metals: acting as soft Lewis acids with high affinity for nitrogen- and sulphur-containing groups in macromolecules, such as amino and sulphydryl groups. This group includes Ag, Au, Bi, Hg, Pd, Pt and Tl.
In addition, an intermediate or borderline group is defined, in which the type A or B characteristics are less pronounced. As, Cd, Co, Cr, Cu, Fe, Mn, Ni, Pb, Sb, Sn, Ti, V, and Zn belong to this group.
This classification of metals is highly relevant for the transport across cell membranes, the intercellular storage in granules and the induction of metal-binding proteins as well as for their behaviour in the environment in general.
Occurrence
(Heavy) metals and rare earth elements are diffusely distributed over the Earth, but at some places certain elemental combinations are highly concentrated (in metal ores). Despite this diffuse distribution, differences in background metal concentrations in soils can be large, depending on the type and origin of rock or sediment (Table 1).
Table 1. Background concentrations (mg/kg dry weight) of (heavy) metals and metalloids in crust material and median and maximum concentrations in different top soils across the world. Derived from Kabata-Pendias and Mukherjee (2007) and Alloway (2013).

In general, volcanic rock (e.g. basalt) contains high and sedimented rock (e.g. limestone) low metal levels. But there is no relation between metal concentrations in the Earth's crust and the elemental requirements of organisms.
Emissions of metals
Upon weathering of stone formations and ores, elements are released and enter local, regional and global biogeochemical cycles. Depending on their water solubility and on soil properties and vegetation, metals may be transported through the environment and deposited or precipitated at places close to or far away from their source.
Volcanoes take account of the largest natural input of metals to the environment but the concentrations of these metals in the soil are rarely elevated to toxic levels due to the massive dilution which takes place in the atmosphere. Permanently active volcanoes may be an important local source of (metal) pollution.
A special case is arsenic, that may occur as a natural element of soils. At some places, As levels are fairly high, particularly in ground water. High As-groundwater areas are found in Argentina, Chile, Mexico, China and Hungary, and also in Bangladesh, India (West Bengal), Cambodia, Laos and Vietnam. In the latter countries, especially in the Bengal Basin, millions of wells have been dug to provide safe drinking water. Irrigation pumping leads to an inflow of oxygen and organic carbon, which causes a mobilisation of arsenic normally bound to ferric oxyhydroxides in these soils. As a result in many wells dissolved As concentrations are exceeding the World Health Organisation (WHO) guideline value of 10 µg/L for drinking water.
Important anthropogenic sources of metals in the environment include:
- Metal mining, which may also lead to an enormous physical disturbance of the environment (destruction of ecosystems).
- Metal smelting.
- Use of metals in domestic and industrial products, and the discharge of domestic waste and sewage.
- Metal-containing pesticides, e.g. 'Bordeaux Mixture (copper sulphate with lime (Ca(OH)2), used as a fungicide in viniculture, hop-growing and fruit-culture, and metal-containing fungicides, such as organo-tin compounds.
- The use of metals and especially of REEs in microelectronics.
- Energy-producing industries burning coal and oil, and producing metal-containing fly ash.
- Transport of energy and traffic making use of electricity, giving rise to corrosion of electric wires and pylons.
- Non-metal industries, e.g. leather (chromium) and cement production (thallium).
- , using Tetra Ethyl Lead (TEL) as anti-knocking agent in petrol (nowadays banned in most countries) and the use of catalysts in cars (platinum, palladium).
Anthropogenic releases of many metals, such as Pb, Zn, Cd and Cu, are estimated to be between one and three orders of magnitude higher than natural fluxes (Depledge et al. 1998). An estimated amount of up to 50,000 tonnes of mercury are released naturally per year as a result of degassing from the Earth's crust, but human activities account for even larger emissions (Walker et al. 2012).
References
Alloway, B.J. (2013). Heavy Metals in Soils. Trace Metals and Metalloids in Soils and their Bioavailability. Third Edition. Environmental Pollution, Volume 22, Springer, Dordrecht.
Depledge, M.H., Weeks, J.M., Bjerregaard, P. (1998). Heavy metals. In: Calow, P. (Ed.). Handbook of Ecotoxicology. Blackwell Science, Oxford, pp. 543-569.
Kabata-Pendias, A., Mukherjee, A.B. (2007). Trace Elements from Soil to Human. Springer Verlag, Berlin.
Newman, M.C. (2015). Fundamentals of Ecotoxicology. The Science of Pollution. Fourth Edition. CRC Press, Taylor & Francis Group. Boca Raton.
Nieboer, E., Richardson, D.H.S. (1990). The replacement of the nodescript term 'Heavy metals' by a biologically and chemically significant classification of metal ions. Environmental Pollution (Ser. B) 1, 3-26.
Walker, C.H., Hopkin, S.P., Sibly, R.M., Peakall, D.B. (2012). Principles of Ecotoxicology, Fourth Edition. CRC Press Taylor & Francis Group, London.
Why can the term heavy metal not be used when referring to different elements considered metals?
Why are some elements indicated as essential elements?
Why is the classification of Nieboer and Richardson relevant for the biological interactions of metals with living organisms?
Name at least 5 sources of metal emission to the environment.
Besides leading to the emission of metals, metal mining may another important environmental effect. Which one?
2.2.2. Radioactive compounds
in preparation
2.2.3. Industrial Chemicals
Authors: Steven Droge
Reviewer: Michael McLachlan
Leaning objectives:
You should be able to
- discuss a history perspective on key chemical legislations around the world
- look up registration dossiers yourself to obtain relevant ecotoxicological information
- realize that complete dossiers are most urgent for high production tonnage substances and the most hazardous substances
- understand why for some groups of chemicals already specific regulations were in place apart from common industrial substances.
Keywords: Chemical industry, tonnage, hazardous chemicals, REACH, regulation
Introduction
The chemical industry produces a wide variety of chemicals that find use in industrial process and as ingredients in day-to-day products for consumers. Instead of chemicals, 'substances' may be a more carefully worded description as it also includes complex mixtures, polymers and nanoparticles. Many substances are produced by globally distributed companies in very high volumes, ranging for example from 100 - 10,000 tonnes (1 tonne = 1000 kg) per year. Worldwide, governments have tried to control and assess chemical safety, as nicely summarized on the ChemHAT website. Australia for example, has the Industrial Chemicals (Notification and Assessment) Act 1989 (2013 version). Just like elsewhere in the world, in the European Union (EU) a variety of regulatory institutes at all levels of government used to perform safety assessments regarding the use of substances in products, and how these are emitted into waste streams. This changed dramatically in 2007.
On June 1st, 2007 (Figure 1), a new EU regulation went into force called REACH (official legislation documents C 1907/2006; about REACH; EU info on REACH). This law reversed the role of governments in chemical safety assessment, because it placed the burden of proof on companies that manufacture a chemical, import a chemical into the EU, or apply chemicals in their products. Within REACH companies must identify and manage the risks linked to the chemicals they manufacture and market in the EU. REACH stands for Registration, Evaluation, Authorisation and Restriction of Chemicals. China soon followed with the analogous "China REACH" in 2010, and then came South Korea in 2015 with "K-REACH". The main focus in this module is on EU-REACH as the leading and well documented example. Other legislation regulating industrial chemicals can often be easily found online, e.g. via the ChemHAT link above.

In REACH, each chemical is registered only once. Accordingly, companies must work together to prepare one dossier that demonstrates to the European Chemical Agency (ECHA) how chemicals can be safely used, and they must communicate the risk management measures to the users. ECHA, or any Member State, authorizes the dossiers, and can start a "restriction procedure" when they are concerned that a certain substance poses an unacceptable risk to human health or the environment. If the risks cannot be managed, authorities can restrict the use of substances in different ways. In the long run, the most hazardous substances should be substituted with less dangerous ones.
So which chemicals have been registered in the past decade (2008-2018) in REACH?
In principle, REACH applies to all chemical 'substances' in the EU zone. This includes metals, such as "iron" and "chromium", organic chemicals such as "methanol" and "fatty acids" and "ethyl-4-(8-chloro-5,6-dihydro-11H-benzo[5,6]cyclohepta[1,2-b]pyridin-11-ylidene)piperidine-1-carboxylate (see Box 1)", and (nano)particles like "zink oxide" and "silicon dioxide", and polymers. Discover for example the registration dossier link in Box 1.
|
Box 1. Examples from the REACH dossiers The REACH registration data base can be searched via LINK. Accept the disclaimer, and you are ready to search for chemicals based on name, CAS number, substance data, or use and exposure data. Search for example for the name "ethyl 4-(8-chloro-5,6-dihydro-11H-benzo[5,6]cyclohepta[1,2-b]pyridin-11-ylidene)piperidine-1-carboxylate" and you find the link to the dossier of this substance with CAS 79794-75-5 as compiled by the registrant. This complex chemical name is better known as the antihistamine drug Loratadine, but this name does not show up in the dossier search! Click on the name to get basic information on the compound. The hazard classification reads: "Warning! According to the classification provided by companies to ECHA in REACH registrations this substance is very toxic to aquatic life, is very toxic to aquatic life with long lasting effects, is suspected of causing cancer, causes serious eye irritation, is suspected of causing genetic defects, causes skin irritation, may cause an allergic skin reaction and may cause respiratory irritation." This compound is "PBT" labeled based on limited available data (classifying as a combination of Persistent / Bioaccumulative / Toxic). However, the section [About this substance] reads: "for industrial use resulting in the manufacture of another substance (use of intermediates)." As an intermediate in a restricted process, many parts of the dossier did not have to be completed for REACH. As a medicinal product Loratadine is strictly regulated elsewhere. Scroll down to the REACH link for the registration dossier (.../21649) to find out more the different entries for this chemical.
If we do a search for [" Bisphenol "], we get a long list of optional chemicals, for example Bisphenol A (CAS 80-05-7) but also for example Bisphenol S if you scroll down further (CAS 80-09-1). If we look at the dossier of the first Bisphenol A entry, with tonnage "100 000 - 1 000 000 tonnes per annum", you can find a long list of REACH information packages besides the dossier, as this chemical is hotly debated. The dossier for Bisphenol A was evaluated in 2013, and also this is available (look for the pdf in the Dossier evaluation status). In this compliance check, the registrant is requested to submit additional rat and mouse toxicity data, along with statements of reasons. There is for example also a link to the [Restriction list (annex XVII)], which leads to a pdf called 66.pdf, which states an adopted restriction for this chemical within the REACH framework and the previous legislation, Directive 76/769/EEC: "Shall not be placed on the market in thermal paper in a concentration equal to or greater than 0,02 % by weight after 2 January 2020". Find your own chemical of interest to discover more on the transparancy of the chemical information on which risk assessment is based. |

However, some groups of chemicals are (partly) exempt from REACH because they are covered by other legislation in the EU:
- Active substances used in plant protection products (Section 2.3.1) and biocidal products (Section 2.3.2) are considered as already having been registered and assessed by institutes separate from ECHA. Biocides such as disinfectants and pest control products are per definition hazardous chemicals, but they are also very useful in many ways. The very strict and elaborate biocide laws aim to verify that the potential risk of harm associated with the intended emission scenarios is in balance with expected benefits.
- Food and feedstuff additives (Section 2.3.9) have different legislation and authorisation laws to demonstrate (following a scientific evaluation) that the additive has no harmful effects on human and animal health or on the environment ( developed since 1988, schematic graph, Regulation (EC) No 1331/2008)
- Medicinal products (Sections 2.3.3 and 2.3.4) have different legislation and authorisation laws to guarantee high standards of quality and safety of medicinal products, while promoting the good functioning of the internal market with measures that encourage innovation and competiveness (starting with Directive 65/65 in 1965, an overview since, a pdf of the 2001 EU legislation 2001/83/EC)
- "Waste" is not part of the REACH domain, but a product recovered from waste is not.
A detailed overview of European chemical safety guidelines related to chemicals with different application types is presented in Figure 2 in Van Wezel et al. (2017).
Following pre-registration of the 145,297 chemicals most likely to require regulation, REACH came into force in 2008 in a stepwise process with different deadlines for different groups of chemicals. The first dossiers were to be completed by 2010 for the highest produced volume chemicals (>1000 tonnes/y) and the most hazardous chemicals (CMRs >1 tonne/y, and chemicals with known very high aquatic toxicity >100 tonnes/y). These groups potentially pose the greatest risk because of either their high emissions or their inherent toxicity. In 2013, registration dossiers for chemicals with a lower tonnage (100-1000 tonnes/y) were to be completed. By May 31 2018, all chemicals with a quantity of 1-100 tonnes/y chemicals on the EU market should have been registered. New chemicals will all be subject to the REACH procedures.
In 2018, 21.787 substances had been registered under REACH. A total of 14.262 companies were involved. In comparison, 15.500 substances were registered in 2016 (i.e., 6287 chemicals were added in the two following years). In 2018, 48% of all substance registrations had been done in Germany. For 24% of the registered substances a dossier was already available prior to REACH, 70% are "old chemicals" for which no registration had been done before REACH was initiated, and only 6% are newly developed substances that needed to be registered before manufacture or import could start.
There are multiple benefits of REACH regulation of industrial chemicals. Most data on chemicals entered in the registration process is publically available, creating transparency and improving customer awareness. If registered chemicals are classified as Substance of Very High Concern (SVHC) based on the chemical information in these dossiers and after agreement from research panels, alternatives that passed the same regulation can be suggested instead.
The necessity to add data on potential toxicity for so many chemicals has been combined with a strong focus on, and further development of, animal friendly testing methods. Read-across from related chemicals, weight of evidence approaches, and calculations based on chemical structures (QSAR) allow much experimental testing to be circumvented. In vitro studies are also used, but a 2017 REACH document (REACH alternatives to animal testing 2017, which followed up 2011 and 2014 reports) reports that 5.795 in vitro studies were used overall to determine endpoints for REACH, compared to 9,287 in vivo studies (ratio of 0.6). Clearly, many new animal tests have been performed under REACH to complete the dossiers on industrial chemicals. Prenatal developmental and repeated dose toxicity testing as well as extended one generation reproductive toxicity studies remain difficult to circumvent without animal use. However, the safe use of industrial chemicals must be ensured and demonstrated.
References:
Van Wezel, A.P., Ter Laak, T.L., Fischer, A., Bäuerlein, P.S., Munthee, J., Posthuma, L. (2017). Mitigation options for chemicals of emerging concern in surface waters; operationalising solutions-focused risk assessment . Environmental Science: Water Research 3, 403-414.
Name three important advantages of the set-up of an international chemical legislation such as REACH.
Name three important challenges, or even disadvantages, of the set-up of an international chemical legislation such as REACH.
The total amount of chemical substances for which CAS numbers have been appointed, was 68,062,538 on June 28, 2019. The CAS REGISTRY is updated daily with thousands of new substances. Provide some reasons why only 21,787 substances have been registered for REACH in 2018.
2.2.4. POPs
(draft)
Authors: Jacob de Boer
Reviewer:
Leaning objectives:
You should be able to
- understand how POPs are defined
- recognize chemical structures of POPs
- gain knowledge on the purpose of the Stockholm Convention on POPs
Keywords: Persistence, bioaccumulation, long range transport, toxicity, analysis
Introduction
Chemicals are generally produced because they have a useful purpose. These purposes can vary widely, such as to protect crops by killing harmful insects or fungi, to protect materials against catching fire, to act as a medicine, to enable a proper packing of food materials, etc. Unfortunately, the properties which make a chemical attractive to use, often have a downside when it comes to environmental behavior and/or human health. A number of synthetic chemicals have properties that make them persistent organic pollutants (POPs). POPs are xenobiotic (foreign to the biosphere) chemicals that are persistent, bioaccumulative and toxic ('PBT') in low doses. In addition, they are transported over long distances. Criteria for these properties, which are used to define a chemical as a POP, were set by the United Nations (UN) Stockholm Convention, which was adopted in 2001 and entered into force in 2004 (Fiedler et al., 2019). These criteria are summarized in Table 1 (http://chm.pops.int). The objective of the Stockholm Convention is defined in article 1: "Mindful of the precautionary approach, to protect human health and the environment from the harmful impacts of persistent organic pollutants". Initially, 12 chemicals (aldrin, chlordane, dieldrin, DDT, endrin, heptachlor, hexachlorobenzene (HCB), mirex, polychlorinated biphenyls (PCBs), polychlorinated dibenzo-p-dioxins (PCDDs), polychlorinated dibenzofurans (PCDFs) and toxaphene) were listed as POPs. Gradually the list was extended with new POPs, which appeared to fulfil the criteria. For some of the new chemicals exceptions were made for limited use, in case no suitable alternatives are available. For example, in the battle against malaria DDT can still be used to a limited extent for in-house spraying in Africa (Van den Berg, 2009). Until now all POPs are chemicals that contain carbon and halogen atoms. Some POPs, such as the PCDDs and PCDFs (together often short-named as dioxins) are not intentionally produced. They are formed and released unintentionally during thermal processes. PCDDs and PCDFs tended to be released by waste incinerators (Karasek and Dickson, 1987). The combination of elevated temperatures and the presence of chlorine from e.g. polyvinylchloride (PVC) led to the formation of the extremely toxic PCDDs and PCDFs. Stack emissions could contaminate entire areas around the incinerators with consequences for the quality of cow milk or local crop. Dioxins were first discovered after the Seveso (Italy) disaster (1976) when high quantities of dioxins were released after an explosion in a trichlorophenol factory (Mocarelli et al., 1991). Meanwhile, in many countries incinerators have been improved by changing the processes and installing appropriate filters.
Table 1. Stockholm Convention criteria for persistence, bioaccumulation, toxicity and long range transport of POPs.
|
Persistence |
|
|
i |
Evidence that the half-life of the chemical in water is greater than two months, or that its half-life in soil is greater than six months, or that its half-life in sediment is greater than six months; or |
|
ii |
Evidence that the chemical is otherwise sufficiently persistent to justify its consideration within the scope of this Convention |
|
Bioaccumulation |
|
|
i |
Evidence that the bio-concentration factor or bio-accumulation factor in aquatic species for the chemical is greater than 5,000 or, in the absence of such data, that the log Kow is greater than 5 |
|
ii |
Evidence that a chemical presents other reasons for concern, such as high bioaccumulation in other species, high toxicity or ecotoxicity; or |
|
iii |
Monitoring data in biota indicating that the bio-accumulation potential of the chemical is sufficient to justify its consideration within the scope of this Convention |
|
Long range transport potential |
|
|
i |
Measured levels of the chemical in locations distant from the sources of its release that are of potential concern |
|
ii |
Monitoring data showing that long-range environmental transport of the chemical, with the potential for transfer to a receiving environment, may have occurred via air, water or migratory species; or |
|
iii |
Environmental fate properties and/or model results that demonstrate that the chemical has a potential for long-range environmental transport through air, water or migratory species, with the potential for transfer to a receiving environment in locations distant from the sources of its release. For a chemical that migrates significantly through the air, its half-life in air should be greater than two days |
|
Adverse effects |
|
|
i |
Evidence of adverse effects to human health or to the environment that justifies consideration of the chemical within the scope of this Convention; or |
|
ii |
Toxicity or ecotoxicity data that indicate the potential for damage to human health or to the environment |
Structures and use
Whereas all initial POPs were chlorinated chemicals and mainly pesticides, POPs that were added at a later stage also included brominated and fluorinated compounds and chemicals with a more industrial application. Brominated diphenylethers (PBDEs) and hexabromocyclododecane (HBCD) belong to the group of brominated flame retardants. These chemicals are being produced in high quantities. Many national legislations require the use of flame retardants in many materials, such as electric and electronic systems (TV, cell phones, computers), furniture and building materials. Although the PBDEs and HBCD have been banned in most countries, other brominated flame retardants are still being produced in annually growing volumes.

Perfluorinated alkyl substances (PFASs) have many applications. Examples are Teflon production, use in fire-fighting foams, ski wax, as dirt and water repellant on outdoor clothes and carpets and many more. They are different from most other POPs because they are both lipophilic and hydrophilic due to a polar group present in most of the molecules. Examples of structures of a few POPs are given in Figure 1.
Persistence and bioaccumulation
The carbon-halogen bond is so strong that any type of degradation is unlikely to occur or will only occur on the long term and to a minor extent. Due to the size of the halogen atom, the strength of the halogen-carbon bond decreases from C-F to C-Cl, C-Br and C-I. In addition, these halogenated chemicals are lipophilic and, therefore, easily migrate to lipids, such as in living organisms. Because fish is a primary target, POPs enter the food chain in this way and biomagnification can occur (De Boer et al., 1998). High levels of POPs are, consequently, found in marine mammals (seals, whales, polar bears) and also in humans (Meironyte, 1999). Women may transfer a part of their POP load again to their children, the highest quantities to their firstborns.
Long range transport
Chemicals that migrate significantly through the air with a half-life in air greater than two days qualify for the POP criterion of long range transport. Many chemicals are indeed transported by air, often in different stages. Chemicals are emitted from a stack or evaporate from the soil in relatively warm areas and travel in the atmosphere toward cooler areas, condensing out again when the temperature drops. This process, repeated in 'hops', can carry them thousands of kilometers within days. This is called the 'grasshopper effect' (Gouin et al., 2004). It results in colder climate zones, in particular countries around the North Pole, receiving relatively high amounts of POPs.
Adverse environmental and health effects
There is very little doubt on the toxicity of POPs. Of course, the dose is always determining if a compound is causing an effect in the environment or in humans. POPs, however, are very toxic at very low doses. The Seveso disaster showed the high toxicity of dioxins for humans. Polybrominated biphenyls (PBBs) caused a high mortality in cattle when they were inadvertently fed with these chemicals (Fries and Kimbrough, 2008). Evidence of toxicity is often coming from laboratory studies with animals (in vivo) and more recently from in vitro studies. These studies are in particular important for the assessment of chronic toxicity. Many POPs are carcinogenic or act as endocrine disruptor.
Analysis
The analysis of POPs in environmental or human matrices is relatively complicated and costly. The compounds need to be isolated from the matrix by extraction. Subsequently, the extracts need to be cleaned from interfering compounds such as fat from organisms or sulphur in case of sediment or soil samples. Finally, due to the required sensitivity and selectivity, expensive instrumentation such as gas or liquid chromatography combined with mass spectrometry is needed for their analysis (Muir and Sverko, 2006). UN Environment is investing in large capacity building programs to train laboratories in developing countries in this type of analysis. According to the Stockholm Convention, countries shall manage stockpiles and wastes containing POPs in a manner protective of human health and the environment. POPs in wastes are not allowed to be reused or recycled. A global monitoring program has been installed to assess the effectiveness of the Convention.
Future
Much has to be done to achieve the original goals of eliminating the production and use of POPs and gradually reduce their spreading into the environment. A global treaty such as the Stockholm Convention with 182 countries involved is in a continuous challenge with procedures and political realities in countries, which hamper the achievement of perceived simple goals such as to eliminate the use of PCBs in 2025. The goals are, however, extremely important, as POPs are a global threat for current and future generations.
References
De Boer, J., Wester, P.G., Klamer, J.C., Lewis, W.E., Boon, J.P. (1998). Brominated flame retardants in sperm whales and other marine mammals - a new threat to ocean life? Nature 394, 28-29.
Fiedler, H., Kallenborn, R., de Boer, J., Sydnes, L.K. (2019). United Nations Environment Programme (UNEP): The Stockholm Convention - A Tool for the global regulation of persistent organic pollutants (POPs). Chem. Intern. 41, 4-11.
Fries, G.F., Kimbrough, R.D. (2008). The PBB episode in Michigan: An overall appraisal. CRC Critical Rev. Toxicol. 16, 105-156.
Gouin, T., Mackay, D., Jones, K.C., Harner, T., Meijer, S.N. (2004). Evidence for the "grasshopper" effect and fractionation during long-range atmospheric transport of organic contaminants. Environ. Pollut. 128, 139-148.
Karasek, F.W., Dickson, L.C. (1987). Model studies of polychlorinated dibenzo-p-dioxin formation during municipal refuse incineration. Science 237, 754-756.
Meironyte, D., Noren, K., Bergman, Å. (1999). Analysis of polybrominated diphenyl ethers in Swedish human milk. A time-related trend study, 1972-1997. J. Toxicol. Environ. Health Part A 58, 329-341.
Mocarelli, P., Needham, L.L., Marocchi, A., Patterson Jr., D.G., Brambilla, P., Gerthoux, P.M. (1991). Serum concentrations of 2,3,7,8‐tetrachlorodibenzo‐p‐dioxin and test results from selected residents of Seveso, Italy. J. Toxicol. Environ. Health 32, 357-366.
Muir, D.C.G., Sverko, E. (2006). Analytical methods for PCBs and organochlorine pesticides in environmental monitoring and surveillance: a critical appraisal. Anal. Bioanal. Chem. 386, 769-789.
Van den Berg H. (2009). Global status of DDT and its alternatives for use in vector control to prevent disease. Environ. Health Perspect. 117:1656-63.
Which criteria are used by the Stockholm Convention to define chemicals as POPs?
What are the objectives of the Stockholm Convention on POPs?
How can dioxins be formed?
Why is the analysis of POPs in environmental and human matrices expensive?
2.2.5. Persistent Mobile Organic Chemicals (PMOCs)
Authors: Pim de Voogt
Reviewers: John Parsons, Hans Peter Arp
Leaning objectives:
You should be able to:
- define a substance's persistence
- define a partition coefficient
- understand the relationship between KOW, DOW, KD and mobility
- understand the relationship between a substance's mobility and persistence on the one hand and its potential for human exposure on the other
Keywords: Mobility, persistence, PMT
Introduction
Ecosystems and humans are protected against exposure to hazardous substances in several ways. These include treating our wastewater so that substances are prevented from entering receiving surface waters, and purification of source waters intended for drinking water production.
Currently, a majority of the drinking water produced in Europe is either not treated or treated by conventional technologies. The latter remove substances by degradation (physical, microbiological) or by sorption. However, chemicals that are difficult to break down and that can pass through soil layers, water catchments and riverbanks and cross natural and technological barriers may eventually reach the tap water. Typically, these chemicals are persistent and mobile.
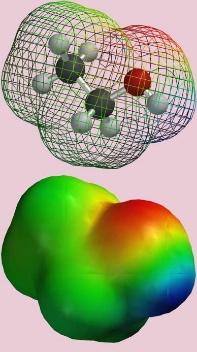
Polarity
When the electrons in a molecule are unevenly divided over its surface, this results in an asymmetric distribution of charge, with positive and negative regions. Such molecules have electric dipoles (see Figure 1) and are polar, in contrast to molecules where the charge is evenly distributed thus resulting in the molecule being neutral or apolar. The ultimate form of polarity is when a permanent charge is present in a compound. Such chemicals are called ionogenic. We distinguish between cations (having a permanent positive charge, e.g. protonated bases, and quaternary amines) and anions (negatively charged ions, e.g. dissociated acids, and organosulfates). Ionic charges in molecules can be pH dependent (e.g. acids and bases). Most, and in particular small, polar and ionic chemicals are water soluble, in other words they have a strong affinity to water (often referred to as hydrophilic). Because water is one of the most polar liquids possible (a strong negative charge on the oxygen and two strong positive charges on each hydrogen), this means that for very polar organic molecules solvation by water is more favorable energetically then sorption to solid particles.

Chemicals that are nonpolar are inherently poorly water soluble and therefore tend to escape from the water compartment, resulting in their evaporation, or sorption to sediments and soils, or uptake and accumulation in organisms. It is therefore relatively easy to remove them from water during water treatment. In contrast, mobile organic chemicals, especially those that do not breakdown easily, pose a more serious threat for (drinking) water quality because they are much more difficult to remove. It should be noted that mobility and polarity can be thought of as a gradient, rather than a distinct category, with water being the most polar molecule, a large aliphatic wax being the most non-polar molecule, and all other organic molecules falling somewhere in the spectrum between.
In a recent study contaminants were analysed in Dutch water samples covering the journey from WWTP effluent to surface water to groundwater and then to drinking water. While the concentration level of total organic contaminants decreased by about 2 orders of magnitude from the WWTP effluents to the groundwater used for drinking water production, the hydrophilic contaminants (using chromatographic retention time as an indicator for hydrophilicity) in the WWTP effluents remained in the water throughout its passage to groundwater and into the drinking water (see Figure 2).

Mobility and persistence
The mobility of chemicals in aquatic ecosystems is determined by their distribution between water and solid particles. The more the substance has an affinity for the solid phase the less mobile it will be. The distribution coefficient is known as KD, which expresses the ratio between the concentrations in the solid phase (soil, sediment, suspended particles), CS, and the dissolved phase at equilibrium, CW, i.e. KD = CS/CW. For neutral non-polar chemicals the distribution is almost entirely determined by the amount of organic carbon in the solid phase, fOC, and hence their distribution is usually expressed by KOC, the organic carbon-normalized KD (i.e. KOC = KD/ fOC). Unfortunately, there are relatively few reliable KD or KOC data available, in particular for polar chemicals. Instead, KOW is often used as a proxy for KOC. The n-octanol/water partition coefficient: KOW, is the equilibrium distribution coefficient of a chemical between n-octanol and water, KOW = Coctanol/Cwater. It's logarithmic value is often used as a proxy to express the polarity of a compound: a high log KOW means that the compound favors being in the octanol phase rather than in water, which is typically the case for a nonpolar compound. For ionizable chemicals we need to account for the pH dependency of KOW: at low pH an organic acid will become protonated (this in turn depends on its pKa value) and thus less polar. DOW is the pH-dependent KOW. It can be assumed that ions, whether cationic or anionic, will no longer dissolve into octanol but rather be retained in the water, because ions have much higher affinity for water than for octanol.
Accounting for this, for organic acids, the pH dependency of the DOW can be expressed as:


Therefore, as pH increases above the pKa, the smaller the DOW will get in the case of organic acids. In the case of basis, the opposite is true; the more the pH dips below the pKa of an organic base, the more cations form and the lower the Dow becomes.
However, one has to keep in mind that the assumption that the (log) KOW or DOW value inversely correlates with a compound's aquatic mobility is, certainly, very simplistic. The behavior of an ionic solute will obviously also be determined by interactions i) with sites other than organic carbon, e.g. ionizable or ionic sites on soil and sediment particles, and ii) with other ions in solution.
The persistence of a compound is assessed in experimental tests by monitoring the rate of disappearance of the compound from the most relevant compartment. This is often done using standardized test protocols. In the European REACH legislation of chemicals, criteria have been established to qualify chemicals as persistent (P) and "very persistent"(vP) based on the outcomes of such tests. Table 1 presents the P and vP criteria used. Unfortunately, good-quality experimental data on half-lives are rare and obtaining such data requires both time-consuming and expensive testing.
Currently there is no certified definition of a compound's mobility (M). Several possible compound properties have been proposed to characterize mobility, including a compound's aqueous solubility or its KOC value. If (experimental) KOC values are not available, DOW values can be used as a proxy.
Table 1. P and vP criteria identical to Annex XIII to the REACH regulation (source: ECHA chapter R.11. Version 3.0, June 2017)
|
Persistent (P) in any of the following situations |
Very persistent (vP) in any of the following situations |
|
|
Freshwater |
Half-life > 40 days |
Half-life > 60 days |
|
Marine water |
Half-life > 60 days |
Half-life > 60 days |
|
Freshwater sediment |
Half-life > 120 days |
Half-life > 180 days |
|
Marine sediment |
Half-life > 180 days |
Half-life > 180 days |
|
Soil |
Half-life > 120 days |
Half-life > 180 days |
Table 2. Proposed cut off values of compound properties proposed by the German Environmental Agency (UBA) to define substance mobility*
|
Mobile (M) if compound is P or vP and any of the following situations |
very Mobile (vM) if compound is P or vP and any of the following situations |
|
|
Lowest experimental log KOC (at pH 4-9) |
≤4.0 |
≤3.0 |
|
Log DOW (at pH 4-9) |
≤4.0 if no experimental Log KOC data available |
≤3.0 if no experimental Log KOC data available |
* note that the proposed criteria may change by the time of publication
Regulation and gaps in knowledge
The majority of chemicals for which international guidelines exist or that are identified as priority pollutants in existing regulations (e.g. EU Water Framework Directive and REACH), are nonpolar with log DOW values mostly above two (see Figure 3b). The German Ministry of Environment (UBA) has recently proposed to develop regulation for chemicals with P, M and toxic (T) properties (PMT substances) analogous to the existing PBT criteria used for regulation of chemicals in the EU. UBA proposed to use cut-off values of the KOC or DOW (if KOC data are not available) to define Mobile (M) or very mobile (vM) in conjunction with persistence criteria (see Table 2). Note that the KOC and DOW values have to be obtained from testing at an environmentally relevant pH range (pH 4-9).

When we consider current analytical techniques used for monitoring contaminants in the environment, it can be readily seen that the scope of techniques most often used (gas chromatography, GC, and reversed-phase liquid chromatography, RPLC) do not overlap with what is required for chemicals having log DOW values typical of the most mobile chemicals, having a log Dow below zero (see Figure 3a). Consequently, there is limited information available on the occurrence and fate of these mobile chemicals in the environment. Nevertheless, some examples of persistent and mobile chemicals have been identified. These include highly polar pesticides and their transformation products, for instance glyphosate and aminomethylphosphonic acid (AMPA), short-chain perfluorinated carboxylates and sulfonates, quaternary ammonium chemicals such as diquat and paraquat and complexing agents such as EDTA. There are, however, likely to be many more chemicals that could be classified as PMOC and we can therefore conclude that there is a gap in the knowledge and regulation of persistent mobile organic chemicals.
References
Arp, H.P.H., Brown, T.N., Berger, U., Hale, S.E. (2017). Ranking REACH registered neutral, ionizable and ionic organic chemicals based on their aquatic persistency and mobility. Environmental Science: Processes Impacts 19, 939-955.
Reemtsma, T., Berger, U., Arp, H. P. H., Gallard, H., Knepper, T. P., Neumann, M., Benito Quintana, J., de Voogt, P. (2016). Mind the gap: persistent and mobile organic chemicals - water contaminants that slip through. Environmental Science & Technology 50, 10308-10315.
Sjerps, R.M.A., Vughs, D., van Leerdam, J.A., ter Laak, T.L., van Wezel, A.P. (2016). Data-driven prioritization of chemicals for various water types using suspect screening LC-HRMS. Water Research 93, 254-264.
What is the reason that PMOCs may end up in drinking water despite the application of removal processes?
Explain why the average hydrophilicity of compounds present in drinking water is higher than that of surface waters or wastewater from which is has been produced.
2.2.6. Ionogenic organic chemicals
Authors: Steven Droge
Reviewer: John Parsons, Satoshi Endo
Leaning objectives:
You should be able to:
- understand that IOCs are abundantly present in many types of chemical classes, but all share common features such as dissociation of a proton from a polar moiety (acids to form anions) and association of a proton onto a polar moiety (bases to form cations).
- calculate the fraction of neutral/ionic species for each chemical at a given pKa and pH.
- make some rough predictions about pKa values from the IOC molecular structure.
Keywords: pKa, dissociation constant, speciation, drugs, surfactants, solubility
Introduction
Ionogenic organic chemicals (IOCs) are widely used in industry and daily life, but also abundantly present as chemicals of emerging concern. For environmental risk assessment purposes, IOCs may be defined as organic acids, bases, and zwitterionic chemicals that under common environmental pH conditions exist for a large part as charged (ionic) species, with only modest fraction of neutral species. The environmentally relevant pH range could be argued to lie between 4 (acidic creeks, even lower in polluted streams from volcanic regions or mine drainage systems) to 9 (sewage treatment effluents). The environmental behaviour of IOC pollutants of concern are different from neutral chemicals of concern, because the aqueous pH controls the neutral fraction of dissolved IOCs and the ionic form is highly soluble and interacts partly via electrostatic interactions with environmental susbtrates. Note that the major fraction of an IOC can also be neutral in a certain environmental system, and in that case it is often the neutral form that dominates the chemical's behavior.
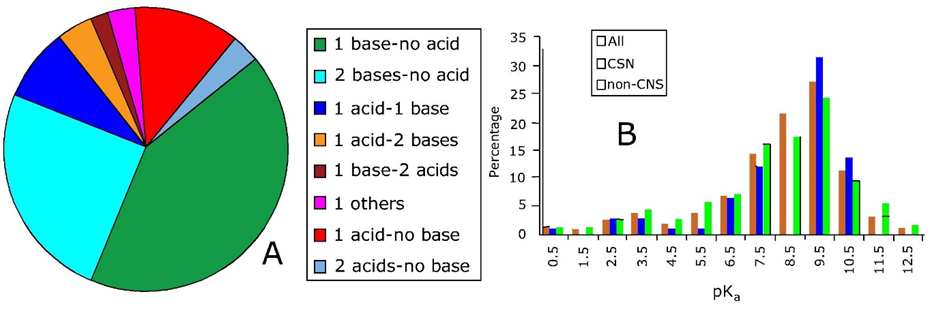
IOCs are common in many different types of pollutant classes. A random subset analysis of all EU (pre-)registered industrial chemicals indicated that large fractions of the total list of >100,000 chemicals are IOCs (51% neutral; 27% acids; 14% bases; 8% zwitterions/amphoterics). In another source, It has been estimated that >60% of all prescription drugs (Section 2.3.3) are IOCs (Manallack, 2007), and even higher fractions for illicit drugs (Section 2.3.4) (Figure 1). Well known examples are basic beta-blockers (e.g. propranolol), basic antidepressants (e.g. fluoxetine and sertraline), acidic non-steroidal anti-inflammatory drugs (NSAID such as diclofenac), and basic opioids (e.g. morphine, cocaine, heroin) and basic designer drugs (e.g. MDMA). The majority of surfactants and polyfluorinated chemicals (e.g. PFOS and GenX) are IOCs (Section 2.3.8), as well as wide variety of important pesticides (e.g. zwitterionic glyphosate) (Section 2.3.1) and (natural) toxins (Section 2.1) (e.g. peptide based multi-ionic cyanobacterial toxins).
Environmental behavior of IOCs
The release into the environment is specific for each of these types of IOCs with a different use, but in many cases happens via sewage treatment systems. If sorption to sewage sludge is very strong, application of sludge onto terrestrial (agricultural) systems is a key entry in many countries. However, many IOCs are rather hydrophilic and will mainly be present in wastewater effluent released into aquatic systems. As they are hydrophilic, they are considered rather mobile which allows for rapid transport through e.g. groundwater plumes, soil aquifers, and (drinking water) filtration steps. The distinction between (mostly) neutral chemicals and IOCs is important because the ionic molecular form generally behaves very differently from the corresponding neutral molecular form. For example, in many aspects ionic molecules are non-volatile compared to the corresponding neutral molecules, while neutral molecules are more hydrophobic than the corresponding ionic molecules. As a result of their lower "hydrophobicity", ionic molecules often bind with lower affinity to soils and are therefore more mobile in the environment. The ionic forms bioaccumulate to a lower extent and can therefore be less toxic than the corresponding neutral form (though not necessarily). However, there are various important exceptions for these rules. For example, clay minerals sorb cationic IOCs fairly strongly via ion exchange mechanisms. Certain proteins (e.g. the blood serum protein albumin) tightly bind anionic chemicals because of cationic subdomains on specific (enzymatic) pockets, which allows for effective transport throughout our systems and over cell membranes.
Calculating and predicting the dissociation constant (pK
The critical chemical parameter describing the ability to ionize is the acid dissociation constant (pKa). The pKa defines at which pH 50% of the IOC is in either the neutral or ionic form by releasing an H+ from the neutral molecule acids (AH to anion A-), or accepting an H+ onto the neutral molecule base (B to cation BH+). The equilibrium between neutral acid and dissociated form can thus be defined as:
[ HA ] ↔ [H+] + [A- ] (eq.1)
where the chemical's equilibrium speciation is defined as:
 (eq.2)
which gives the pKa as:
 (eq.3)
and as a function of pH, the ratio of the acid and anion is defined as:
 for acids and
  for bases (eq.4)
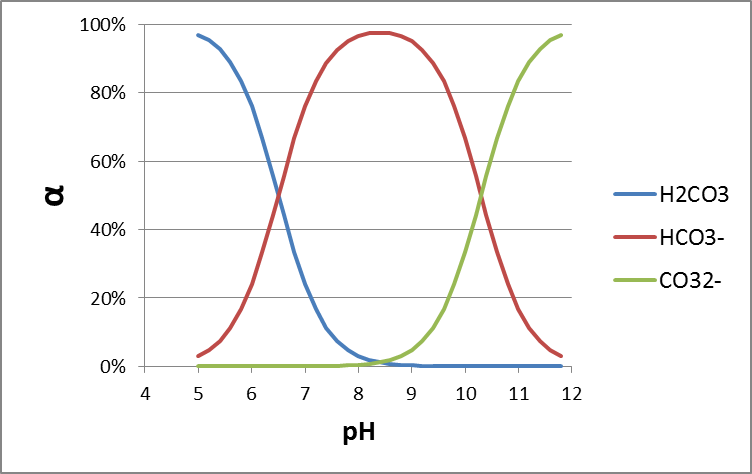
Although the term pKb is also used to denote the base association constant, it is conventional we consider [BH+] as acid and use 'pKa' and other relationships for bases as well. The fraction of neutral species (fN) for simple IOCs (one acidic or basic site) can be readily calculated with a derivatization of the Henderson-Hasselbalch equation:
 (eq.5)
in which α = 1 for bases, and -1 for acids.
in which α = 1 for bases, and -1 for acids. Using equation 5, Figure 2 presents a typical speciation profile for an acid (shown with pKa 5, so perhaps a carboxylic acid) and a base (shown with pKa 9, so perhaps a beta-blocker drug). Following the curve of equation 5, it is interesting to see some simple rules: if the pH is 1 unit lower than the pKa, the deprotonated species fraction is present at 10%. If the pH is 2 units lower than the pKa, the deminished species fraction is present at 1%, 3 units lower would give 0.1%, etc. From this, it is easy to make a good estimate for the protonation of a strong basic drug like MDMA (pKa reported 9.9-10.4) in blood (pH 7.4): with a maximum of 3 units lower pH, up to 99.9% of the MDMA will be in the protonated form, and only 0.1% neutral. For toxicological modeling studies, e.g. in terms of permeation through the blood-brain barrier membrane, this is highly relevant.

|
Boxes 1-3. Extended learning: calculating the dissociation constant for multiprotic chemicals: see end of this module |
Acidic IOCs:
For example, the painkiller (or non-steroidal anti-inflammatory drug, or NSAID) diclofenac is a carboxylic acid with a pKa of 4.1. This means that at pH 4.1, 50% of the dissolved diclofenac is in the dissociated (anionic) form (so, (1 - fN) from equation 5). At pH 5.1 (1 unit higher than the pKa) this is roughly 90% (90.91% to be more precise, but simply remembering 90% helps), at pH 6.1 (2 units higher than the pKa) this is 99%. This stepwise increase in 50-90-99% with each pH unit works for all acids, and for bases the other way round. Test for yourself that at physiological pH of 7.4 (e.g. in blood) diclofenac is calculated to be 99.95% anionic.
Many carboxylic acids have a pKa in the range of 4-5, but the neighboring molecular groups can affect the pKa. Particularly electronegative atoms such as chlorine, fluorine, or oxygen may lower the pKa, as they reduce the forces holding the dissociating proton to the oxygen atom. For example, trichloroacetic acid (CCl3-COOH) has a pKa of 0.77, while acetic acid (CH3-COOH) has a pKa of 4.75. For the same reason, perfluorinated carboxylic acids have a strongly reduced acidic pKa compared to the analogous non-perfluorinated carboxylic acids.
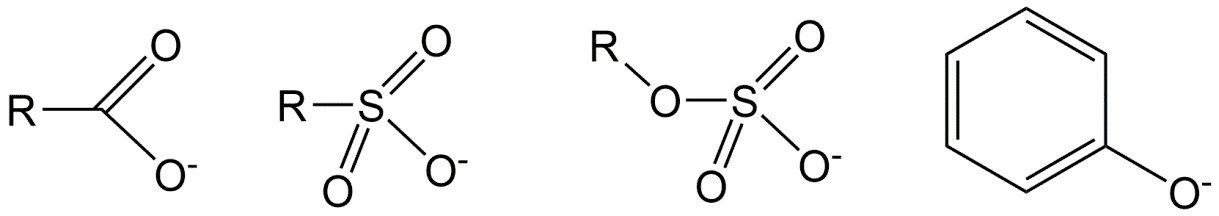
Sulfate acids (see figure 3) are very strong acids, with a pKa <0. These acids almost always occur in their pure form as a salt, for example the common soap ingredient sodium dodecylsulfate ("SDS" or "SLS", Na.C12H25-SO4). Other common detergents are sulfonates, such as linear alkylbenzenesulfonate ("LAS", C10-14-(benzyl-SO3)), where the SO3 anionic moiety is attached to a benzene ring, which can be positioned to different carbon atoms of a long alkyl chain. Even at the lower environmental pH range of about 4 these soap chemicals are fully in the anionic form. Such very strong acids, but also many weaker acids, are thus often sold in pure form as salts with sodium, potassium, or ammonium, which causes them to have different names and CAS numbers (e.g. Na.C12H25-SO4 or K.C12H25-SO4) than the neutral form.
Many phenols have a pKa > 8, and are therefore mostly neutral under environmental pH. Electron-withdrawing groups on the aromatic ring of the phenol group, such as Cl, Br and I, can lower the dissociation constant. For example, the dinitrophenol-based pesticide dinoseb has a pKa of 4.6, and is thus mostly anionic in the aquatic environment. Note that a hydroxyl group (-OH) not connected to an aromatic ring, such as -OH of alcohols, can in most cases for risk assessment be considered permanently neutral.
To help interpret the differences in pKa between molecules, it sometimes helps to remember that in more acidic solutions, there are simply higher H+ concentrations, in a logarithmic manner on the pH scale. At pH 3, the concentration H+ protons in solution is 1 mM, while at pH 9 the H+ concentration is 1 nM (6 pH units equals 106 times lower concentrations). The affinity ("Ka") of H+ to associate with a negatively charged molecular group, is so low for strong acids that even at very high dissolved H+ concentrations (low pH) only very few AH bonds (neutral acid fraction) are actually formed. In other words, for chemicals with a low Ka, even at low pH the neutral fraction is still low. For weak acids such as phenols, already at a very low dissolved H+ concentrations (high pH) many AH bonds (neutral acid fraction) are formed. So it can be reasoned that the affinity of common acidic groups to hold on to a proton is in the order:
SO4 < SO3 < CO2 < amide ( C(=O)NH ) < phenol < hydroxyl
Basic IOCs:
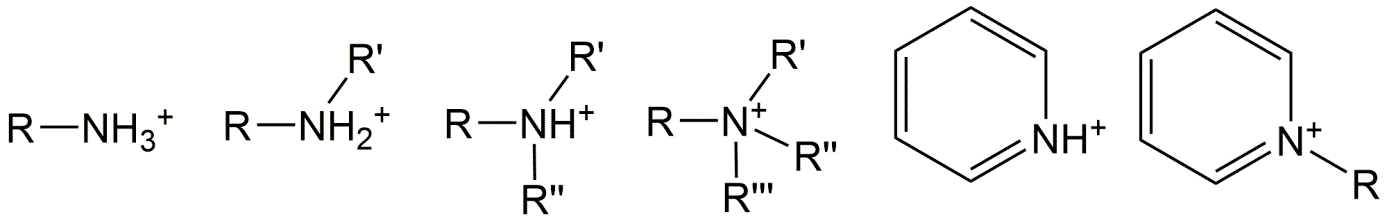
For bases, it is mostly a nitrogen atom that can accept a proton to form an organic cation, because of the lone electron pair in nitrogen. Neutral nitrogen atoms have opportunities for 3 bonds. A primary amine group has the nitrogen atom bonding to only 1 carbon atom (represented here as part of a molecular fragment R), and two additional bonds with hydrogen atoms. The remaining electron pair readily accepts another proton to form a cationic molecule [ R-NH3+ ]. Neutral secondary amines have one bond to hydrogen and two bonds to carbon atoms and can accept a proton to form [ R-NH2+-R' ], whereas neutral tertiary amines have no bonds to hydrogen but only to carbon atoms and can form [ R-NH+-(R')(R'') ]. Of course, each R group may be the same (e.g. a methyl unit).
Many basic chemicals have complex functionalities that can influence the pKa of the nitrogen moiety. However, as shown in the examples of figure 5, as long as there are at least two carbon atoms between the amine and the polar molecular fragment (for example OH, but much stronger for =O), the pKa of the basic nitrogen groups in all three types of bases (primary, secondary and tertiary amines) is high, often above 9 (dissolved H+ concentration <10-9). So even at very low H+ concentrations, dissolved protons like to be associated to such amine groups. As a result, amines such as most beta-blockers and amphetamine based drugs are predominantly positively charged molecules (organic cationic amines) in the common environmental pH range of 4-9, as well as in the pH of most biotic tissues that are useful for toxicological assessments. As soon as a polar group with oxygen (e.g. ketones or hydroxyl groups) is connected to the second carbon away from the nitrogen (e.g. R-CH(OH)-CH2-NH2) the pKa is considerably lowered. Also nitrogen atoms as part of an aromatic ring, or connected to an aromatic ring, have much lower pKa's: protons have rather low affinity to bind to these N-atoms and only start doing so if the proton concentration becomes relatively high (solution becomes more acidic).

Relevance of accounting for electrostatic interactions
Most classical pollutants, such as DDT, PCBs and dioxins, are neutral hydrophobic chemicals. On the other hand, most metals are almost always cationic species (e.g. Cd2+). Consequently, their environmental distribution and biological exposure are influenced by quite distinct processes. Obviously, predominantly charged IOCs behave somewhat in between these two extremes. The charged positive or negative groups cause a strong effect of electrostatic interactions between the IOC and environmental substrates (sorption or ligand/receptor binding). While also metals speciate into different forms, pH difference between environmental compartments can strongly influence the IOCs chemical fate and effect if ionizable group is relatively weak. An important difference to metals is that the nonionic molecular part still influences the IOC's hydrophobicity even in charged state for several processes.
As will be discussed in other chapters regarding chemical processes (see Chapter 3), it needs to be taken into account for IOCs that many environmental substrates (DOC, soil organic matter, clay minerals) are mostly negatively charged in the common range of environmental pH, but also that proteins involved in biotic uptake-distribution-effects are rich in ionogenic peptides that are part of binding pockets and reactive centers.
References
Manallack, D.T. (2007). The pKa distribution of drugs: application to drug discovery. Perspectives in Medical Chemistry 1, 25-38.
|
Box 1. Extended learning: calculating the dissociation constant for multiprotic chemicals: Several common inorganic acids are multiprotic: they have multiple protons that can dissociate. Multiples species can occur at a certain pH, such as for phosphoric acid (H3PO4, H2PO4-, HPO42- , HPO42-), and carbonic acid (H2CO3, HCO3-, CO32-). It is important to realize that there are actually two micro-species of HCO3-, because two hydroxylgroups can dissociate: HO-C(=O)-OH A polyprotc acid HnA can undergo n dissociations to form n+1 species. Each dissociation has a pKa. But how to calculate the fraction of each species of multiprotic chemicals? The charge of a polyprotic acid can be described as Hn-jAj-. A useful variable, v, can be defined for each general polyprotic acid:
for each dissociation reaction: Hn-j+1A-j+1 ↔ H+ + Hn-jAj- the dissociation constant Kj is:
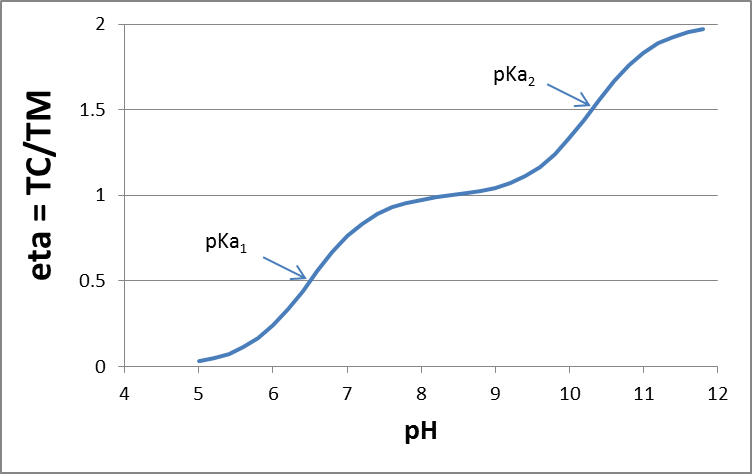
The degree of dissociation of the acid (η) is equal to the ratio of the total charge (TC) to the total mol acid (TM). For a diprotic acid, a plot of η as a function of pH provides the dissociation curve:
which can be a fitted curve to experimental data. The degree of protolysis for the jth species, αj, can be calculated from the ratio of [Hn-jAj-]/TM 
You can set up such a calculation in MS Excel, with calculations of α0, α1, α2, at a range of different pH values ([H+] concentrations), for a given K1 and K2, and plot the speciation against pH. More details are described by King et al. (1990) J. Chem. Educ. 67 (11), p. 932; DOI: 10.1021/ed067p932 |


|
Box 2. Example 1 for multiprotic chemicals: Carbonic acid Let's try carbonic acid (bicarbonate, or H2CO3) as an example first. H2CO3 is the product of carbon dioxide dissolved in water. In pure water/seawater the hydration equilibrium constant Kh = [H2CO3]/[CO2] ≈ 1.7×10⁻³ / ≈ 1.2×10⁻³ respectively, indicating that only 0.1% of dissolved CO2 equilibrates to H2CO3. The dissolved concentration of CO2 depends on atmospheric CO2 levels according to the air-water distribution coefficient (Henry constant kH = pCO2/[CO2]= 29.76 atm/(mol/L)). Because of the relevance of CO2 in e.g. ocean acidification, and gas exchange in our lungs, it is interesting to see how H2CO3 speciates depending on pH. As in the formula HnA, n= 2 for H2CO3.
With pK1*=6.5 (in equilibrium with atmospheric CO2) and pK2=10.33, K1=10-6.5 and K2=10-10.3. At pH 7, [H+]=10-7 , so at pH 7 with these dissociation constants
or from a series of Excel calculations at different pH:
you can copy/paste the following cells into cell A1 of a new Excel sheet, and extend the range of pH:
|


|
Box 3. Example 2 for multiprotic chemicals: Zwitterions Many organic pH buffers are zwitterionic chemicals, that contain both an acidic and a basic group. Norman Good and colleagues described a set of 20 of such buffers for biochemical and biological research (see for example www.interchim.fr/ft/0/062000.pdf, or www.applichem.com/fileadmin/Broschueren/BioBuffer.pdf). Examples are MES, MOPS, HEPPS (Figure A). These buffers are selected to:
the zwitterionic chemicals with sulfate groups are actually always have the sulfate group charged, making it highly soluble and impermeable to cell membranes, while the amine group protonates between pH6-10, depending on neighbouring functional groups. The speciation of the amine groups in MES and MOPS simply follows the single pKa calculation of equations 1-5. In HEPPS, either of the two amines is protonated, the second pKa is 3, so the doubly charged molecules only occurs at much lower pH, but can still be used as a buffer.  A zwitterionic chemical with two apparent pKa values relatively close is p-amino-benzoic acid. If chemicals have not one ionisable group, but N ionisable groups that speciation in a relevant pH range, than the amount of possible species is 2N. So the zwitterion p-amino benzoic acid has 4 species, each with a separate pKa (pH where both species are present in equal concentrations).
Let's formulate the benzyl group in p-amino benzoic acid as X, the neutral amine base as B, and the neutral carboxylic acid as AH, so that the fully neutral species is BXAH. Compared to the carboxylic acid, we now have under the most acidic conditions (BHXAH)+, as However, this does not inform us on the ratio between the zwitterionic form and the fully neutral form. To do this, the speciation constants of the 4 microspecies are required. [BH+XAH] ↔ [BXAH] + [H+] for which the pk1 is calculated to be 2.72 K1=10^-2,72 = [BXAH]*[H+]/ [BH+XAH] [BH+XAH]*10^-2.72 = [BXAH]*[H+] which rearranges to [BXAH]= 10^-2.72 *[BH+XAH] /[ H+] [BH+XAH] ↔ [BH+XA-] + [H+] for which the pk2 is calculated to be 3.93 K2=10^-3.93 = [BH+XA-]*[H+] / [BH+XAH] [BH+XAH]*10^-3.93 = [BH+XA-]*[H+] which rearranges to [BH+XA-] =10^-3.93*[BH+XAH]/[H+] [BXAH] ↔ [BXA-] + [H+] for which the pk3 is calculated to be 4.74 K3= 10^-4,74 = ([BXA-] * [H+]) / [BXAH] [BXAH]*10^-4,74 = [BXA-] * [H+]) [BH+XA-] ↔ [BXA-] + [H+] for which the pk4 is calculated to be 4.31 K4=10^-4,31 = [BXA-]*[H+] / [BH+XA-] [BH+XA-]*10^-4,31 = [BXA-]*[H+] So the ratio between zwitterionic form [BH+XA-] and neutral form [BXAH] equals to: [BH+XA-] / [BXAH] = 10^-pK2 / 10^-pK1 [BH+XA-] / [BXAH] = 10^-3.93 / 10^-2.72 = 0.06: so only 6% zwitterionic vs 94% neutral species. The macro pK1 and pK2 are then calculated as: K1 = ([BXAH] *[H+] + [BH+XA-]*[H+] )/ [BH+AXH] K1 = [BXAH] *[H+]/[BH+XAH] + [BH+XA-]*[H+] / [BH+XAH] K1 = 10^-pK1 + 10^- pK2 K1 = 10^-2.72 + 10^-3.93 =10^-2.69 K1=10^-2.69 K2 = ([BXA-]) *[H+] / ( [BH+XA-] + [BXAH] ) 1/K2 = [BH+XA-]/([BXA-]) *[H+] + [BXAH] /([BXA-]) *[H+] 1/K2 = 1/10^-pK3 + 1/10^-pK4 1/K2 = 1/10^-4,31 + 1/10^-4,74 = 1/10^-4.87 K2 =10^-4.87 |


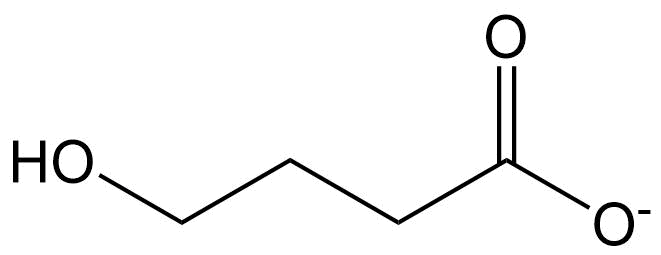
Calculcate the neutral fraction at pH7.4 for the illicit drug GHB (apply HH equation of eq 5):
Connect the chemicals to their appropriate pKa values:

Decide/look up whether these chemicals are predominantly neutral/anionic/cationic in the environment:

2.2.7. Complex mixtures/UVCBs
In preparation
2.2.8. Plastics
(draft)
Author: Ansje Löhr
Reviewer: John Parsons
Leaning objectives:
You should be able to:
- indicate the relevance of plastic for society
- describe the main characteristics of (micro)plastics
- describe the main ecological effects of (micro)plastics
Keywords: Plastic types, sources of plastics, primary and secondary microplastics, plastic degradation, effects of plastics
Introduction
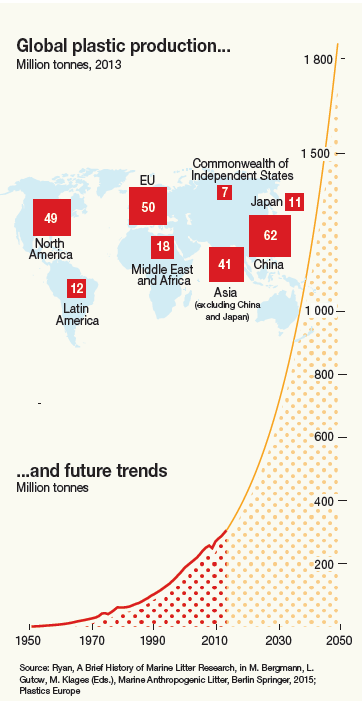
Since its introduction in the 1950s, the amount of plastics in the environment has increased dramatically (Figure 1). A recent study by Jambeck et al. (2015) estimated that 192 coastal countries generated 275 million metric tonnes of plastic waste in 2010 of which around 8 million tons of land-based plastic waste ends up in the ocean every year. By UN Environment plastic pollution is seen as one of the largest environmental threats. If waste management does not change rapidly, another 33 billion tonnes of plastic will have accumulated around the planet by 2050. (Micro)plastics is widely recognized as a serious problem in the ocean, however, plastic pollution is also seen in terrestrial and freshwater systems.
Classification by size and morphology
Plastics are commonly divided into macroplastics and microplastics; the latter plastic particles are <5 mm in diameter (including nanoplastics). There are several ways to classify microplastics but the following two types are often used; primary microplastics and secondary microplastics. Primary microplastics have been made intentionally, like pellets or microbeads, secondary microplastics are fragmented parts of larger objects. Microplastics show a large variety in characteristics such as size, composition, weight, shape and color. These characteristics have an influence on the behaviour in the environment, like for instance, the dispersion in water and the uptake by organisms (Figure 2). Low-density particles float on water and are therefore more prone to advection than particles with a
higher density. Similarly, spheres are more likely to be taken up by organisms than fibers. The characteristics also affect the absorption of contaminants, adsorption of microbes, and potential toxicity.

Classification by chemistry
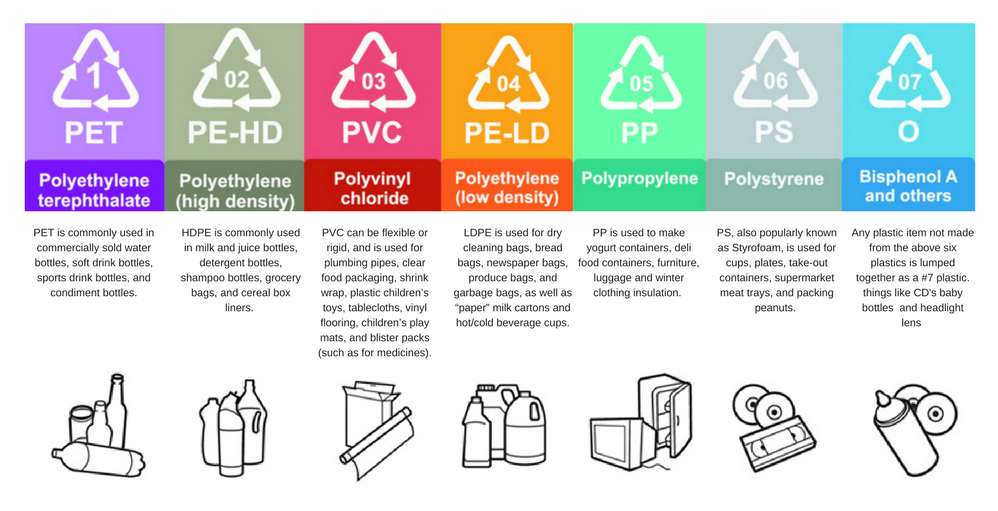
Plastic is the term used to define a sub-category of the larger class of materials called polymers, usually synthesized from fossil fuels, although biomass and plastic waste can also be used as feedstock. Polymers are very large molecules that have characteristically long chain-like molecular architecture. There are many different types of plastics but the market is dominated by 6 classes of polymers: polyethylene (PE, high and low density), polypropylene (PP), polyvinyl chloride (PVC), polystyrene (PS, including expanded EPS), polyurethane (PUR) and polyethylene terephthalate (PET) (figure 3). In order to make materials flexible, transparent, durable, less flammable and long-lived, additives to polymers are used such as flame retardants (e.g. polybrominated diphenyl ethers), and plasticisers (e.g. phthalates). Some of these substances are known to be toxic to marine organisms and to humans.
Biopolymers/ bioplastics
There is a lot of discussion on bioplastics as degradable plastics that these may still persist for a long time under marine conditions. Please watch this video by dr. Peter Kershaw.
Plastic degradation
Degradation of plastics takes place as soon as the plastic loses its original integrity and properties. There is a faster breaking up phase (degradation into microparticles) and a much slower mineralization phase (polymer chains being degraded to carbon dioxide). The degradation rate of plastics is determined by its polymer type, additive composition and environmental factors. Many commonly-used polymers are extremely resistant to biodegradation. Although plastics degrade in natural environments it is argued that no polymer can be efficiently biodegraded in a landfill site. Plastics in aquatic environments can be subject to in-situ degradation, e.g. by photodegradation or mechanical fragmentation but are in general very durable. As a result, plastics that are present in our oceans will degrade at a very slow pace, (Figure 4). So the majority of plastics produced today will persist in the environment for decades and probably for centuries, if not millennia.

Plastics in the environment
- Sources and pathways:
Plastics are found in terrestrial, freshwater, estuarine, coastal and marine environments, and even in very remote areas of the world and the deep-sea. Sources and pathways of marine litter are diverse and exact quantities and routes are not fully known. But there is a surge in interest to determine the exact quantities and types of plastic litter and pathways in the environment and most of the plastic in our oceans originates from land-based sources (Figure 5) but also from sea-based sources. Most PE and PP is used in (single-use) packaging products that have a short lifetime and end up soon as waste.

Primary microplastics in terrestrial environments mostly originate from the use of sewage sludge containing microplastics from personal care or household products. In agricultural soils the application of sewage sludge from municipal wastewater treatment plants to farmland is probably a major input, based on recent MP emission estimates in industrialized countries. Plastic pollution in terrestrial systems is also linked to the use of agricultural plastics, such as polytunnels and plastic mulches. Secondary microplastics originate from varying and diverse sources, for example from mismanaged waste either accidentally or intentionally.
- Effects:
As plastics have become widespread and ubiquitous in the environment, they are present in a diversity of habitats and can impact organisms at different levels of biological organization, possibly leading to population, community and ecosystem effects. Entanglement is one of the most obvious and dramatic physical impacts of macroplastics, as it often leads to acute and chronic injury or death. In particular the higher taxa (mammals, reptiles, birds and fish) are affected, and it may be critical for the success of several endangered species. Because of similar size characteristics to food, plastics are both intentionally and unintentionally ingested by a wide range of species, such as invertebrates, fish, birds and mammals. Ingestion of the non-nutritional plastics can cause damage and/or obstruction of the digestive tract and may lead to decreased foraging due to false feelings of satiation, resulting in reduced energy reserves.
Microplastics and in particular nanoparticles that are small enough to be taken up and translocated into tissues, cells and body fluids can cause cellular toxicity and pathological changes due to particle toxicity. In addition, there are also chemical risks involved as plastics can be a source of hazardous chemicals. These chemicals can be part of the plastic itself (i.e. monomers and additives) and/or chemicals that are absorbed from the environment into the matrix or such as lead, cadmium, mercury, persistent organic pollutants (POPs) like PAHs, PCBs and dioxins. However, as this process depends on the fugacity gradients, there is a lot of uncertainty about the extent that transfer of pollutants does occur in the environment. Actually, when taking all exposure pathways into account, the transfer from (micro)plastics seems to be a minor pathway.
Watch the video on the research of Inneke Hantoro.
Finally, marine plastics may act as floating habitats for invasive species, including harmful algal blooms and pathogens, leading to spreading beyond their natural dispersal range and creating the risk of disrupting ecosystems of sensitive habitats.
2.2.9. Nanomaterials
Author: Martina Vijver
Reviewers: Kees van Gestel, Frank van Belleghem, Melanie Kah
Leaning objectives:
You should be able to:
- explain the differences between nanomaterials and soluble chemicals.
- describe nano-specific features and explain the difference between nanomaterials and particles with a larger size, as well as how they differ from molecules.
Keywords: Nanomaterials , emerging technologies, colloids, nanoscale, surface reactivity
Introduction
Engineering at the nanoscale (i.e. 10-9 m) brings the promise of radical technological development. Due to their unique properties, engineered nanomaterials (ENMs) have gained interest from industry and entered the global market. Potentials ascribed to nanotechnology are amongst all: stronger materials, more efficient carriers of energy, cleaner and more compact materials that allow for small yet complex products. Currently, nanomaterials are used in numerous products, although exact numbers are lacking. In 2014, the market was estimated to contain more than 13,000 nano-based products (Garner and Keller, 2014). There is a wide variety of products containing nanomaterials, ranging from sunscreens and paint, to textiles, medicines, electronics covering many sectors (Figure 1).

Nanomaterials:
The European Commission in 2011 adopted a new definition of 'nanomaterial' reading 'a natural, incidental or manufactured material containing particles, in an unbound state or as an agglomerate or as an aggregate and where, for 50 % or more of the particles in the number size distribution, one or more external dimensions is in the size range 1 nm-100 nm'.
Nanomaterials occur naturally, think of minuscule small fine dust, colloids in the water column, volcanic ash, carbon black and colloids known as ocean spray. In paints the features of the colloids are used to obtain the pigment colors. From the year 2000 on, an exponential growth was seen in their synthesis due to the advanced technologies and imaging techniques needed to work on a nano-scale. First generation nanotechnologies (before 2005) generally refers to nanotechnology already on the market, either as individual nanomaterials, or as nanoparticles incorporated into other materials, such as films or composites. Surface engineering has opened the doors to the development of second and third generation ENMs. Second generation nanotechnologies (2005-2010) are characterised by nanoscale elements that serve as the functional structure, such as electronics featuring individual nanowires. From 2010 onward there has been more research and development of third generation nanotechnologies, which are characterised by their multi-scale architecture (i.e. involving macro-, meso-, micro- and nano-scales together) and three-dimensionality, for applications like biosensors or drug-delivery technologies modelled on biological templates. Self-assembling bottom-up techniques have been widely developed at industrial scale, to create, manipulate and integrate nanophases into more complex nanomaterials with new or improved technological features. Post 2015, the fourth generation ENMs are anticipated to utilise 'molecular manufacturing': achieving multi-functionality and control of function at a molecular level. Nowadays, virtually any material can be made on the nanoscale.

Size does matter
Nanoscale materials have far larger surface areas than larger objects with similar masses. A simple thought experiment shows why nanoparticles have phenomenally high surface areas.
A solid cube of a material 1 cm on a side has 6 cm2 of surface area, about equal to one side of half a stick of gum. When the 1 cm3 is filled with micrometer-sized cubes - a trillion (1012) of them, each with a surface area of 6 square micrometers - the total surface area amounts to 6 m2.. As surface area per mass of a material increases, a greater proportion of the material comes into contact with surrounding materials (Figure 2). Small particles also give that there is a high proportion of surface atoms, high surface energy, spatial confinement and reduced imperfections (Figure 2). It results in the fact that ENMs are having an enlarged reactivity. compared to larger "bulk" materials. For instance, ENMs have the potency to transfer concentrated medication across the cell membranes of targeted tissues. By engineering nanomaterials, these properties can be harnessed to make valuable new products or processes.
ENMs are often designed to accomplish a particular purpose, taking advantage of the fact that materials at the nanoscale have different properties than their larger-scale counterparts.
ENMs and environmental processes
ENMs are described as a population of particles, and quantified by the particle size distribution (PSD). Nonetheless often a single value (e.g. average ± standard deviation) is reported and not the full PSD. When the particles are suspended in an exposure medium, the size distribution of the NPs is changing over time. After being emitted into aquatic environments, NPs are subject to a series of environmental processes. These processes include dissolution and aggregation (see Figure 3) and subsequent sedimentation. It is known that the behavior and fate of NPs are highly dependent on the water chemistry. In particular, environmental parameters like pH, concentration and type of salts (especially divalent cations) and natural organic matter (NOM) can strongly influence the behaviour of NPs in the environment. For example, pH can affect the aggregation and dissolution of metallic NPs by influencing the surface potential of the NPs (von der Kammer et al., 2010). The divalent cations Ca2+ and Mg2+ are able to efficiently compress the electrical double-layer of NPs and consequently enhance homo-aggregation and hetero-aggregation of NP (see Figure 2) and the cations will be related to bridging the electrostatic interactions. In surface water, aggregation processes most often lead to sedimentation and sometimes to floating aggregates (depending on the density).
Coating of ENMs will change the dynamics of these processes. As a result of these nano-specific features, ENMs form a suspension which is different from chemicals that dissolve and form a solution. These ENMs in suspension then follow different environmental fate and behaviour compared to solutions. For this reason the way the dosage of ENPs should be expressed is highly debated within the nano-safety community. Should this be on a mass basis, as is the case for molecules of conventional chemicals (e.g. mg/L), or is the particle number the preferred dose metric such as in colloidal science (e.g. number of particles/L, or relative surface-volume ratio) or multi-mixed dosimetry expression. How to express the dose for nanomaterials is a quest still debated within the scientific community (Verschoor et al., 2019).

Classification of NMs
Although we learned from the text above that changing the form of a nanomaterial can produce a material with new properties (i.e. a new nanomaterial); often a group of materials developed is named after the main chemical component of the ENMs (e.g. nanoTiO2) that is available in different (nano)forms. Approaches to group ENMs have been presented below:
- Classification by dimensionality / shape / morphology:
Shape-based classification is related to defining nanomaterials, and has been synopsized in the ISO terminology.
- Classification by composition / chemistry:
This approach groups nanomaterials based on their chemical properties.
- Classification by complexity / functionality:
The nanomaterials that are in routine use in products currently are likely to be displaced by nanomaterials designed to have multiple functionalities, so called 2nd-4th generation nano-materials.
- Classification by biointerface:
A proposal relates to the hypothesis that nanomaterials acquire a biological identity upon contact with biofluids and living entities. Systems biology approaches will help identify the key impacts and nanoparticle interaction networks.
References
Garner, K.L., Keller, A.A. (2014). Emerging patterns for engineered nanomaterials in the environment: a review of fate and toxicity studies. Journal of Nanoparticle Research 16: 2503.
Nowack, B., Bucheli, T.D. (2007). Occurrence, behavior and effects of nanoparticles in the environment. Environmental Pollution 150, 5-22.
Verschoor, A.J., Harper, S., Delmaar, C.J.E., Park, M.V.D.Z., Sips, A.J.A.M., Vijver, M.G., Peijnenburg, W.J.G.M. (2019). Systematic selection of a dose metric for metal-based nanoparticles. NanoImpact 13, 70-75.
Von der Kammer, F., Ottofuelling, S., Hofmann, T. (2010). Assessment of the physico-chemical behavior of titanium dioxide nanoparticles in aquatic environments using multi-dimensional parameter testing. Environmental Pollution 158, 3472-3481.
What gave us (as mankind) the capacity to virtually synthesize every material at the nanoscale?
Explain the statement 'size does matter' for reactivity, use within your explanation the relationship between particle size and the surface area.
Give an example of a nano-specific property - which is not size - that enhances reactivity of a material.