Basic Aspects of Drug Activity
- Page ID
- 89054
\( \newcommand{\vecs}[1]{\overset { \scriptstyle \rightharpoonup} {\mathbf{#1}} } \)
\( \newcommand{\vecd}[1]{\overset{-\!-\!\rightharpoonup}{\vphantom{a}\smash {#1}}} \)
\( \newcommand{\dsum}{\displaystyle\sum\limits} \)
\( \newcommand{\dint}{\displaystyle\int\limits} \)
\( \newcommand{\dlim}{\displaystyle\lim\limits} \)
\( \newcommand{\id}{\mathrm{id}}\) \( \newcommand{\Span}{\mathrm{span}}\)
( \newcommand{\kernel}{\mathrm{null}\,}\) \( \newcommand{\range}{\mathrm{range}\,}\)
\( \newcommand{\RealPart}{\mathrm{Re}}\) \( \newcommand{\ImaginaryPart}{\mathrm{Im}}\)
\( \newcommand{\Argument}{\mathrm{Arg}}\) \( \newcommand{\norm}[1]{\| #1 \|}\)
\( \newcommand{\inner}[2]{\langle #1, #2 \rangle}\)
\( \newcommand{\Span}{\mathrm{span}}\)
\( \newcommand{\id}{\mathrm{id}}\)
\( \newcommand{\Span}{\mathrm{span}}\)
\( \newcommand{\kernel}{\mathrm{null}\,}\)
\( \newcommand{\range}{\mathrm{range}\,}\)
\( \newcommand{\RealPart}{\mathrm{Re}}\)
\( \newcommand{\ImaginaryPart}{\mathrm{Im}}\)
\( \newcommand{\Argument}{\mathrm{Arg}}\)
\( \newcommand{\norm}[1]{\| #1 \|}\)
\( \newcommand{\inner}[2]{\langle #1, #2 \rangle}\)
\( \newcommand{\Span}{\mathrm{span}}\) \( \newcommand{\AA}{\unicode[.8,0]{x212B}}\)
\( \newcommand{\vectorA}[1]{\vec{#1}} % arrow\)
\( \newcommand{\vectorAt}[1]{\vec{\text{#1}}} % arrow\)
\( \newcommand{\vectorB}[1]{\overset { \scriptstyle \rightharpoonup} {\mathbf{#1}} } \)
\( \newcommand{\vectorC}[1]{\textbf{#1}} \)
\( \newcommand{\vectorD}[1]{\overrightarrow{#1}} \)
\( \newcommand{\vectorDt}[1]{\overrightarrow{\text{#1}}} \)
\( \newcommand{\vectE}[1]{\overset{-\!-\!\rightharpoonup}{\vphantom{a}\smash{\mathbf {#1}}}} \)
\( \newcommand{\vecs}[1]{\overset { \scriptstyle \rightharpoonup} {\mathbf{#1}} } \)
\(\newcommand{\longvect}{\overrightarrow}\)
\( \newcommand{\vecd}[1]{\overset{-\!-\!\rightharpoonup}{\vphantom{a}\smash {#1}}} \)
\(\newcommand{\avec}{\mathbf a}\) \(\newcommand{\bvec}{\mathbf b}\) \(\newcommand{\cvec}{\mathbf c}\) \(\newcommand{\dvec}{\mathbf d}\) \(\newcommand{\dtil}{\widetilde{\mathbf d}}\) \(\newcommand{\evec}{\mathbf e}\) \(\newcommand{\fvec}{\mathbf f}\) \(\newcommand{\nvec}{\mathbf n}\) \(\newcommand{\pvec}{\mathbf p}\) \(\newcommand{\qvec}{\mathbf q}\) \(\newcommand{\svec}{\mathbf s}\) \(\newcommand{\tvec}{\mathbf t}\) \(\newcommand{\uvec}{\mathbf u}\) \(\newcommand{\vvec}{\mathbf v}\) \(\newcommand{\wvec}{\mathbf w}\) \(\newcommand{\xvec}{\mathbf x}\) \(\newcommand{\yvec}{\mathbf y}\) \(\newcommand{\zvec}{\mathbf z}\) \(\newcommand{\rvec}{\mathbf r}\) \(\newcommand{\mvec}{\mathbf m}\) \(\newcommand{\zerovec}{\mathbf 0}\) \(\newcommand{\onevec}{\mathbf 1}\) \(\newcommand{\real}{\mathbb R}\) \(\newcommand{\twovec}[2]{\left[\begin{array}{r}#1 \\ #2 \end{array}\right]}\) \(\newcommand{\ctwovec}[2]{\left[\begin{array}{c}#1 \\ #2 \end{array}\right]}\) \(\newcommand{\threevec}[3]{\left[\begin{array}{r}#1 \\ #2 \\ #3 \end{array}\right]}\) \(\newcommand{\cthreevec}[3]{\left[\begin{array}{c}#1 \\ #2 \\ #3 \end{array}\right]}\) \(\newcommand{\fourvec}[4]{\left[\begin{array}{r}#1 \\ #2 \\ #3 \\ #4 \end{array}\right]}\) \(\newcommand{\cfourvec}[4]{\left[\begin{array}{c}#1 \\ #2 \\ #3 \\ #4 \end{array}\right]}\) \(\newcommand{\fivevec}[5]{\left[\begin{array}{r}#1 \\ #2 \\ #3 \\ #4 \\ #5 \\ \end{array}\right]}\) \(\newcommand{\cfivevec}[5]{\left[\begin{array}{c}#1 \\ #2 \\ #3 \\ #4 \\ #5 \\ \end{array}\right]}\) \(\newcommand{\mattwo}[4]{\left[\begin{array}{rr}#1 \amp #2 \\ #3 \amp #4 \\ \end{array}\right]}\) \(\newcommand{\laspan}[1]{\text{Span}\{#1\}}\) \(\newcommand{\bcal}{\cal B}\) \(\newcommand{\ccal}{\cal C}\) \(\newcommand{\scal}{\cal S}\) \(\newcommand{\wcal}{\cal W}\) \(\newcommand{\ecal}{\cal E}\) \(\newcommand{\coords}[2]{\left\{#1\right\}_{#2}}\) \(\newcommand{\gray}[1]{\color{gray}{#1}}\) \(\newcommand{\lgray}[1]{\color{lightgray}{#1}}\) \(\newcommand{\rank}{\operatorname{rank}}\) \(\newcommand{\row}{\text{Row}}\) \(\newcommand{\col}{\text{Col}}\) \(\renewcommand{\row}{\text{Row}}\) \(\newcommand{\nul}{\text{Nul}}\) \(\newcommand{\var}{\text{Var}}\) \(\newcommand{\corr}{\text{corr}}\) \(\newcommand{\len}[1]{\left|#1\right|}\) \(\newcommand{\bbar}{\overline{\bvec}}\) \(\newcommand{\bhat}{\widehat{\bvec}}\) \(\newcommand{\bperp}{\bvec^\perp}\) \(\newcommand{\xhat}{\widehat{\xvec}}\) \(\newcommand{\vhat}{\widehat{\vvec}}\) \(\newcommand{\uhat}{\widehat{\uvec}}\) \(\newcommand{\what}{\widehat{\wvec}}\) \(\newcommand{\Sighat}{\widehat{\Sigma}}\) \(\newcommand{\lt}{<}\) \(\newcommand{\gt}{>}\) \(\newcommand{\amp}{&}\) \(\definecolor{fillinmathshade}{gray}{0.9}\)A. Pharmacodynamics: interaction of drugs with their sites of action
While there are several types of exceptions, the effects of most drugs result from their interaction with functional macromolecular components of the organism. Such interaction alters the function of the pertinent cellular component and thereby initiates the series of biochemical and physiological changes that are characteristic of the response to the drug. The term receptor is used to denote the component of the organism with which the chemical agent interacts. By virtue of interactions with such receptors, drugs do not create effects but merely modulate ongoing function. Thus, drugs cannot impart a new function to a cell.
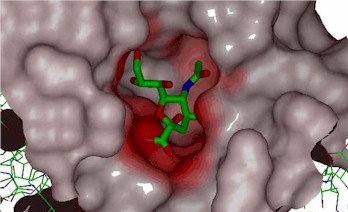
Figure. - hypothetical drug in receptor site.
Structure-Activity
The affinity of a drug for a specific macromolecular component of the cell and its intrinsic activity are intimately related to its chemical structure. The relationship is frequently quite stringent, and relatively minor modifications in the drug molecule, particularly such subtle changes as stereochemistry, may result in major changes in pharmacological properties. Exploitation of structure-activity relationships has on many occasions led to the synthesis of valuable therapeutic agents. Since changes in molecular configuration need to alter all actions and effects of a drug equally, it is sometimes possible to develop a congener with a more favorable ratio of therapeutic to toxic effects, enhanced selectivity among different cells or tissues, or more acceptable secondary characteristics than those of the parent drug. In addition, effective therapeutic agents have been fashioned by developing structurally related competitive antagonists of other drugs or of endogenous substances known to be important in biochemical or physiological function. Minor modifications of structure can also have profound effects on the pharmacokinetic properties of drugs.
Stereochemistry
Enantemerism can be produced by sp3 hybridized carbon atoms. Because free rotation about the chiral carbon is not possible, two stable forms of the molecule can exist. A molecule with two nonidentical asymmetric centers can exist as (22 = 4) four stereo isomers. Interaction with biological receptors can differ greatly between two enantomers, even to the point of no binding. There are numerous examples among drug molecules where only one isomer exhibits the desired pharmacology. Some isomers may even cause side effects or entirely different effects than its mirror image.

Ephedrine has two chiral centers and four isomers:
Different isomers can be used in different cases depending on the desired effect. Clinically, D(-) ephedrine is used to a large extent as an anti-asthmatic and, formerly, as a presser amine to restore low blood pressure as a result of trauma. L(+) pseudo-ephedrine is used primarily as a nasal decongestant.
| Isomer | Relative activity |
|---|---|
| D(-) Pseudoephedrine | 1 |
| L(+) Pseudoephedrine | 7 |
| L(+) Ephedrine | 11 |
| D(-) Ephedrine | 36 |
If the biological receptor has at least three binding sites, the receptor easily can differentiate enantomers (see figures below). The R(-)isomer has three points of interaction and is held in the conformation shown to maximize binding energy, whereas, the S(+)isomer can have only two sites of interaction.
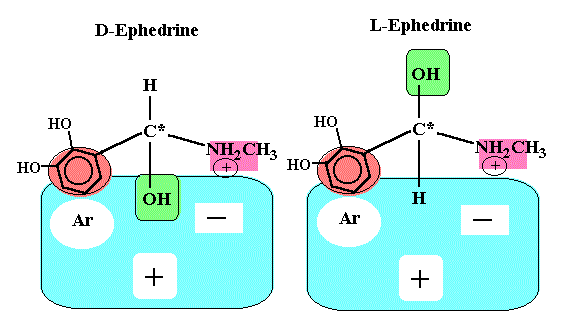
It should be noted that the structure of alpha and beta adrenergic receptors are not entirely known. Also we should not forget that there is also enantioselectivity with respect to pharmacokinetics, such as, absorption, distribution, metabolism, and excretion.
Drug-Receptor Interactions
Cell signaling is the method in which cells communicate between each other in order to coordinate their activities and react to changes in their environments. Cell signaling involves a signal molecule (an agonist) and a specific signal receptor. Agonistic drugs are those which mimick natural signaling molecules and couse similar effects, while antagonists compete or inhibit agonists and hamper their effects.
Agonist Drugs. Agonist drugs mimic cell signaling molecules by activating the same receptor sites and causing similar effects. Both are described quantitatively by the same methods. If one assumes that an agonist drug interacts reversibly with its receptor and that the resultant effect is proportional to the number of receptors occupied, the following reaction can be written:
\[ \text{Drug (D)} + \text{Receptor (R)} \ce{ <=>[k_1][k_2]} DR \rightarrow \text{Effect}\]
This reaction sequence is analogous to the interaction of substrate with enzyme, and the magnitude of effect can be analyzed in a manner similar to that for enzymatic product formation. The application equation is identical in form with the Michaelis-Menten equation:
\[ \text{Effect} = \dfrac{(\text{Maximal Effect}) [D]}{K_d+[D]} \label{2}\]
where[D] is the concentration of free drug and KD (equal to K2 / K1) is the dissociation constant for the drug-receptor complex. This equation describes a simple rectangular hyperbola . There is no effect at [D] = 0; the effect is half-maximal when [D] = KD, that is when half of the receptors are occupied; the maximal effect is approached asymptotically as [D] increases above KD (Figure A below). Therefore, doubling the dose does not double the drug effect, but creates a less than two-fold consequence. It is frequently convenient to plot the magnitude of effect versus log [D], since a wide range of drug concentrations is easily displayed and a portion of the curve is more linear. In this case, the result is the familiar sigmoidal log dose-effect curve (Figure B below).
Equation \ref{2} can be rearranged by taking the reciprocal of both sides. The graph of the resulting equation is called the Lineweaver-Burk plot:
\[ \dfrac{1}{\text{Effect}} = \dfrac{K_D}{(\text{Max Effect} [D])} + \dfrac{1}{\text{Max Effect}} \label{3}\]
A plot of 1/Effect versus 1/[D] yields a straight line that intersects the Y-axis at 1/(Max. Effect) and that has a slope equal to KD/(Max. Effect). Extrapolation of this line to the X-axis yields the value of -1/KD (Figure C below). Thus, values of \(K_D\) and Max. Effect can be readily calculated from such a plot. This representation is especially useful for analyzing drug antagonism.
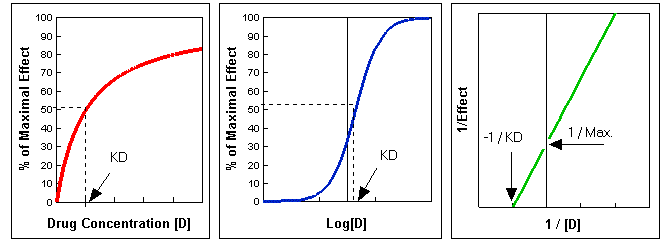
Figures A, B, and C. These were produced using Lotus 123r5. To download the spreadsheet, click here.
Antagonists. Certain drugs, called antagonists, interact with receptor sites to inhibit the actions of an agonists, while initiating no effect themselves. In this type of interaction, called competitive inhibition, the 1/Effect intercept of the plot of 1/[D] versus 1/[S] (Figure C) is the same in the presence and absence of an inhibitor, although the slope is different. This reflects the fact that the Max. Effect is not altered by a competitive inhibitor. The identification of competitive inhibition is that it can be overcome by a sufficiently high concentration of substrate.
A noncompetitive antagonist prevents the agonist from producing any effect at a given receptor site. This could result from irreversible interaction of the antagonist at any site to prevent binding of agonist. It could also follow reversible interaction with any component of the system so as to decrease the effect binding of agonist. These results may be conceptualized as removal of receptor from the system. The Max. Effect is reduced but the agonist's ability to still act normally at the receptor site is unaltered. The affinity of the agonist for the receptor and its potency are thus unaltered. On a Lineweaver-Burk plot (Fig. C), the intercept on the 1/Effect axis is increased and the new slope, is steeper. In contrast with the Max. Effect, KD is not affected by this kind of inhibition and so the x-intercept is unaltered. Noncompetitive inhibition cannot be overcome by increasing the agonist concentration.
Antagonists may thus be classified as acting reversibly or irreversibly. If the antagonist binds at the active site for the agonist, reversible antagonists will be competitive and irreversible antagonists will be noncompetitive. If binding is elsewhere, however, these simple rules do not hold, and any combination is possible.
Down load the spreadsheet used to make Figures A, B, and C and change KD and Max Effect to see the resulting changes in the graphs. (This spreadsheet can be also used in Microsoft Excel).
Interactions Between Drugs
There are two primary factors contributing to drug interactions. First, many drugs are bound to plasma proteins and this binding serves as a reservoir of inactive drugs. If a second drug displaces a drug already bound to the protein (by competing for the same protein), more of the previously bound drug will be able to pass out of the bloodstream and be available to the receptor and thus a more intense effect may be produced: the displacing drug would increase the effects or the toxicity of the displaced drug.
Second, a drug that is metabolized by the liver may induce new enzymes, which can then metabolize any of a variety of new drugs. Thus, an enzyme-inducing drug such as pentobarbital will decrease the activity of other drugs metabolized by the liver by increasing their rates of metabolism. Therefore, a wide variety of factors influence a drug's action in the body, making the use of more than one drug at a time risky, whether they are used separately or mixed in a concoction.
B. Pharmacokinetics
Dynamics of drug absorption, distribution and elimination.
Pharmacokinetics deals with the absorption, distribution, biotransformation, and excretion of drugs. These factors, coupled with dosage, determine the concentration of a drug at its sites of action and, hence, the intensity of its effects as a function of time. Many basic principles of biochemistry and enzymology and the physical and chemical principles that govern the active and passive transfer and the distribution of substances across biological membranes are readily applied to the understanding of this important aspect of medicinal chemistry.
Drug Elimination
Drugs are eliminated from the body either unchanged or as metabolites. Excretory organs, the lung excluded, eliminate polar compounds more efficiently than substances with high lipid solubility. Lipid-soluble drugs are thus not readily eliminated until they are metabolized to more polar compounds.
The kidney is the most important organ for elimination of drugs and their metabolites. Substances excreted in the feces are mainly unabsorbed orally ingested drugs or metabolites excreted in the bile and not reabsorbed from the intestinal tract. Excretion of drugs in milk is important not because of the amounts eliminated but because the excreted drugs are potential sources of unwanted pharmacological effects in the nursing infant. Pulmonary excretion is important mainly for the elimination of anesthetic gases and vapors: occasionally, small quantities of other drugs of metabolites are excreted by this route.
Drug elimination follows first-order kinetics. To illustrate first order kinetics we might consider what would happen if we were instantly inject (with an IV) a person with a drug, collect blood samples at various times and measure the plasma concentrations Cp of the drug. We might see a steady decrease in concentration as the drug is eliminated, as shown in the figure below.
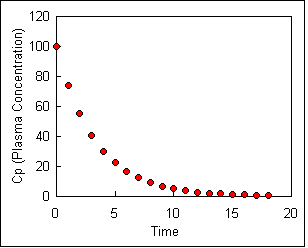
If we measure the slope of this curve at a number of times we are actually measuring the rate of change of concentration at each time point. This can be written mathematically as Equation \ref{4}:
\[\dfrac{dC_p}{dt} = - k_{el}C_p \label{4}\]
where \(k_{el}\) is an elimination constant.
Can you make a plot from this equation to calculate Kel? How can this equation be rearranged to determine Kel?
If we integrate, we find that the plasma concentration at a given time is Equation \ref{5}:
\[ C_p = C_P^o e^{-k_{el}t} \label{5}\]
where Cpo is the initial plasma concentration. In the process of deriving this equation we can calculate the half life to be Equation 6:
\[t_{1/2} = \dfrac{0.693}{k_{el}}\label{6}\]
| Drug | kel, hr-1 | t1/2, hr |
|---|---|---|
| Acetaminophen | 0.28 | 2.5 |
| Diazepam | 0.021 | 33 |
| Digoxin | 0.017 | 40 |
| Gentamicin | 0.35 | 2.1 |
| Lidocaine | 0.43 | 1.6 |
| Theophylline | 0.063 | 11 |
Metabolism and Excretion
So far we have considered elimination by excretion into urine only. Usually drugs are eliminated by excretion AND metabolism. Schematically this can be represented as:
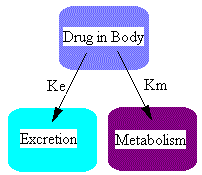
where ke is the excretion rate constant and km is the metabolism rate constant. Here we have two parallel pathways for elimination although there could be more pathways, ie. excretion by exhalation, in sweat, or as is commonly the case, more than one metabolite. The differential equations for the two components shown in this diagram could be written just as we did above.
Apparent Volume of Distribution, V
We can also use the equations above to calculate the plasma concentration at any time when we know kel and Cpo. However, usually we don't know Cpo ahead of time, but we do know the dose. To calculate Cpo we need to know the volume that the drug is distributed into. That is, the apparent volume of the mixing container, the body. This apparent volume of distribution is not a physiological volume. It won't be lower than blood or plasma volume but it can may be much larger than body volume for some drugs. It is a mathematical 'fudge' factor relating the amount of drug in the body and the concentration of drug in the measured compartment, usually plasma. This can be expressed as Equation 7:
![]() or
or ![]()
Immediately after an intravenous dose is administered, the amount of drug in the body is the dose. Thus we get equation 8:
![]() or
or ![]()
Some example values for apparent volume of distribution are listed in the table below.
| Drug | V (l/kg) | V (l, 70 kg) |
|---|---|---|
| Sulfisoxazole | 0.16 | 11.2 |
| Phenytoin | 0.63 | 44.1 |
| Phenobarbital | 0.55 | 38.5 |
| Diazepam | 2.4 | 168 |
| Digoxin | 7 | 490 |
The last figure, for digoxin, is much larger than body volume. The drug must be extensively distributed into tissue, leaving low concentrations in the plasma, thus the body as a whole appears to have a large volume, of distribution. Remember, this is not a physiological volume.
From Equations 8 and 5 we can produce Equation 9:
![]()
Here are some Example Calculations* to try.
Clearance, CL
Clearance is the most important concept to be considered when a rational regiment for drug administration is to be designed. The clinician usually wants to maintain steady- state concentrations of a drug within a known therapeutic range. Assuming complete bioavailability, the steady state will be achieved when the rate of drug elimination equals the rate of drug administration in equation 10:
Dosing rate = CL*Css
where CL is clearance and Css is the steady-state concentration of the drug.
Clearance can be defined as the volume of plasma which is completely cleared of drug per unit time. The symbol is CL and the units are ml/min, L/hr, i.e. volume per time. Another way of looking at Clearance is to consider the drug being eliminated from the body ONLY via the kidneys. (If we were to also assume that all of the drug that reaches the kidneys is removed from the plasma then we have a situation where the clearance of the drug is equal to the plasma flow rate to the kidneys. All of the plasma reaching the kidneys would be cleared of drug.)
The amount cleared by the body per unit time is dU/dt, the rate of elimination (also the rate of excretion in this example). To calculate the volume which contains that amount we can divide by Cp. That is the volume = amount/concentration. Thus equation 11:
![]()
![]()
equation12 is
![]()
As we have defined the term here it is the total body clearance. We have considered that the drug is cleared totally by excretion in urine. Below we will see that the total body clearance can be divided into a clearance due to renal excretion and that due to metabolism.
Clearance is a useful term when talking of drug elimination since it can be related to the efficiency of the organs of elimination and blood flow to the organ of elimination. It is useful in investigating mechanisms of elimination and renal or hepatic function in cases of reduced clearance of test substances. Also the units of clearance, volume/time (e.g. ml/min) are easier to visualize, compared with elimination rate constant (units 1/time, e.g. 1/hr).
Total body clearance, CL, can be separated into clearance due to renal elimination, CLr and clearance due to metabolism, CLm.
CLr = ke * V (renal clearance) and CLm = km * V (metabolic clearance)
where these are combined to give equation 13:
CL = CLr + CLm
Equation 11 can be rearranged to get:
![]()
thus a plot of dU/dt versus Cp will give a straight line through the origin with a slope equal to the clearance, CL.
Pharmacokinetics of Oral Administration
Most commonly the absorption process of oral administration follows first order kinetics. Even though many oral dosage forms are solids which must dissolve before being absorbed the overall absorption process can often be considered to be a single first order process. At least that's the assumption we will use for now.
Schematically this model can be represented as:

Where Xg is the amount of drug to be absorbed, Xp is the amount of drug in the body, and ka is the first order absorption rate constant.
Differential Equation
The differential equation for Xg is Equation 14:
![]()
This is similar to the equation for ![]() after an IV injection.
after an IV injection.
Integrating this we get Equation 15:
Xg = Xg0 * e-ka * t = F * Dose * e-ka * t
where F is the fraction of the dose which is absorbed, the bioavailability.
For the amount of drug in the body Xp ( = V * Cp), the differential equation is Equation 16:
![]()
The first term of this equation is ka * Xg which is absorption, and the second term is kel * V * Cp which is elimination.
Even without integrating this equation we can get an idea of the plasma concentration time curve.
At the start Xg >> V * Cp therefore the value of ![]() is positive, the slope will be positive and Cp will increase. With increasing time Xg will decrease, while initially Cp is increasing, therefore there will be a time when ka * Xg = kel * V * Cp. At this time
is positive, the slope will be positive and Cp will increase. With increasing time Xg will decrease, while initially Cp is increasing, therefore there will be a time when ka * Xg = kel * V * Cp. At this time ![]() will be zero and there will be a peak in the plasma concentration. At even later times Xg --> 0, and
will be zero and there will be a peak in the plasma concentration. At even later times Xg --> 0, and ![]() will become negative and Cp will decrease.
will become negative and Cp will decrease.
Integrated equation
Now we will integrate the equation. Starting with the differential equation we can substitute Xg = Xg0 *e-ka * t.
If we use F * DOSE for Xg0 where F is the fraction of the dose absorbed, the integrated equation for Cp versus time is Equation 17:
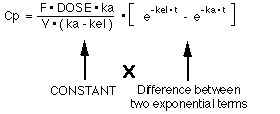
Notice that the right hand side of this equation (Equation 17) is a constant multiplied by the difference of two exponential terms. A biexponential equation.
We can plot Cp as a constant times the difference between two exponential curves. If we plot each exponential separately we get the following:
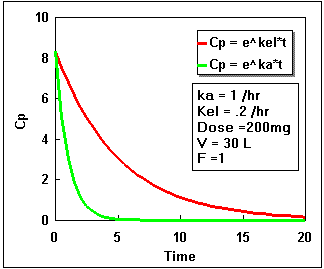
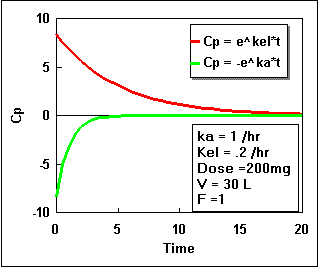
Notice that the difference starts at zero, increases, and finally decreases again. By adding the two lines in the second plot we get the actual plasma concentration. Plotting this difference we get:.
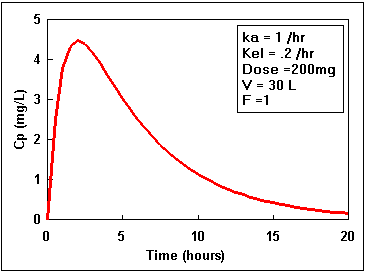
We can calculate the plasma concentration at anytime if we know the values of all the parameters of Equation 17.
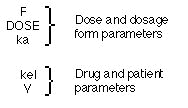
We can also calculate the time of peak concentration using the equation:
![]()
As an example we could calculate the peak plasma concentration given that F = 0.9, DOSE = 600 mg, ka = 1.0 hr-1, kel = 0.15 hr-1, and V = 30 liter.
![]() = 2.23 hour
= 2.23 hour
![]() = 21.18 x [ 0.7157 - 0.1075] = 12.9 mg/L
= 21.18 x [ 0.7157 - 0.1075] = 12.9 mg/L
As another example we could consider what would happen with ka = 0.2 hr-1 instead of 1.0 hr-1
![]() = 5.75 hour
= 5.75 hour
![]() = 72 x (0.4221 - 0.3166) = 7.6 mg/L lower and slower than before.
= 72 x (0.4221 - 0.3166) = 7.6 mg/L lower and slower than before.
Multiple doses
Using Equation 17 above we can create a spreadsheet that will describe the effects of multiple doses given at different time intervals (see plot below). Using a graph such as this, we can coordinate drug doses with proper time intervals in order to will keep drug concentrations at there optimum levels..
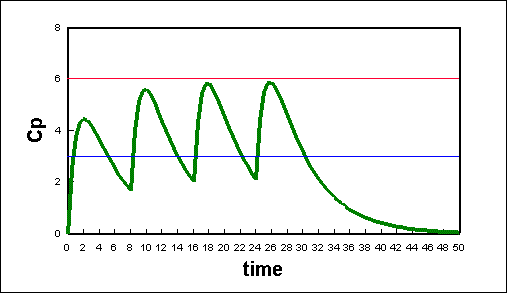
Plot of plasma concentration due to multiple oral doses of a hypothetical drug. The doses are 200 mg every 8 hours; the fraction absorbed was 1.00; the elimination constant is 0.2/hr; the absorption constant is 1.0/hr; and the volume concentration is 30 L.

