
Michaelis-Menten Kinetics
- Page ID
- 404
\( \newcommand{\vecs}[1]{\overset { \scriptstyle \rightharpoonup} {\mathbf{#1}} } \)
\( \newcommand{\vecd}[1]{\overset{-\!-\!\rightharpoonup}{\vphantom{a}\smash {#1}}} \)
\( \newcommand{\dsum}{\displaystyle\sum\limits} \)
\( \newcommand{\dint}{\displaystyle\int\limits} \)
\( \newcommand{\dlim}{\displaystyle\lim\limits} \)
\( \newcommand{\id}{\mathrm{id}}\) \( \newcommand{\Span}{\mathrm{span}}\)
( \newcommand{\kernel}{\mathrm{null}\,}\) \( \newcommand{\range}{\mathrm{range}\,}\)
\( \newcommand{\RealPart}{\mathrm{Re}}\) \( \newcommand{\ImaginaryPart}{\mathrm{Im}}\)
\( \newcommand{\Argument}{\mathrm{Arg}}\) \( \newcommand{\norm}[1]{\| #1 \|}\)
\( \newcommand{\inner}[2]{\langle #1, #2 \rangle}\)
\( \newcommand{\Span}{\mathrm{span}}\)
\( \newcommand{\id}{\mathrm{id}}\)
\( \newcommand{\Span}{\mathrm{span}}\)
\( \newcommand{\kernel}{\mathrm{null}\,}\)
\( \newcommand{\range}{\mathrm{range}\,}\)
\( \newcommand{\RealPart}{\mathrm{Re}}\)
\( \newcommand{\ImaginaryPart}{\mathrm{Im}}\)
\( \newcommand{\Argument}{\mathrm{Arg}}\)
\( \newcommand{\norm}[1]{\| #1 \|}\)
\( \newcommand{\inner}[2]{\langle #1, #2 \rangle}\)
\( \newcommand{\Span}{\mathrm{span}}\) \( \newcommand{\AA}{\unicode[.8,0]{x212B}}\)
\( \newcommand{\vectorA}[1]{\vec{#1}} % arrow\)
\( \newcommand{\vectorAt}[1]{\vec{\text{#1}}} % arrow\)
\( \newcommand{\vectorB}[1]{\overset { \scriptstyle \rightharpoonup} {\mathbf{#1}} } \)
\( \newcommand{\vectorC}[1]{\textbf{#1}} \)
\( \newcommand{\vectorD}[1]{\overrightarrow{#1}} \)
\( \newcommand{\vectorDt}[1]{\overrightarrow{\text{#1}}} \)
\( \newcommand{\vectE}[1]{\overset{-\!-\!\rightharpoonup}{\vphantom{a}\smash{\mathbf {#1}}}} \)
\( \newcommand{\vecs}[1]{\overset { \scriptstyle \rightharpoonup} {\mathbf{#1}} } \)
\(\newcommand{\longvect}{\overrightarrow}\)
\( \newcommand{\vecd}[1]{\overset{-\!-\!\rightharpoonup}{\vphantom{a}\smash {#1}}} \)
\(\newcommand{\avec}{\mathbf a}\) \(\newcommand{\bvec}{\mathbf b}\) \(\newcommand{\cvec}{\mathbf c}\) \(\newcommand{\dvec}{\mathbf d}\) \(\newcommand{\dtil}{\widetilde{\mathbf d}}\) \(\newcommand{\evec}{\mathbf e}\) \(\newcommand{\fvec}{\mathbf f}\) \(\newcommand{\nvec}{\mathbf n}\) \(\newcommand{\pvec}{\mathbf p}\) \(\newcommand{\qvec}{\mathbf q}\) \(\newcommand{\svec}{\mathbf s}\) \(\newcommand{\tvec}{\mathbf t}\) \(\newcommand{\uvec}{\mathbf u}\) \(\newcommand{\vvec}{\mathbf v}\) \(\newcommand{\wvec}{\mathbf w}\) \(\newcommand{\xvec}{\mathbf x}\) \(\newcommand{\yvec}{\mathbf y}\) \(\newcommand{\zvec}{\mathbf z}\) \(\newcommand{\rvec}{\mathbf r}\) \(\newcommand{\mvec}{\mathbf m}\) \(\newcommand{\zerovec}{\mathbf 0}\) \(\newcommand{\onevec}{\mathbf 1}\) \(\newcommand{\real}{\mathbb R}\) \(\newcommand{\twovec}[2]{\left[\begin{array}{r}#1 \\ #2 \end{array}\right]}\) \(\newcommand{\ctwovec}[2]{\left[\begin{array}{c}#1 \\ #2 \end{array}\right]}\) \(\newcommand{\threevec}[3]{\left[\begin{array}{r}#1 \\ #2 \\ #3 \end{array}\right]}\) \(\newcommand{\cthreevec}[3]{\left[\begin{array}{c}#1 \\ #2 \\ #3 \end{array}\right]}\) \(\newcommand{\fourvec}[4]{\left[\begin{array}{r}#1 \\ #2 \\ #3 \\ #4 \end{array}\right]}\) \(\newcommand{\cfourvec}[4]{\left[\begin{array}{c}#1 \\ #2 \\ #3 \\ #4 \end{array}\right]}\) \(\newcommand{\fivevec}[5]{\left[\begin{array}{r}#1 \\ #2 \\ #3 \\ #4 \\ #5 \\ \end{array}\right]}\) \(\newcommand{\cfivevec}[5]{\left[\begin{array}{c}#1 \\ #2 \\ #3 \\ #4 \\ #5 \\ \end{array}\right]}\) \(\newcommand{\mattwo}[4]{\left[\begin{array}{rr}#1 \amp #2 \\ #3 \amp #4 \\ \end{array}\right]}\) \(\newcommand{\laspan}[1]{\text{Span}\{#1\}}\) \(\newcommand{\bcal}{\cal B}\) \(\newcommand{\ccal}{\cal C}\) \(\newcommand{\scal}{\cal S}\) \(\newcommand{\wcal}{\cal W}\) \(\newcommand{\ecal}{\cal E}\) \(\newcommand{\coords}[2]{\left\{#1\right\}_{#2}}\) \(\newcommand{\gray}[1]{\color{gray}{#1}}\) \(\newcommand{\lgray}[1]{\color{lightgray}{#1}}\) \(\newcommand{\rank}{\operatorname{rank}}\) \(\newcommand{\row}{\text{Row}}\) \(\newcommand{\col}{\text{Col}}\) \(\renewcommand{\row}{\text{Row}}\) \(\newcommand{\nul}{\text{Nul}}\) \(\newcommand{\var}{\text{Var}}\) \(\newcommand{\corr}{\text{corr}}\) \(\newcommand{\len}[1]{\left|#1\right|}\) \(\newcommand{\bbar}{\overline{\bvec}}\) \(\newcommand{\bhat}{\widehat{\bvec}}\) \(\newcommand{\bperp}{\bvec^\perp}\) \(\newcommand{\xhat}{\widehat{\xvec}}\) \(\newcommand{\vhat}{\widehat{\vvec}}\) \(\newcommand{\uhat}{\widehat{\uvec}}\) \(\newcommand{\what}{\widehat{\wvec}}\) \(\newcommand{\Sighat}{\widehat{\Sigma}}\) \(\newcommand{\lt}{<}\) \(\newcommand{\gt}{>}\) \(\newcommand{\amp}{&}\) \(\definecolor{fillinmathshade}{gray}{0.9}\)Two 20th century scientists, Leonor Michaelis and Maud Leonora Menten, proposed the model known as Michaelis-Menten Kinetics to account for enzymatic dynamics. The model serves to explain how an enzyme can cause kinetic rate enhancement of a reaction and explains how reaction rates depends on the concentration of enzyme and substrate.
Introduction
The general reaction scheme of an enzyme-catalyzed reaction is as follows:
\[ E + S \xrightarrow[ ]{k_1}[ ES ] \xrightarrow[ ] {k_2} E + P \]
The enzyme interacts with the substrate by binding to its active site to form the enzyme-substrate complex, ES. That reaction is followed by the decomposition of ES to regenerate the free enzyme, E, and the new product, P.
To begin our discussion of enzyme kinetics, let's define the number of moles of product (P) formed per time as V. The variable, V, is also referred to as the rate of catalysis of an enzyme. For different enzymes, V varies with the concentration of the substrate, S. At low S, V is linearly proportional to S, but when S is high relative to the amount of total enzyme, V is independent of S. The concentration of S is important in determining the initial rate of an enzyme-catalyzed reaction. A more thorough explanation of enzyme rates can be found here: Definition of Reaction Rate.
To understand Michaelis-Menten Kinetics, we will use the general enzyme reaction scheme shown below, which includes the back reactions in addition the the forward reactions:
\[ E + S \xrightarrow[ ]{k_1}[ ES ] \xrightarrow[ ] {k_2} E + P \]
\[ E + S \xleftarrow[ ]{k_3}[ ES ] \xleftarrow[ ] {k_4} E + P \]
The table below defines each of the rate constants in the above scheme.
| Rate Constant | Reaction |
|---|---|
| \(k_1\) | The binding of the enzyme to the substrate forming the enzyme substrate complex. |
| \(k_2\) | Catalytic rate; the catalysis reaction producing the final reaction product and regenerating the free enzyme. This is the rate limiting step. |
| \(k_3\) | The dissociation of the enzyme-substrate complex to free enzyme and substrate . |
| \(k_4\) | The reverse reaction of catalysis. |
Substrate Complex
\( E + S \xrightarrow[ ]{k_1} ES \) \( v_o = k_1[E][S] \)
\( ES \xrightarrow[ ]{k_2} E + S \) \( v_o = k_2[ES] \)
\( ES \xrightarrow[ ]{k_3} E + P\) \( v_o = k_3[ES] \)
\( E + P \xrightarrow[ ]{k_4} ES \) \( v_o = k_4[E][P]=0 \)
The ES complex is formed by combining enzyme E with substrate S at rate constant k1. The ES complex can either dissociate to form EF (free enzyme) and S, or form product P at rate constant k2 and k3, respectively. The velocity equation can be derived in either of the 2 methods that follow.
Method 1: The Rapid Equilibrium Approximation
E, S, and the ES complex can equilibrate very rapidly. The instantaneous velocity is the catalytic rate that is equal to the product of ES concentration and k2 the catalytic rate constant.
\[ v_o = k_2[E - S] \]
The total enzyme concentration (ET) is equal to the concentration of free enzyme E (EF) plus the concentration of the bound enzyme in ES complex:
\[ [E]_T = [E_F] + [ES] \]
\[ K_s = \dfrac{k_2}{k_1} = \dfrac{[E][S]}{[ES]} \]
\[K_s \dfrac{([E_o] - [ES])[S]}{[ES]}\]
\[[ES] = \dfrac{[E_o][S]}{K_s + [S]}\]
\[v_o = \left(\dfrac{dP}{dt}\right)_o = k_3[ES]\]
\[v_o = \left(\dfrac{dP}{dt} \right)_o = \dfrac{k_3[Eo][S]}{Ks + [S]}\]
At high substrate concentrations, \([S] >> K_s\) we get:
\( v_o = \left(\dfrac{dP}{dt}\right)_o = k_3[E_o] = V_{max} \) (1)
Method 2: The Steady-State Approximation
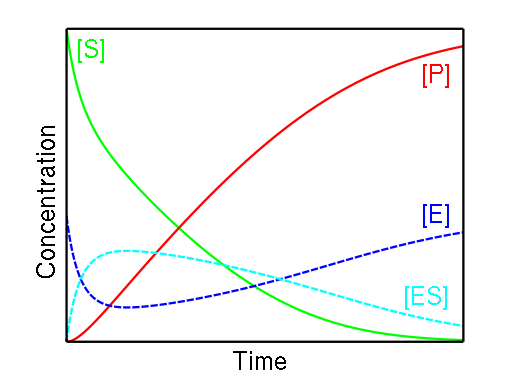
Figure \(\PageIndex{1}\) below shows the relatively low and constant concentration of the enzyme-substrate complex due to the complex's slow formation and rapid consumption. Note the falling substrate concentration and the rising product concentration.
The rates of formation and breakdown of the E - S complex are given in terms of known quantities:
- The rate of formation of E-S = \(k_1[E][S]\)
(with the assumption that [P] =0)
- The rate of breakdown of E-S = \(k_2 [ES] + k_3[ES] = (K_2 + K_3) [ES] \)
At steady state,
\[ \dfrac{d[ES]}{dt} = k_1[E][S] +k_2[ES] + k_3 [ES] =0\]
Therefore, rate of formation of E-S is equal to the rate of breakdown of E-S
So,
\[k_1[E][S] = (k_2 + k_3)[ES]\]
Dividing through by \(k_1\):
\[ [E] [S] = \dfrac{(k_2 + k_3)}{k_1} [E-S]\]
Substituting \(\dfrac{(k_2 + k_3)}{k_1}\) with kM:
\([E] [S] = K_M [ES]\)
\[K_M = \dfrac{breakdown [ES]}{formation [ES]}\]
\(K_m\) implies that half of the active sites on the enzymes are filled. Different enzymes have different \(K_m\) values. They typically range from 10-1 to 10-7 M. The factors that affect \(K_m\) are:
- pH
- temperature
- ionic strengths
- the nature of the substrate
Substituting [EF] with [ET]-[ES]: ET = [ES] + [EF]
([ET] - [ES]) [S] = kM [ES]
[ET] [S] -[ES][S] = kM [ES]
[ET] [S] = [ES] [S] + kM [ES]
[ET] [S] = [ES] ([S] + KM)
Solving for [ES]:
[ES] = \(\dfrac{([E_T] [S])}{([S] + K_M)}\)
The rate equation from the rate limiting step is:
Vo = \(\dfrac{dP}{dt}\) = k2[ES]
Multiplying both sides of the equation by k2:
\[ k_2 [ES] = k_2 (\dfrac{([E_T][S])}{(K_M + [S])}\]
\[ V_o = k_2 (\dfrac{([E_T][S])}{(K_M + [S])}\]
When S>>KM, vo is approximately equal to k2[ET]. When the [S] great, most of the enzyme is found in the bound state ([ES]) and Vo = Vmax
We can then substitue k2[ET] with Vmaxto get the Michaelis Menten Kinetic Equation:
vo =\(\dfrac{(v_{max}[S])}{(K_M+ [S])}\)
Reaction Order Note
When \([S] << K_M\),
\(v = \dfrac{V_{max}[S]}{K_M}\)
This means that the rate and the substrate concentration are directly proportional to each other. The reaction is first-order kinetics.
When \([S] >> K_M\),
\[v = V_{max}\]
This means that the rate is equal to the maximum velocity and is independent of the substrate concentration. The reaction is zero-order kinetics.

Then, at
\(v = \dfrac{V_{max}}{2}\), \(K_M = [S]\)
\[v = \dfrac{V_{max}}{2} = \dfrac{V_{max}[S]}{K_M + [S]}\]
Therefore, \(K_M\) is equal to the concentration of the substrate when the rate is half of the maximum velocity. From the Michaelis Menten Kinetic equation, we have many different ways to find \(K_M\) and \(V_{max}\) such as the Lineweaver-Burk plot, Hanes-Woolf plot, and Eadie-Hofstee plot, etc.
Lineweaver-Burk Plot
For example, by taking the reciprocal of the Michaelis Menten Kinetics Equation, we can obtain the Lineweaver-Burk double reciprocal plot:
\[ v_o= \dfrac{(V_{max}[S])}{(K_M +[S])} \]
\[ \dfrac{1}{v} = \dfrac{(K_M + [S])}{v_{max} [S]} \]
\[ \dfrac{1}{v} = \left( \dfrac{K_M}{V_{max}} \right) \left(\dfrac{1}{[S]} \right) + \dfrac{1}{V_{max}} \]
Apply this to equation for a straight line \( y = mx + b \) and we have:
\[ y = \dfrac{1}{v} \]
\[ x = \dfrac{1}{[S]} \]
\[ m = {slope} = \dfrac{K_M}{V_{max}} \]
\[ b = {y-intercept} = \dfrac{1}{V_{max}} \]
When we plot \(y = \dfrac{1}{v} \) versus \( x = \dfrac{1}{[S]} \), we obtain a straight line.
\[ x-intercept = \dfrac{-1}{K_M} \]
\[ y-intercept = \dfrac{1}{V_{max}} \]
\[ slope = \dfrac{K_M}{V_{max}} \]
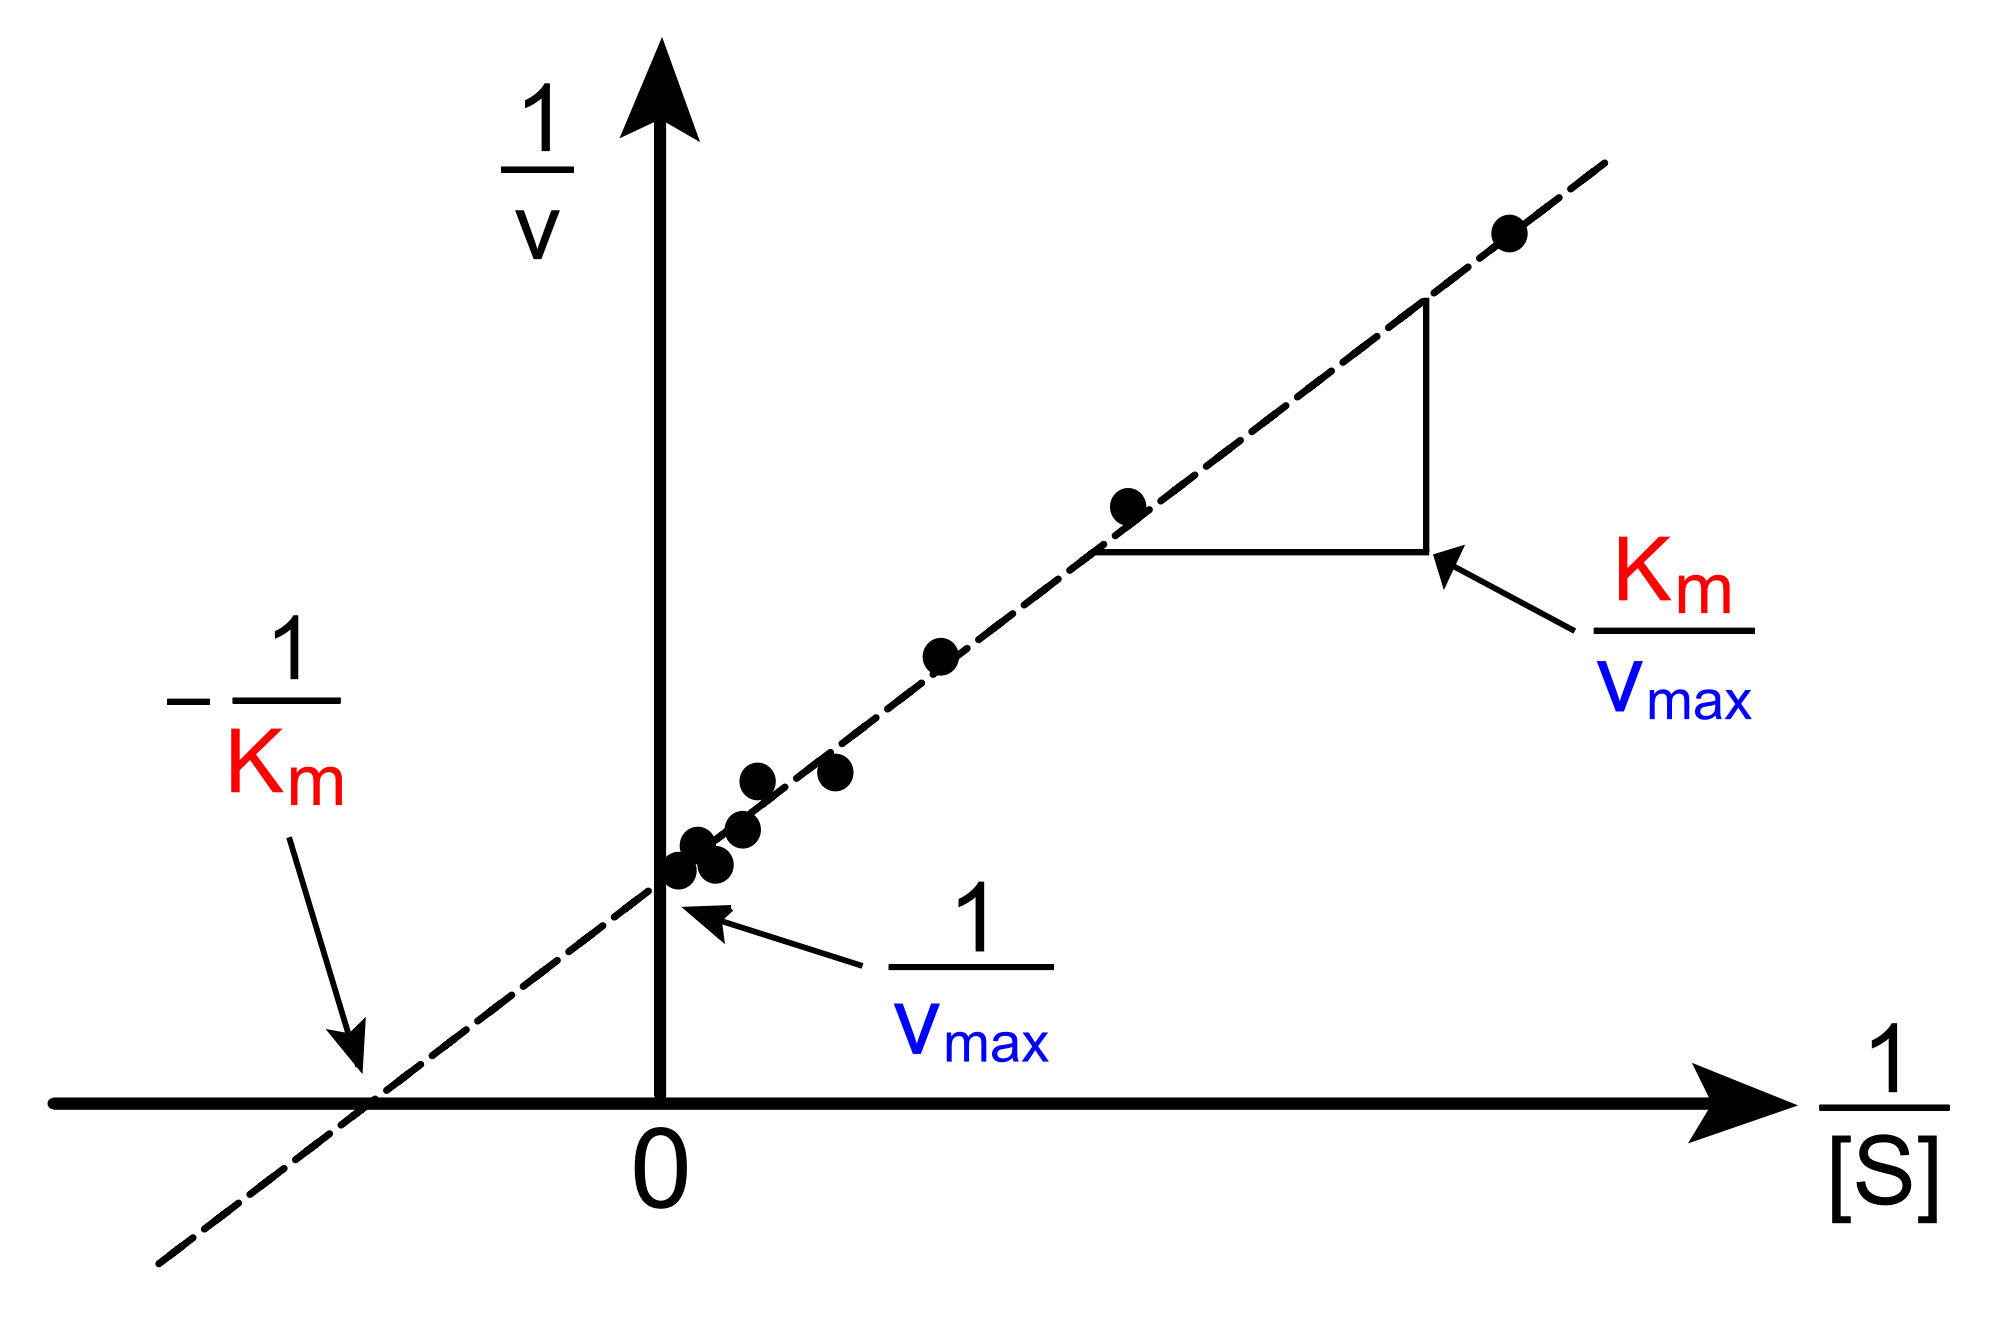
Figure 3. An example of a Lineweaver-Burke plot. from Wikipedia.
Eadie-Hofstee
Another way to calculate these values (\(k_M\), \(V_{max}\)) and represent enzyme kinetics:
\[ V_o = \dfrac{(V_{max}[S])}{(K_M +[S])} \]
vo (kM +[S]) = vmax[S]
vo kM + vo[S] = vmax [S]
vo [S] = -vo kM = vmax [S]
Dividing through by [S] \( v_o = -k_m \dfrac{v_o}{[S]} + v_{max} \)
Figure 4
References
- Chang, Raymond. Physical Chemistry for the Biosciences. Sansalito, CA: University Science, 2005. Page 363-371.
- Atkins, Peter and de Paula, Julio. Physical Chemistry for the Life Sciences. New York, NY: W. H. Freeman and Company, 2006. Page 309-313.
- Stryer, Lubert. Biochemistry (Third Edition). New York, NY: W.H. Freeman and Company, 1988. Page 187-191.
Contributors and Attributions
- Han Le, Sandy Algaze, Eva Tan