
Determining nanoparticle size and size distribution
- Page ID
- 241916

\( \newcommand{\vecs}[1]{\overset { \scriptstyle \rightharpoonup} {\mathbf{#1}} } \)
\( \newcommand{\vecd}[1]{\overset{-\!-\!\rightharpoonup}{\vphantom{a}\smash {#1}}} \)
\( \newcommand{\dsum}{\displaystyle\sum\limits} \)
\( \newcommand{\dint}{\displaystyle\int\limits} \)
\( \newcommand{\dlim}{\displaystyle\lim\limits} \)
\( \newcommand{\id}{\mathrm{id}}\) \( \newcommand{\Span}{\mathrm{span}}\)
( \newcommand{\kernel}{\mathrm{null}\,}\) \( \newcommand{\range}{\mathrm{range}\,}\)
\( \newcommand{\RealPart}{\mathrm{Re}}\) \( \newcommand{\ImaginaryPart}{\mathrm{Im}}\)
\( \newcommand{\Argument}{\mathrm{Arg}}\) \( \newcommand{\norm}[1]{\| #1 \|}\)
\( \newcommand{\inner}[2]{\langle #1, #2 \rangle}\)
\( \newcommand{\Span}{\mathrm{span}}\)
\( \newcommand{\id}{\mathrm{id}}\)
\( \newcommand{\Span}{\mathrm{span}}\)
\( \newcommand{\kernel}{\mathrm{null}\,}\)
\( \newcommand{\range}{\mathrm{range}\,}\)
\( \newcommand{\RealPart}{\mathrm{Re}}\)
\( \newcommand{\ImaginaryPart}{\mathrm{Im}}\)
\( \newcommand{\Argument}{\mathrm{Arg}}\)
\( \newcommand{\norm}[1]{\| #1 \|}\)
\( \newcommand{\inner}[2]{\langle #1, #2 \rangle}\)
\( \newcommand{\Span}{\mathrm{span}}\) \( \newcommand{\AA}{\unicode[.8,0]{x212B}}\)
\( \newcommand{\vectorA}[1]{\vec{#1}} % arrow\)
\( \newcommand{\vectorAt}[1]{\vec{\text{#1}}} % arrow\)
\( \newcommand{\vectorB}[1]{\overset { \scriptstyle \rightharpoonup} {\mathbf{#1}} } \)
\( \newcommand{\vectorC}[1]{\textbf{#1}} \)
\( \newcommand{\vectorD}[1]{\overrightarrow{#1}} \)
\( \newcommand{\vectorDt}[1]{\overrightarrow{\text{#1}}} \)
\( \newcommand{\vectE}[1]{\overset{-\!-\!\rightharpoonup}{\vphantom{a}\smash{\mathbf {#1}}}} \)
\( \newcommand{\vecs}[1]{\overset { \scriptstyle \rightharpoonup} {\mathbf{#1}} } \)
\(\newcommand{\longvect}{\overrightarrow}\)
\( \newcommand{\vecd}[1]{\overset{-\!-\!\rightharpoonup}{\vphantom{a}\smash {#1}}} \)
\(\newcommand{\avec}{\mathbf a}\) \(\newcommand{\bvec}{\mathbf b}\) \(\newcommand{\cvec}{\mathbf c}\) \(\newcommand{\dvec}{\mathbf d}\) \(\newcommand{\dtil}{\widetilde{\mathbf d}}\) \(\newcommand{\evec}{\mathbf e}\) \(\newcommand{\fvec}{\mathbf f}\) \(\newcommand{\nvec}{\mathbf n}\) \(\newcommand{\pvec}{\mathbf p}\) \(\newcommand{\qvec}{\mathbf q}\) \(\newcommand{\svec}{\mathbf s}\) \(\newcommand{\tvec}{\mathbf t}\) \(\newcommand{\uvec}{\mathbf u}\) \(\newcommand{\vvec}{\mathbf v}\) \(\newcommand{\wvec}{\mathbf w}\) \(\newcommand{\xvec}{\mathbf x}\) \(\newcommand{\yvec}{\mathbf y}\) \(\newcommand{\zvec}{\mathbf z}\) \(\newcommand{\rvec}{\mathbf r}\) \(\newcommand{\mvec}{\mathbf m}\) \(\newcommand{\zerovec}{\mathbf 0}\) \(\newcommand{\onevec}{\mathbf 1}\) \(\newcommand{\real}{\mathbb R}\) \(\newcommand{\twovec}[2]{\left[\begin{array}{r}#1 \\ #2 \end{array}\right]}\) \(\newcommand{\ctwovec}[2]{\left[\begin{array}{c}#1 \\ #2 \end{array}\right]}\) \(\newcommand{\threevec}[3]{\left[\begin{array}{r}#1 \\ #2 \\ #3 \end{array}\right]}\) \(\newcommand{\cthreevec}[3]{\left[\begin{array}{c}#1 \\ #2 \\ #3 \end{array}\right]}\) \(\newcommand{\fourvec}[4]{\left[\begin{array}{r}#1 \\ #2 \\ #3 \\ #4 \end{array}\right]}\) \(\newcommand{\cfourvec}[4]{\left[\begin{array}{c}#1 \\ #2 \\ #3 \\ #4 \end{array}\right]}\) \(\newcommand{\fivevec}[5]{\left[\begin{array}{r}#1 \\ #2 \\ #3 \\ #4 \\ #5 \\ \end{array}\right]}\) \(\newcommand{\cfivevec}[5]{\left[\begin{array}{c}#1 \\ #2 \\ #3 \\ #4 \\ #5 \\ \end{array}\right]}\) \(\newcommand{\mattwo}[4]{\left[\begin{array}{rr}#1 \amp #2 \\ #3 \amp #4 \\ \end{array}\right]}\) \(\newcommand{\laspan}[1]{\text{Span}\{#1\}}\) \(\newcommand{\bcal}{\cal B}\) \(\newcommand{\ccal}{\cal C}\) \(\newcommand{\scal}{\cal S}\) \(\newcommand{\wcal}{\cal W}\) \(\newcommand{\ecal}{\cal E}\) \(\newcommand{\coords}[2]{\left\{#1\right\}_{#2}}\) \(\newcommand{\gray}[1]{\color{gray}{#1}}\) \(\newcommand{\lgray}[1]{\color{lightgray}{#1}}\) \(\newcommand{\rank}{\operatorname{rank}}\) \(\newcommand{\row}{\text{Row}}\) \(\newcommand{\col}{\text{Col}}\) \(\renewcommand{\row}{\text{Row}}\) \(\newcommand{\nul}{\text{Nul}}\) \(\newcommand{\var}{\text{Var}}\) \(\newcommand{\corr}{\text{corr}}\) \(\newcommand{\len}[1]{\left|#1\right|}\) \(\newcommand{\bbar}{\overline{\bvec}}\) \(\newcommand{\bhat}{\widehat{\bvec}}\) \(\newcommand{\bperp}{\bvec^\perp}\) \(\newcommand{\xhat}{\widehat{\xvec}}\) \(\newcommand{\vhat}{\widehat{\vvec}}\) \(\newcommand{\uhat}{\widehat{\uvec}}\) \(\newcommand{\what}{\widehat{\wvec}}\) \(\newcommand{\Sighat}{\widehat{\Sigma}}\) \(\newcommand{\lt}{<}\) \(\newcommand{\gt}{>}\) \(\newcommand{\amp}{&}\) \(\definecolor{fillinmathshade}{gray}{0.9}\)Purpose: The purpose of this exercise is to determine the average diameter of gold nanoparticles using a Transmission Electron Microscope (TEM). In addition, the size distribution will be evaluated.
Learning Outcomes:
At the end of this assignment you will be able to
- Analyze TEM images to determine the average particle diameter.
- Determine the size distribution for each nanoparticle preparation previously synthesized.
Assignment:
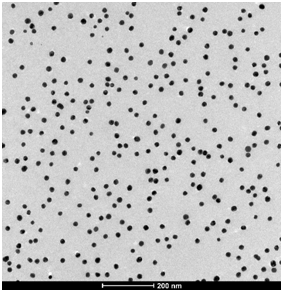
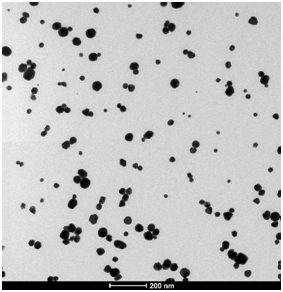
Figure 5. HRTEM images of gold nanoparticles synthesized using a pH of 5.4 and a (a) 2:1 and (b) 7:1 ratio of citrate to tetrachloroauric acid.
The images shown in Figure 5 were collected using a High Resolution Transmission Electron Microscope on nanoparticles prepared using different citrate to tetrachloroauric acid ratio, at pH 5.4. Both images use the same scale of 200 nm.
Q10. Looking at the images on a qualitative basis, what differences do you observe? What can be said about the size of the particles and their size distribution at the two different experimental conditions?
To quantitatively analyze the images and extract information about particle size and size distribution, you will use a free software called ImageJ (http://imagej.nih.gov/ij/). The first task will be to determine the Feret’s diameter of the particles. Follow these instructions on how to use ImageJ.
Go to the “Experimental Data” link and download the image labeled ‘2-1 pH 5.4’. Next, load the image in ImageJ and determine the Feret’s diameter.
Q11. What is the value of the Feret’s diameter you obtained from the analysis of the image showed in Figure 5a?
In the data in Table 2, three different ratios of citrate to tetrachloroauric acid were investigated. In addition, for each ratio, three different values of pH were explored. Use the data in Table 2 to answer the following questions.
Table 2. Summary of experimental results
|
Citrate/Au |
pH |
Particle |
|---|---|---|
|
2.0:1 |
4.2 |
20.00 ± 0.50 |
|
5.4 |
21.73 ± 0.40 |
|
|
7.0 |
21.22 ± 1.00 |
|
|
4.0:1 |
4.2 |
23.30 ± 0.78 |
|
5.4 |
26.52 ± 1.57 |
|
|
7.0 |
26.76 ± 0.99 |
|
|
7.0:1 |
4.2 |
31.87 ± 2.45 |
|
5.4 |
33.91 ± 4.25 |
|
|
7.0 |
No particles formed |
Q12. What is the effect of changing the reagents molar ratio on particle size?
Q13. What is the effect of varying the pH on particle size?
Q14. What statistical tests could you apply to determine whether differences in particle diameter are statistically different?
Q15. Summarize your findings. Is there a relationship between molar ratios of reagents and particle size?
Q16. If you wanted to synthesize particles with a diameter of approximately 20 nm, which experimental conditions would you use?
Next, you will explore the particle size distribution using again the image labeled ‘2-1 pH 5.4’. The output from the ImageJ analysis will list each detected particle and its diameter. Count all the particles of a given diameter (you may want to group them in brackets within 0.5 or 1 nm) and, using a spreadsheet, compile a chart reporting the percentage of occurrence of each particle of a given diameter.
Q17. What trends emerge from your analysis? Is there a set of experimental conditions that yield a more uniform particle distribution?
Use the particle size distribution data (see experimental data link) to continue.
Table 3 summarizes the percentage particles of a given diameter observed for gold nanoparticles synthesized using a 2:1 citrate: HAuCl4 molar ratio at pH 5.4. As seen in Table 2, these experimental conditions yield particles with diameter 21.73 ± 0.40.
Table 3. Particle size distribution for gold nanoparticles synthesized using a 2:1 citrate: HAuCl4 molar ratio at pH 5.4.
|
Particle Diameter (nm) |
Percentage |
|---|---|
|
12 |
0.104058 |
|
13 |
0.208117 |
|
14 |
0.104058 |
|
15 |
0.104058 |
|
16 |
0.780437 |
|
17 |
1.040583 |
|
18 |
2.549428 |
|
19 |
6.919875 |
|
20 |
13.99584 |
|
21 |
21.12383 |
|
22 |
20.91571 |
|
23 |
15.08845 |
|
24 |
9.313215 |
|
25 |
4.942768 |
|
26 |
2.289282 |
Examine the data in Table 3. You may want to plot a graph to better visualize the data. Remember, we are trying to identify which experimental conditions yield a monodisperse (one uniform size) product.
Q18. What would you conclude about the distribution obtained by the specific set of synthetic parameters shown in Table 3?
In order to put into context the results of your experiment, it may be useful to take a look at the product specifications for Gold Nanoparticle Reference Materials sold by the National Institute of Standards and Technology (NIST). Go to http://www.nist.gov/pml/div683/gold_010808.cfm
Download the RM 8012, Gold Nanoparticles, Nominal 30 nm Diameter Report of Investigation which contains information about the average particle size as determined by different techniques as well as size distribution histograms.
Q19. If you purchased 30 nm gold nanoparticles from NIST, what particle size diameter would you get? Are all the particles of the same size?
Obviously, there is a relatively large variation in the particle size distribution even for a standard material sold by NIST. Continue analyzing particle distribution data (link) for nanoparticles synthesized using the experimental design described in Figure 4.
Q20. Is there an effect on the particle size distribution when changing the reagents molar ratio?
Q21. Is there an effect on the particle size distribution when varying the pH?
Q22. Summarize your findings. Is molar ratio or pH the controlling factor in ensuring a yield of uniform particles?