
7.6: XAFS
- Page ID
- 55911

\( \newcommand{\vecs}[1]{\overset { \scriptstyle \rightharpoonup} {\mathbf{#1}} } \)
\( \newcommand{\vecd}[1]{\overset{-\!-\!\rightharpoonup}{\vphantom{a}\smash {#1}}} \)
\( \newcommand{\id}{\mathrm{id}}\) \( \newcommand{\Span}{\mathrm{span}}\)
( \newcommand{\kernel}{\mathrm{null}\,}\) \( \newcommand{\range}{\mathrm{range}\,}\)
\( \newcommand{\RealPart}{\mathrm{Re}}\) \( \newcommand{\ImaginaryPart}{\mathrm{Im}}\)
\( \newcommand{\Argument}{\mathrm{Arg}}\) \( \newcommand{\norm}[1]{\| #1 \|}\)
\( \newcommand{\inner}[2]{\langle #1, #2 \rangle}\)
\( \newcommand{\Span}{\mathrm{span}}\)
\( \newcommand{\id}{\mathrm{id}}\)
\( \newcommand{\Span}{\mathrm{span}}\)
\( \newcommand{\kernel}{\mathrm{null}\,}\)
\( \newcommand{\range}{\mathrm{range}\,}\)
\( \newcommand{\RealPart}{\mathrm{Re}}\)
\( \newcommand{\ImaginaryPart}{\mathrm{Im}}\)
\( \newcommand{\Argument}{\mathrm{Arg}}\)
\( \newcommand{\norm}[1]{\| #1 \|}\)
\( \newcommand{\inner}[2]{\langle #1, #2 \rangle}\)
\( \newcommand{\Span}{\mathrm{span}}\) \( \newcommand{\AA}{\unicode[.8,0]{x212B}}\)
\( \newcommand{\vectorA}[1]{\vec{#1}} % arrow\)
\( \newcommand{\vectorAt}[1]{\vec{\text{#1}}} % arrow\)
\( \newcommand{\vectorB}[1]{\overset { \scriptstyle \rightharpoonup} {\mathbf{#1}} } \)
\( \newcommand{\vectorC}[1]{\textbf{#1}} \)
\( \newcommand{\vectorD}[1]{\overrightarrow{#1}} \)
\( \newcommand{\vectorDt}[1]{\overrightarrow{\text{#1}}} \)
\( \newcommand{\vectE}[1]{\overset{-\!-\!\rightharpoonup}{\vphantom{a}\smash{\mathbf {#1}}}} \)
\( \newcommand{\vecs}[1]{\overset { \scriptstyle \rightharpoonup} {\mathbf{#1}} } \)
\( \newcommand{\vecd}[1]{\overset{-\!-\!\rightharpoonup}{\vphantom{a}\smash {#1}}} \)
\(\newcommand{\avec}{\mathbf a}\) \(\newcommand{\bvec}{\mathbf b}\) \(\newcommand{\cvec}{\mathbf c}\) \(\newcommand{\dvec}{\mathbf d}\) \(\newcommand{\dtil}{\widetilde{\mathbf d}}\) \(\newcommand{\evec}{\mathbf e}\) \(\newcommand{\fvec}{\mathbf f}\) \(\newcommand{\nvec}{\mathbf n}\) \(\newcommand{\pvec}{\mathbf p}\) \(\newcommand{\qvec}{\mathbf q}\) \(\newcommand{\svec}{\mathbf s}\) \(\newcommand{\tvec}{\mathbf t}\) \(\newcommand{\uvec}{\mathbf u}\) \(\newcommand{\vvec}{\mathbf v}\) \(\newcommand{\wvec}{\mathbf w}\) \(\newcommand{\xvec}{\mathbf x}\) \(\newcommand{\yvec}{\mathbf y}\) \(\newcommand{\zvec}{\mathbf z}\) \(\newcommand{\rvec}{\mathbf r}\) \(\newcommand{\mvec}{\mathbf m}\) \(\newcommand{\zerovec}{\mathbf 0}\) \(\newcommand{\onevec}{\mathbf 1}\) \(\newcommand{\real}{\mathbb R}\) \(\newcommand{\twovec}[2]{\left[\begin{array}{r}#1 \\ #2 \end{array}\right]}\) \(\newcommand{\ctwovec}[2]{\left[\begin{array}{c}#1 \\ #2 \end{array}\right]}\) \(\newcommand{\threevec}[3]{\left[\begin{array}{r}#1 \\ #2 \\ #3 \end{array}\right]}\) \(\newcommand{\cthreevec}[3]{\left[\begin{array}{c}#1 \\ #2 \\ #3 \end{array}\right]}\) \(\newcommand{\fourvec}[4]{\left[\begin{array}{r}#1 \\ #2 \\ #3 \\ #4 \end{array}\right]}\) \(\newcommand{\cfourvec}[4]{\left[\begin{array}{c}#1 \\ #2 \\ #3 \\ #4 \end{array}\right]}\) \(\newcommand{\fivevec}[5]{\left[\begin{array}{r}#1 \\ #2 \\ #3 \\ #4 \\ #5 \\ \end{array}\right]}\) \(\newcommand{\cfivevec}[5]{\left[\begin{array}{c}#1 \\ #2 \\ #3 \\ #4 \\ #5 \\ \end{array}\right]}\) \(\newcommand{\mattwo}[4]{\left[\begin{array}{rr}#1 \amp #2 \\ #3 \amp #4 \\ \end{array}\right]}\) \(\newcommand{\laspan}[1]{\text{Span}\{#1\}}\) \(\newcommand{\bcal}{\cal B}\) \(\newcommand{\ccal}{\cal C}\) \(\newcommand{\scal}{\cal S}\) \(\newcommand{\wcal}{\cal W}\) \(\newcommand{\ecal}{\cal E}\) \(\newcommand{\coords}[2]{\left\{#1\right\}_{#2}}\) \(\newcommand{\gray}[1]{\color{gray}{#1}}\) \(\newcommand{\lgray}[1]{\color{lightgray}{#1}}\) \(\newcommand{\rank}{\operatorname{rank}}\) \(\newcommand{\row}{\text{Row}}\) \(\newcommand{\col}{\text{Col}}\) \(\renewcommand{\row}{\text{Row}}\) \(\newcommand{\nul}{\text{Nul}}\) \(\newcommand{\var}{\text{Var}}\) \(\newcommand{\corr}{\text{corr}}\) \(\newcommand{\len}[1]{\left|#1\right|}\) \(\newcommand{\bbar}{\overline{\bvec}}\) \(\newcommand{\bhat}{\widehat{\bvec}}\) \(\newcommand{\bperp}{\bvec^\perp}\) \(\newcommand{\xhat}{\widehat{\xvec}}\) \(\newcommand{\vhat}{\widehat{\vvec}}\) \(\newcommand{\uhat}{\widehat{\uvec}}\) \(\newcommand{\what}{\widehat{\wvec}}\) \(\newcommand{\Sighat}{\widehat{\Sigma}}\) \(\newcommand{\lt}{<}\) \(\newcommand{\gt}{>}\) \(\newcommand{\amp}{&}\) \(\definecolor{fillinmathshade}{gray}{0.9}\)X-ray absorption fine structure (XAFS) spectroscopy includes both X-ray absorption near edge structure (XANES) and extended X-ray absorption fine structure (EXAFS) spectroscopies. The difference between both techniques is the area to analyze, as shown in Figure \(\PageIndex{1}\) and the information each technique provides. The complete XAFS spectrum is collected across an energy range of around 200 eV before the absorption edge of interest and until 1000 eV after it (Figure \(\PageIndex{2}\)). The absorption edge is defined as the X-ray energy when the absorption coefficient has a pronounced increasing. This energy is equal to the energy required to excite an electron to an unoccupied orbital.
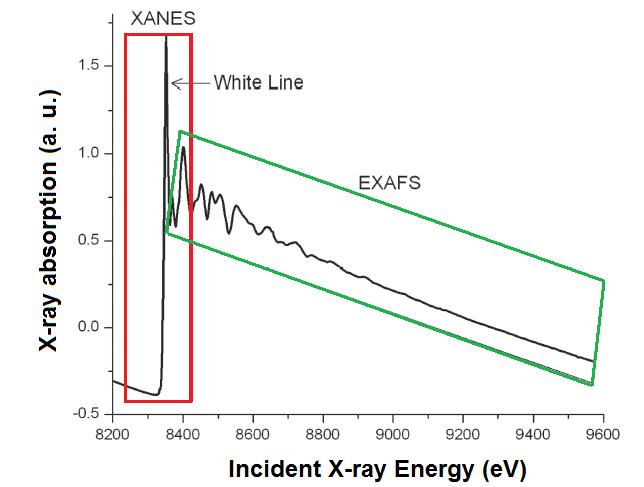
X-ray absorption near edge structure (XANES) is used to determine the valence state and coordination geometry, whereas extended X-ray absorption fine structure (EXAFS) is used to determine the local molecular structure of a particular element in a sample.
X-Ray Absorption Near Edge Structure (XANES) spectra
XANES is the part of the absorption spectrum closer an absorption edge. It covers from approximately -50 eV to +200 eV relative to the edge energy (Figure \(\PageIndex{2}\)).
Because the shape of the absorption edge is related to the density of states available for the excitation of the photoelectron, the binding geometry and the oxidation state of the atom affect the XANES part of the absorption spectrum.
Before the absorption edge, there is a linear and smooth area. Then, the edge appears as a step, which can have other extra shapes as isolated peaks, shoulders or a white line, which is a strong peak onto the edge. Those shapes give some information about the atom. For example, the presence of a white line indicates that after the electron releasing, the atomic states of the element is confined by the potential it feels. This peak sharp would be smoothed if the atom could enter to any kind of resonance. Important information is given because of the absorption edge position. Atoms with higher oxidation state have fewer electrons than protons, so, the energy states of the remaining electrons are lowered slightly, which causes a shift of the absorption edge energy up to several eV to a higher X-ray energy.
Extended X-ray absorption fine structure (EXAFS) spectra
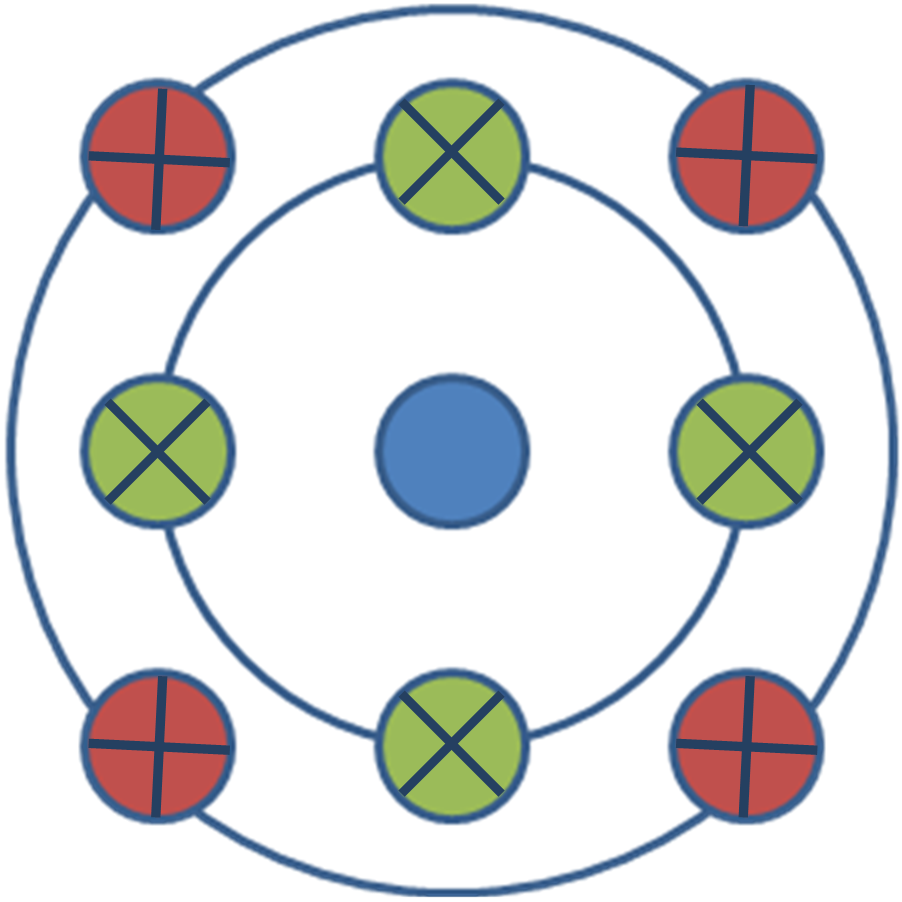
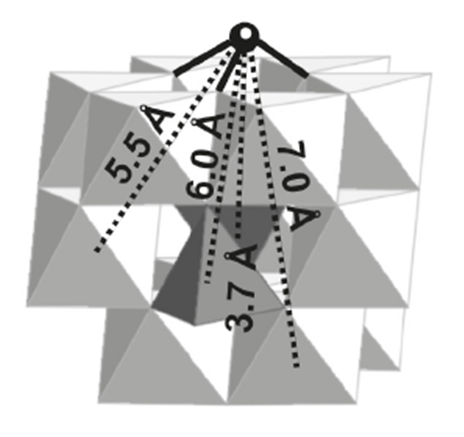
The EXAFS part of the spectrum is the oscillatory part of the absorption coefficient above around 1000 eV of the absorption edge. This region is used to determine the molecular bonding environments of the elements. EXAFS gives information about the types and numbers of atoms in coordination a specific atom and their inter-atomic distances. The atoms at the same radial distance from a determinate atom form a shell. The number of the atoms in the shell is the coordination number (e.g., Figure \(\PageIndex{2}\)).
An EXAFS signal is given by the photoelectron scattering generated for the center atom. The phase of the signal is determinate by the distance and the path the photoelectrons travel. A simple scheme of the different paths is shown by Figure \(\PageIndex{3}\). In the case of two shells around the centered atom, there is a degeneracy of four for the path between the main atom to the first shell, a degeneracy of four for the path between the main atom to the second shell, and a degeneracy of eight for the path between the main atom to the first shell, to the second one and to the center atom.

The analysis of EXAFS spectra is accomplished using Fourier transformation to fit the data to the EXAFS equation. The EXAFS equation is a sum of the contribution from all scattering paths of the photoelectrons \ref{1}, where each path is given by \ref{2}.
\[ \chi (k)\ =\ \sum_{i} \chi _{i}(k) \label{1} \]
\[ \chi _{i} (k) \equiv \frac{(N_{i}S_{0}^{2})F_{eff_{i}}(k)}{kR^{2}_{i}} \sin[2kR_{i}\ +\ \phi _{i}(k)] e^{-2\sigma ^{2}_{i} k^{2}} e^{\frac{-2R_{i}}{\lambda (k)}} \label{2} \]
The terms Feffi(k), φi(k), and λi(k) are the effective scattering amplitude of the photoelectron, the phase shift of the photoelectron, and the mean free path of the photoelectron, respectively. The term Ri is the half path length of the photoelectron (the distance between the centered atom and a coordinating atom for a single-scattering event). And the k2 is given by \ref{3}. The remaining variable are frequently determined by modeling the EXAFS spectrum.
\[ k^{2}\ = \frac{2m_{e}(E-E_{0}\ +\ \Delta E_{0})}{\hbar} \label{3} \]
XAFS Analysis for Arsenic Adsorption onto Iron Oxides
The absorption of arsenic species onto iron oxide offers n example of the information that can be obtained by EXAFS. Because the huge impact that the presence of arsenic in water can produce in societies there is a lot of research in the adsorption of arsenic in several kinds of materials, in particular nano materials. Some of the materials more promising for this kind of applications are iron oxides. The elucidation of the mechanism of arsenic coordination onto the surfaces of those materials has been studied lately using X-ray absorption spectroscopy.
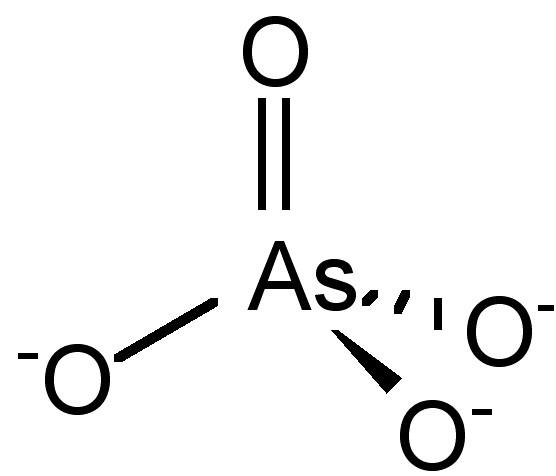
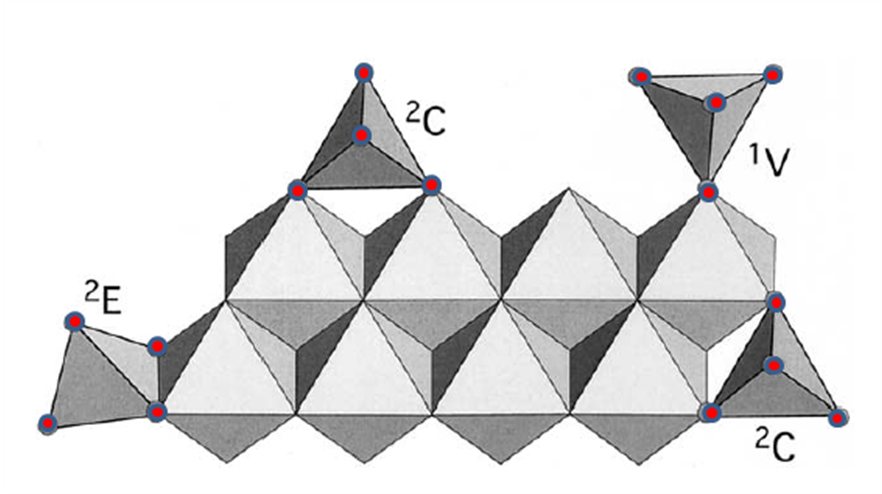
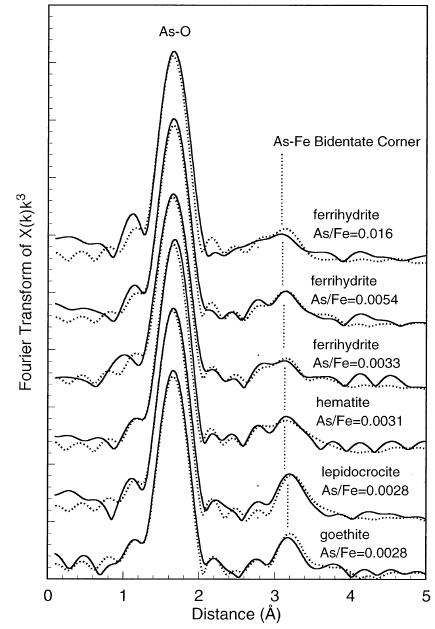
There are several ways how arsenate (AsO43−, Figure \(\PageIndex{4}\)) can be adsorbed onto the surfaces. Figure \(\PageIndex{5}\) shows the three ways that Sherman proposes arsenate can be adsorbed onto goethite (α-FeOOH): bidentate cornersharing (2C), bidentate edge sharing (2E) and monodentate corner-sharing (1V) shapes. Figure \(\PageIndex{6}\) shows that the bidentate corner sharing (2C) is the configuration that corresponds with the calculated parameters not only for goethite, but for several iron oxides.
Several studies have confirmed that the bidentate corner sharing (2C) is the one present in the arsenate adsorption but also one similar, a tridentate corner sharing complex (3C), for the arsenite adsorption onto most of iron oxides as shows Figure \(\PageIndex{7}\). Table \(\PageIndex{1}\) shows the coordination numbers and distances reported in the literature for the As(III) and As(V) onto goethite.
| As | CN As-O | R As-O (Å) | CN As-Fe | R As-Fe(Å) |
|---|---|---|---|---|
| III | 3.06±0.03 | 1.79±0.8 | 2.57±0.01 | 3.34±3 |
| 3.19 | 1.77±1 | 1.4 | 3.34±5 | |
| 3 | 1.78 | 2 | 3.55±5 | |
| V | 1.03 | 1.631 | 2 | 3.30 |
| 4.6 | 1.68 | -- | 3.55±5 |