2.8: Thermal Analysis
- Page ID
- 55853
\( \newcommand{\vecs}[1]{\overset { \scriptstyle \rightharpoonup} {\mathbf{#1}} } \)
\( \newcommand{\vecd}[1]{\overset{-\!-\!\rightharpoonup}{\vphantom{a}\smash {#1}}} \)
\( \newcommand{\id}{\mathrm{id}}\) \( \newcommand{\Span}{\mathrm{span}}\)
( \newcommand{\kernel}{\mathrm{null}\,}\) \( \newcommand{\range}{\mathrm{range}\,}\)
\( \newcommand{\RealPart}{\mathrm{Re}}\) \( \newcommand{\ImaginaryPart}{\mathrm{Im}}\)
\( \newcommand{\Argument}{\mathrm{Arg}}\) \( \newcommand{\norm}[1]{\| #1 \|}\)
\( \newcommand{\inner}[2]{\langle #1, #2 \rangle}\)
\( \newcommand{\Span}{\mathrm{span}}\)
\( \newcommand{\id}{\mathrm{id}}\)
\( \newcommand{\Span}{\mathrm{span}}\)
\( \newcommand{\kernel}{\mathrm{null}\,}\)
\( \newcommand{\range}{\mathrm{range}\,}\)
\( \newcommand{\RealPart}{\mathrm{Re}}\)
\( \newcommand{\ImaginaryPart}{\mathrm{Im}}\)
\( \newcommand{\Argument}{\mathrm{Arg}}\)
\( \newcommand{\norm}[1]{\| #1 \|}\)
\( \newcommand{\inner}[2]{\langle #1, #2 \rangle}\)
\( \newcommand{\Span}{\mathrm{span}}\) \( \newcommand{\AA}{\unicode[.8,0]{x212B}}\)
\( \newcommand{\vectorA}[1]{\vec{#1}} % arrow\)
\( \newcommand{\vectorAt}[1]{\vec{\text{#1}}} % arrow\)
\( \newcommand{\vectorB}[1]{\overset { \scriptstyle \rightharpoonup} {\mathbf{#1}} } \)
\( \newcommand{\vectorC}[1]{\textbf{#1}} \)
\( \newcommand{\vectorD}[1]{\overrightarrow{#1}} \)
\( \newcommand{\vectorDt}[1]{\overrightarrow{\text{#1}}} \)
\( \newcommand{\vectE}[1]{\overset{-\!-\!\rightharpoonup}{\vphantom{a}\smash{\mathbf {#1}}}} \)
\( \newcommand{\vecs}[1]{\overset { \scriptstyle \rightharpoonup} {\mathbf{#1}} } \)
\( \newcommand{\vecd}[1]{\overset{-\!-\!\rightharpoonup}{\vphantom{a}\smash {#1}}} \)
\(\newcommand{\avec}{\mathbf a}\) \(\newcommand{\bvec}{\mathbf b}\) \(\newcommand{\cvec}{\mathbf c}\) \(\newcommand{\dvec}{\mathbf d}\) \(\newcommand{\dtil}{\widetilde{\mathbf d}}\) \(\newcommand{\evec}{\mathbf e}\) \(\newcommand{\fvec}{\mathbf f}\) \(\newcommand{\nvec}{\mathbf n}\) \(\newcommand{\pvec}{\mathbf p}\) \(\newcommand{\qvec}{\mathbf q}\) \(\newcommand{\svec}{\mathbf s}\) \(\newcommand{\tvec}{\mathbf t}\) \(\newcommand{\uvec}{\mathbf u}\) \(\newcommand{\vvec}{\mathbf v}\) \(\newcommand{\wvec}{\mathbf w}\) \(\newcommand{\xvec}{\mathbf x}\) \(\newcommand{\yvec}{\mathbf y}\) \(\newcommand{\zvec}{\mathbf z}\) \(\newcommand{\rvec}{\mathbf r}\) \(\newcommand{\mvec}{\mathbf m}\) \(\newcommand{\zerovec}{\mathbf 0}\) \(\newcommand{\onevec}{\mathbf 1}\) \(\newcommand{\real}{\mathbb R}\) \(\newcommand{\twovec}[2]{\left[\begin{array}{r}#1 \\ #2 \end{array}\right]}\) \(\newcommand{\ctwovec}[2]{\left[\begin{array}{c}#1 \\ #2 \end{array}\right]}\) \(\newcommand{\threevec}[3]{\left[\begin{array}{r}#1 \\ #2 \\ #3 \end{array}\right]}\) \(\newcommand{\cthreevec}[3]{\left[\begin{array}{c}#1 \\ #2 \\ #3 \end{array}\right]}\) \(\newcommand{\fourvec}[4]{\left[\begin{array}{r}#1 \\ #2 \\ #3 \\ #4 \end{array}\right]}\) \(\newcommand{\cfourvec}[4]{\left[\begin{array}{c}#1 \\ #2 \\ #3 \\ #4 \end{array}\right]}\) \(\newcommand{\fivevec}[5]{\left[\begin{array}{r}#1 \\ #2 \\ #3 \\ #4 \\ #5 \\ \end{array}\right]}\) \(\newcommand{\cfivevec}[5]{\left[\begin{array}{c}#1 \\ #2 \\ #3 \\ #4 \\ #5 \\ \end{array}\right]}\) \(\newcommand{\mattwo}[4]{\left[\begin{array}{rr}#1 \amp #2 \\ #3 \amp #4 \\ \end{array}\right]}\) \(\newcommand{\laspan}[1]{\text{Span}\{#1\}}\) \(\newcommand{\bcal}{\cal B}\) \(\newcommand{\ccal}{\cal C}\) \(\newcommand{\scal}{\cal S}\) \(\newcommand{\wcal}{\cal W}\) \(\newcommand{\ecal}{\cal E}\) \(\newcommand{\coords}[2]{\left\{#1\right\}_{#2}}\) \(\newcommand{\gray}[1]{\color{gray}{#1}}\) \(\newcommand{\lgray}[1]{\color{lightgray}{#1}}\) \(\newcommand{\rank}{\operatorname{rank}}\) \(\newcommand{\row}{\text{Row}}\) \(\newcommand{\col}{\text{Col}}\) \(\renewcommand{\row}{\text{Row}}\) \(\newcommand{\nul}{\text{Nul}}\) \(\newcommand{\var}{\text{Var}}\) \(\newcommand{\corr}{\text{corr}}\) \(\newcommand{\len}[1]{\left|#1\right|}\) \(\newcommand{\bbar}{\overline{\bvec}}\) \(\newcommand{\bhat}{\widehat{\bvec}}\) \(\newcommand{\bperp}{\bvec^\perp}\) \(\newcommand{\xhat}{\widehat{\xvec}}\) \(\newcommand{\vhat}{\widehat{\vvec}}\) \(\newcommand{\uhat}{\widehat{\uvec}}\) \(\newcommand{\what}{\widehat{\wvec}}\) \(\newcommand{\Sighat}{\widehat{\Sigma}}\) \(\newcommand{\lt}{<}\) \(\newcommand{\gt}{>}\) \(\newcommand{\amp}{&}\) \(\definecolor{fillinmathshade}{gray}{0.9}\)Thermogravimetric Analysis
TGA and SWNTS
Thermogravimetric analysis (TGA) and the associated differential thermal analysis (DTA) are widely used for the characterization of both as-synthesized and side-wall functionalized single walled carbon nanotubes (SWNTs). Under oxygen, SWNTs will pyrolyze leaving any inorganic residue behind. In contrast in an inert atmosphere since most functional groups are labile or decompose upon heating and as SWNTs are stable up to 1200 °C, any weight loss before 800 °C is used to determine the functionalization ratio of side-wall functionalized SWNTs. The following properties of SWNTs can be determined using this TGA;
- The mass of metal catalyst impurity in as synthesized SWNTs.
- The number of functional groups per SWNT carbon (CSWNT).
- The mass of a reactive species absorbed by a functional group on a SWNT.
Quantitative determination of these properties are used to define the purity of SWNTs, and the extent of their functionalization.
An Overview of Thermogravimetric Analysis
The main function of TGA is the monitoring of the thermal stability of a material by recording the change in mass of the sample with respect to temperature. Figure \(\PageIndex{1}\) shows a simple diagram of the inside of a typical TGA.
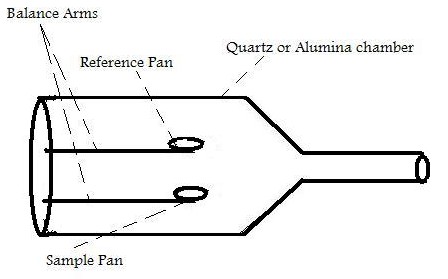
Inside the TGA, there are two pans, a reference pan and a sample pan. The pan material can be either aluminium or platinum. The type of pan used depends on the maximum temperature of a given run. As platinum melts at 1760 °C and alumium melts at 660 °C, platinum pans are chosen when the maximum temperature exceeds 660 °C. Under each pan there is a thermocouple which reads the temperature of the pan. Before the start of each run, each pan is balanced on a balance arm. The balance arms should be calibrated to compensate for the differential thermal expansion between the arms. If the arms are not calibrated, the instrument will only record the temperature at which an event occurred and not the change in mass at a certain time. To calibrate the system, the empty pans are placed on the balance arms and the pans are weighed and zeroed.
As well as recording the change in mass, the heat flow into the sample pan (differential scanning calorimetry, DSC) can also be measured and the difference in temperature between the sample and reference pan (differential thermal analysis, DTA). DSC is quantitative and is a measure of the total energy of the system. This is used to monitor the energy released and absorbed during a chemical reaction for a changing temperature. The DTA shows if and how the sample phase changed. If the DTA is constant, this means that there was no phase change. Figure \(\PageIndex{2}\) shows a DTA with typical examples of an exotherm and an endotherm.
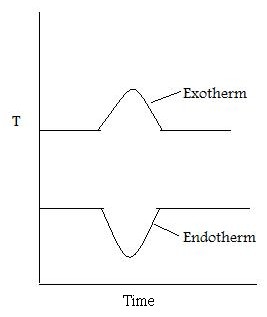
When the sample melts, the DTA dips which signifies an endotherm. When the sample is melting it requires energy from the system. Therefore the temperature of the sample pan decreases compared with the temperature of the reference pan. When the sample has melted, the temperature of the sample pan increases as the sample is releasing energy. Finally the temperatures of the reference and sample pans equilibrate resulting in a constant DTA. When the sample evaporates, there is a peak in the DTA. This exotherm can be explained in the same way as the endotherm.
Typically the sample mass range should be between 0.1 to 10 mg and the heating rate should be 3 to 5 °C/min.
Determination of the Mass of Iron Catalyst Impurity in HiPCO SWNTs
SWNTs are typically synthesized using metal catalysts. Those prepared using the HiPco method, contain residual Fe catalyst. The metal (i.e., Fe) is usually oxidized upon exposure to air to the appropriate oxide (i.e., Fe2O3). While it is sometimes unimportant that traces of metal oxide are present during subsequent applications it is often necessary to quantify their presence. This is particularly true if the SWNTs are to be used for cell studies since it has been shown that the catalyst residue is often responsible for observed cellular toxicity.
In order to calculate the mass of catalyst residue the SWNTs are pyrolyzed under air or O2, and the residue is assumed to be the oxide of the metal catalyst. Water can be added to the raw SWNTs, which enhances the low-temperature catalytic oxidation of carbon. A typical TGA plot of a sample of raw HiPco SWNTs is shown in Figure \(\PageIndex{3}\).
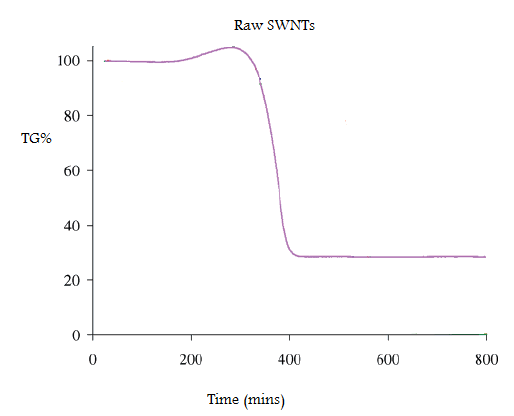
The weight gain (of ca. 5%) at 300 °C is due to the formation of metal oxide from the incompletely oxidized catalyst. To determine the mass of iron catalyst impurity in the SWNT, the residual mass must be calculated. The residual mass is the mass that is left in the sample pan at the end of the experiment. From this TGA diagram, it is seen that 70% of the total mass is lost at 400 °C. This mass loss is attributed to the removal of carbon. The residual mass is 30%. Given that this is due to both oxide and oxidized metal, the original total mass of residual catalyst in raw HiPCO SWNTs is ca. 25%.
Determining the Number of Functional Groups on SWNTs
The limitation of using SWNTs in any practical applications is their solubility; for example SWNTs have little to no solubility in most solvents due to aggregation of the tubes. Aggregation/roping of nanotubes occurs as a result of the high van der Waals binding energy of ca. 500 eV per μm of tube contact. The van der Waals force between the tubes is so great, that it take tremendous energy to pry them apart, making it very difficult to make combination of nanotubes with other materials such as in composite applications. The functionalization of nanotubes, i.e., the attachment of “chemical functional groups”, provides the path to overcome these barriers. Functionalization can improve solubility as well as processability, and has been used to align the properties of nanotubes to those of other materials. In this regard, covalent functionalization provides a higher degree of fine-tuning for the chemical and physical properties of SWNTs than non-covalent functionalization.
Functionalized nanotubes can be characterized by a variety of techniques, such as atomic force microscopy (AFM), transmission electron microscopy (TEM), UV-vis spectroscopy, and Raman spectroscopy, however, the quantification of the extent of functionalization is important and can be determined using TGA. Because any sample of functionalized-SWNTs will have individual tubes of different lengths (and diameters) it is impossible to determine the number of substituents per SWNT. Instead the extent of functionalization is expressed as number of substituents per SWNT carbon atom (CSWNT), or more often as CSWNT/substituent, since this is then represented as a number greater than 1.
Figure \(\PageIndex{4}\) shows a typical TGA for a functionalized SWNT. In this case it is polyethyleneimine (PEI) functionalized SWNTs prepared by the reaction of fluorinated SWNTs (F-SWNTs) with PEI in the presence of a base catalyst.
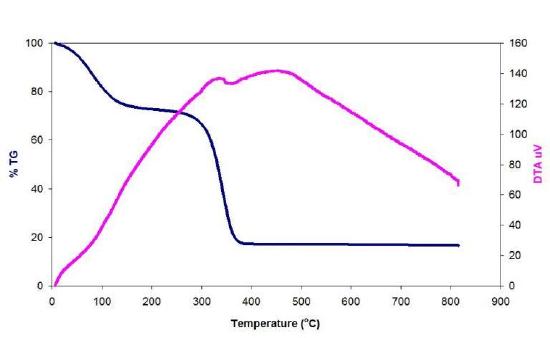
In the present case the molecular weight of the PEI is 600 g/mol. When the sample is heated, the PEI thermally decomposes leaving behind the unfunctionalized SWNTs. The initial mass loss below 100 °C is due to residual water and ethanol used to wash the sample.
In the following example the total mass of the sample is 25 mg.
- The initial mass, Mi = 25 mg = mass of the SWNTs, residues and the PEI.
- After the initial moisture has evaporated there is 68% of the sample left. 68% of 25 mg is 17 mg. This is the mass of the PEI and the SWNTs.
- At 300 °C the PEI starts to decompose and all of the PEI has been removed from the SWNTs at 370 °C. The mass loss during this time is 53% of the total mass of the sample. 53% of 25 mg is 13.25 mg.
- The molecular weight of this PEI is 600 g/mol. Therefore there is 0.013 g / 600 g/mol = 0.022 mmole of PEI in the sample.
- 15% of the sample is the residual mass, this is the mass of the decomposed SWNTs. 15% of 25 mg is 3.75 mg. The molecular weight of carbon is 12 g/mol. So there is 0.3125 mmole of carbon in the sample.
- There is 93.4 mol% of carbon and 6.5 mol% of PEI in the sample.
Determination of the Mass of a Chemical Absorbed by Functionalized SWNTs
Solid-state 13C NMR of PEI-SWNTs shows the presence of carboxylate substituents that can be attributed to carbamate formation as a consequence of the reversable CO2 absorption to the primary amine substituents of the PEI. Desorption of CO2 is accomplished by heating under argon at 75 °C.
The quantity of CO2 absorbed per PEI-SWNT unit may be determined by initially exposing the PEI-SWNT to a CO2 atmosphere to maximize absorption. The gas flow is switched to either Ar or N2 and the sample heated to liberate the absorbed CO2 without decomposing the PEI or the SWNTs. An example of the appropriate TGA plot is shown in Figure \(\PageIndex{5}\).
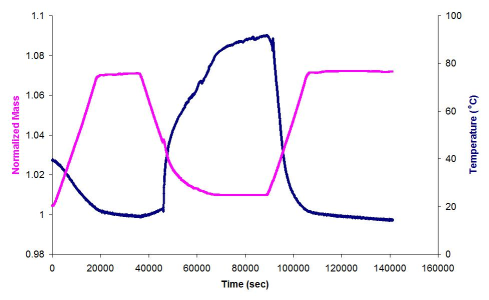
The sample was heated to 75 °C under Ar, and an initial mass loss due to moisture and/or atmospherically absorbed CO2 is seen. In the temperature range of 25 °C to 75 °C the flow gas was switched from an inert gas to CO2. In this region an increase in m-depenass is seen, the increase is due to CO2 absorption by the PEI (10000Da)-SWNT. Switching the carrier gas back to Ar resulted in the desorption of the CO2.
The total normalized mass of CO2 absorbed by the PEI(10000)-SWNT can be calculated as follows;
Solution Outline
- Minimum mass = mass of absorbant = Mabsorbant
- Maximum mass = mass of absorbant and absorbed species = Mtotal
- Absorbed mass = Mabsorbed = Mtotal - Mabsorbant
- % of absorbed species= (Mabsorbed/Mabsorbant)*100
- 1 mole of absorbed species = MW of absorbed species
- Number of moles of absorbed species = (Mabsorbed/MW of absorbed species)
- The number of moles of absorbed species absorbed per gram of absorbant= (1g/Mtotal)*(Number of moles of absorbed species)
Solution
- Mabsorbant = Mass of PEI-SWNT = 4.829 mg
- Mtotal = Mass of PEI-SWNT and CO2 = 5.258 mg
- Mabsorbed = Mtotal - Mabsorbant = 5.258 mg - 4.829 mg = 0.429 mg
- % of absorbed species= % of CO2 absorbed = (Mabsorbed/Mabsorbant)*100 = (0.429/4.829)*100 = 8.8%
- 1 mole of absorbed species = MW of absorbed species = MW of CO2 = 44 therefore 1 mole = 44g
- Number of moles of absorbed species = (Mabsorbed/MW of absorbed species)= (0.429 mg / 44 g) = 9.75 μM
- The number of moles of absorbed species absorbed per gram of absorbant =(1 g/Mtotal)*(Number of moles of absorbed species) = (1 g/5.258 mg)*(9.75)= 1.85 mmol of CO2 absorbed per gram of absorbant
TGA/DSC-FTIR Charecterization of Oxide Nanoparticles
Metal Oxide Nanoparticles
The binary compound of one or more oxygen atoms with at least one metal atom that forms a structure ≤100 nm is classified as metal oxide (MOx) nanoparticle. MOxnanoparticles have exceptional physical and chemical properties (especially if they are smaller than 10 nm) that are strongly related to their dimensions and to their morphology. These enhanced features are due to the increased surface to volume ratio which has a strong impact on the measured binding energies. Based on theoretical models, binding or cohesive energy is inversely related to particle size with a linear relationship \ref{1} .
\[E_{NP} = E_{bulk} /cdot [1 - c \cdot r^{-1} \label{1} \]
where ENP and Ebulk is the binding energy of the nanoparticle and the bulk binding energy respectively, c is a material constant and r is the radius of the cluster. As seen from \ref{1} , nanoparticles have lower binding energies than bulk material, which means lower electron cloud density and therefore more mobile electrons. This is one of the features that have been identified to contribute to a series of physical and chemical properties.
Synthesis of Metal Oxide Nanoparticles
Since today, numerous synthetic methods have been developed with the most common ones presented in Table \(\PageIndex{1}\). These methods have been successfully applied for the synthesis of a variety of materials with 0-D to 3-D complex structures. Among them, the solvothermal methods are by far the most popular ones due to their simplicity. Between the two classes of solvothermal methods, slow decomposition methods, usually called thermal decomposition methods, are preferred over the hot injection methods since they are less complicated, less dangerous and avoid the use of additional solvents.
| Method | Characteristics | Advantages | Disadvantages |
|---|---|---|---|
|
Solvothermal
|
|
|
|
| Template directed | Use of organic molecules or preexistent nanoparticles as templates for directing nanoparticle formation | High yield and high purity of nanoparticles | Template removal in some cases causes particle deformation or loss |
| Sonochemical | Ultrasound influence particle nucleation | Mild synthesis conditions | Limited applicability |
| Thermal evaporation | Thermal evaporation of Metal oxides | Monodisperse particle formation, excellent control in shape and structure | Extremely high temperatures, and vacuum system is required |
| Gas phase catalytic growth | Use of catalyst that serves as a preferential site for absorbing Metal reactants | Excellent control in shape and structure | Limited applicability |
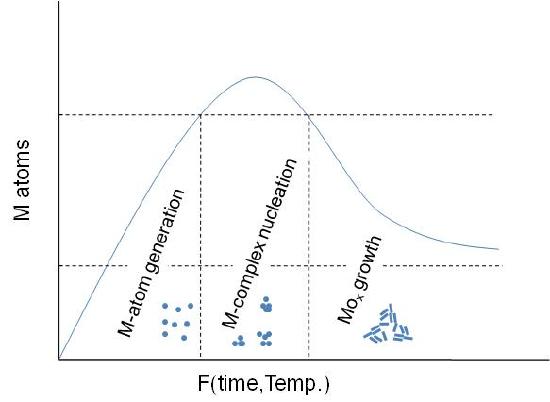
A general schematic diagram of the stages involving the nanoparticles formation is shown in Figure \(\PageIndex{6}\). As seen, first step is the M-atom generation by dissociation of the metal-precursor. Next step is the M-complex formulation, which is carried out before the actual particle assembly stage. Between this step and the final particle formulation, oxidation of the activated complex occurs upon interaction with an oxidant substance. The x-axis is a function of temperature or time or both depending on the synthesis procedure.
In all cases, the particles synthesized consist of MOx nanoparticle structures stabilized by one or more types of ligand(s) as seen in Figure \(\PageIndex{7}\). The ligands are usually long-chained organic molecules that have one more functional groups. These molecules protect the nanoparticles from attracting each other under van der Waals forces and therefore prevent them from aggregating.
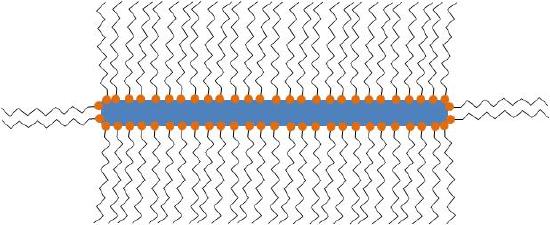
Even though often not referred to specifically, all particles synthesized are stabilized by organic (hydrophilic, hydrophobic or amphoteric) ligands. The detection and the understanding of the structure of these ligands can be of critical importance for understanding the controlling the properties of the synthesized nanoparticles.
Metal Oxide Nanoparticles Synthesized via slow decomposition
In this work, we refer to MOx nanoparticles synthesized via slow decomposition of a metal complex. In Table \(\PageIndex{2}\), a number of different MOxnanoparticles are presented, synthesized via metal complex dissociation. Metal–MOx and mixed MOx nanoparticles are not discussed here.
| Metal Oxide | Shape | Size (approx.) |
|---|---|---|
| Cerium oxide | dots | 5-20 nm |
| Iron oxide | dots, cubes | 8.5-23.4 nm |
| Maganese oxide | Multipods | > 50 nm |
| Zinc oxide | Hexagonal pyramid | 15-25 nm |
| Cobalt oxide | dots | ~ 10 nm |
| Chromium oxide | dots | 12 nm |
| Vanadium oxide | dots | 9 - 15 nm |
| Molybdenum oxide | dots | 5 nm |
| Rhodium oxide | dots, rods | 16 nm |
| Palladium oxide | dots | 18 nm |
| Ruthenium oxide | dots | 9 - 14 nm |
| Zirconium oxide | rods | 7 x 30 nm |
| Barium oxide | dots | 20 nm |
| Magnesium oxide | dots | 4 - 8 nm |
| Calcium oxide | dots, rods | 7 - 12 nm |
| Nickel oxide | dots | 8 - 15 nm |
| Titanium oxide | dots and rods | 2.3 - 30 nm |
| Tin oxide | dots | 2 - 5 nm |
| Indium oxide | dots | ~ 5 nm |
| Samaria | Square | ~ 10 nm |
A significant number of metal oxides synthesized using slow decomposition is reported in literature. If we use the periodic table to map the different MOx nanoparticles (Figure \(\PageIndex{8}\) ), e notice that most of the alkali and transition metals generate MOx nanoparticles, while only a few of the poor metals seem to do so, using this synthetic route. Moreover, two of the rare earth metals (Ce and Sm) have been reported to successfully give metal oxide nanoparticles via slow decomposition.
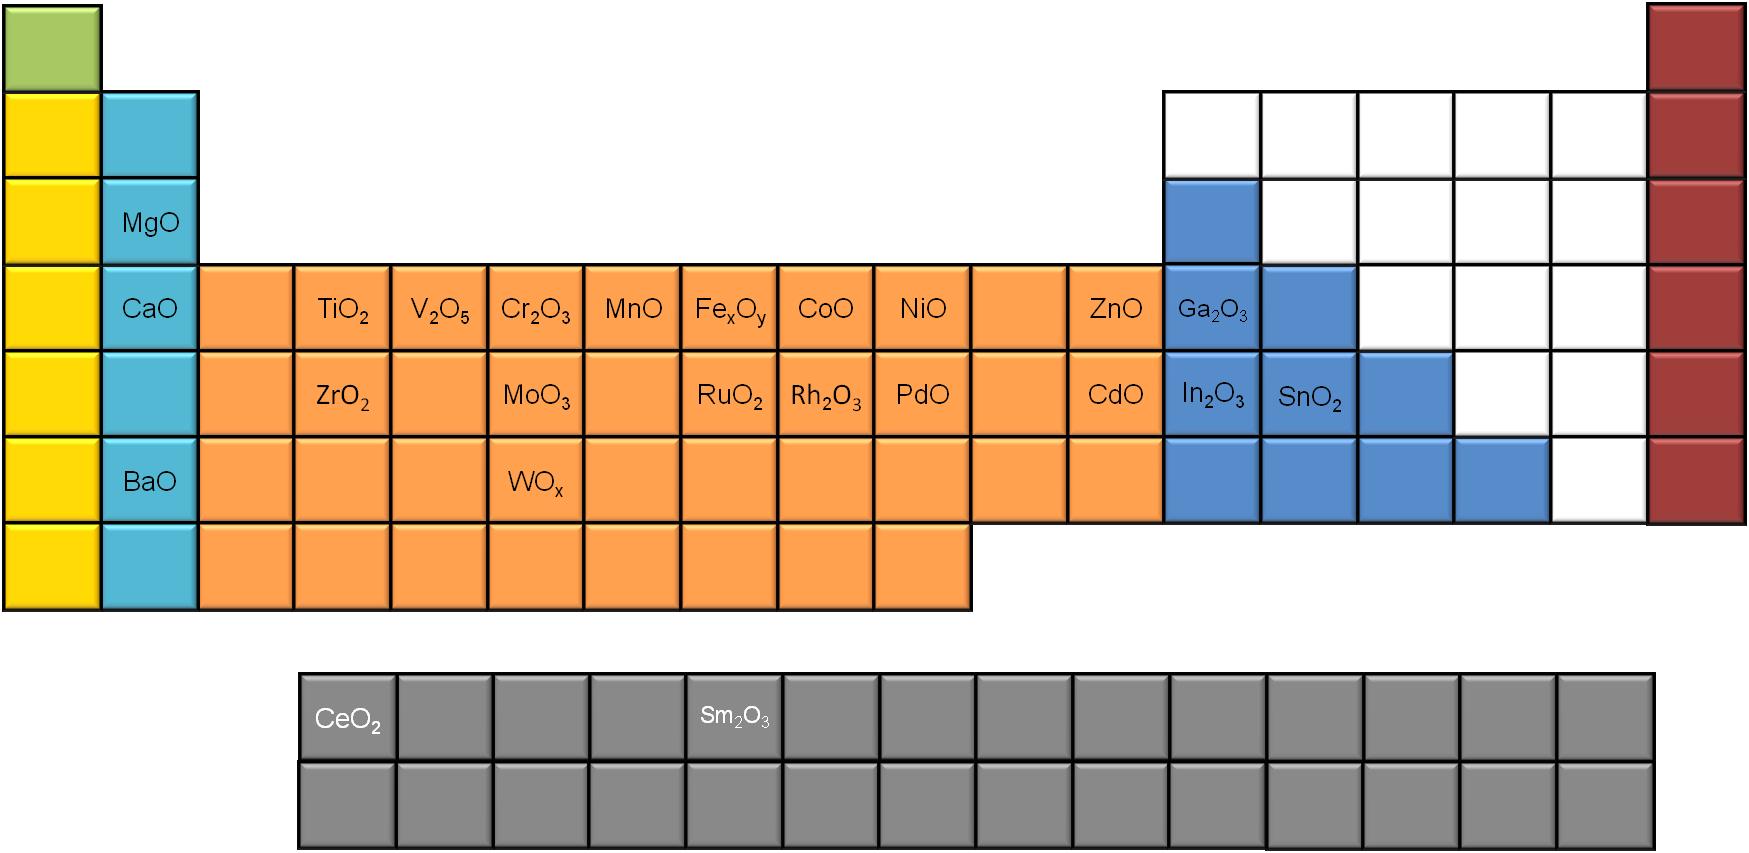
Among the different characterization techniques used for defining these structures, transition electron microscopy (TEM) holds the lion’s share. Nevertheless, most of the modern characterization methods are more important when it comes to understanding the properties of nanoparticles. X-ray photoelectron spectroscopy (XPS), X-ray diffraction (XRD), nuclear magnetic resonance (NMR), IR spectroscopy, Raman spectroscopy, and thermogravimetric analysis (TGA) methods are systematically used for characterization.
Synthesis and Characterization of WO3-x nanorods
The synthesis of WO3-x nanorods is based on the method published by Lee et al. A slurry mixture of Me3NO∙2H2O, oleylamine and W(CO)6 was heated up to 250 °C at a rate of 3 °C/min (Figure \(\PageIndex{9}\) ). The mixture was aged at this temperature for 3 hours before cooling down to room temperature.
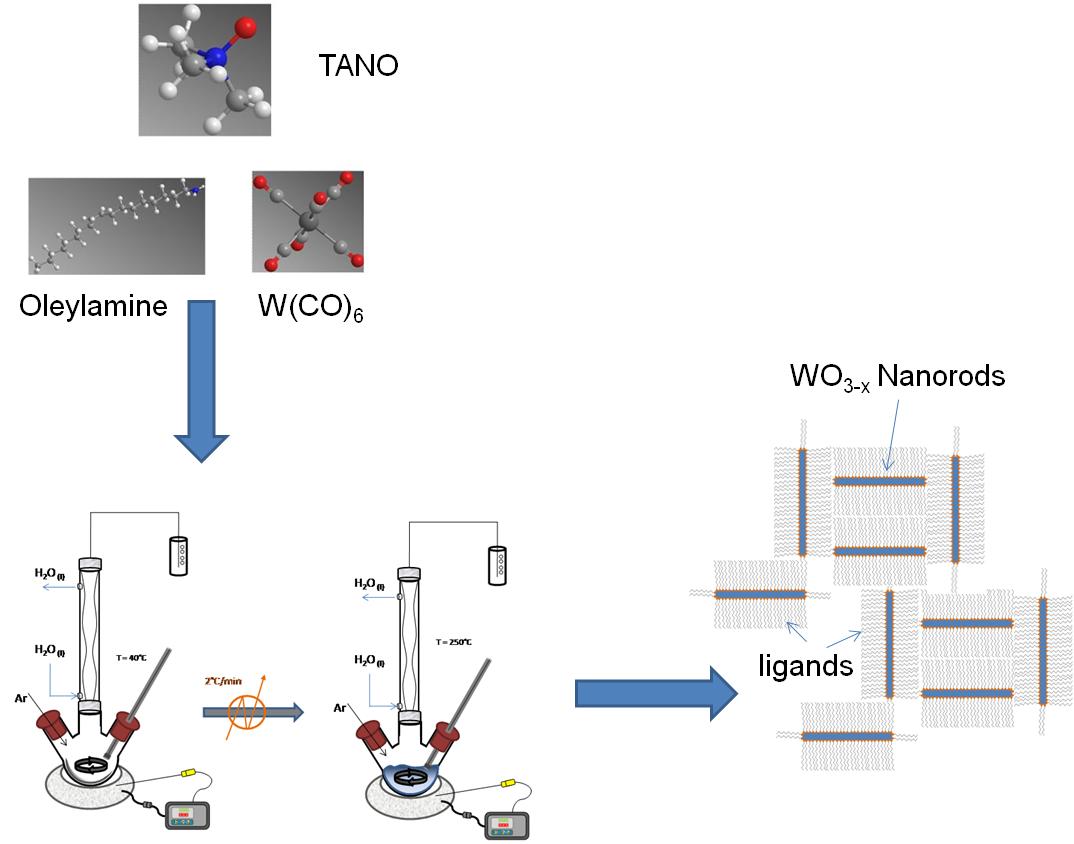
Multiple color variations were observed between 100 - 250 °C with the final product having a dark blue color. Tungsten oxide nanorods (W18O49 identified by XRD) with a diameter of 7±2 nm and 50±2 nm long were acquired after centrifugation of the product solution. A TEM image of the W18O49 nanorods is shown in Figure \(\PageIndex{10}\).

Thermogravimetric Analysis (TGA)/Differential Scanning Calorimetry (DSC)
Thermogravimetric analysis (TGA) is a technique widely used for determining the organic and inorganic content of various materials. Its basic rule of function is the high precision measurement of weight gain/loss with increasing temperature under inert or reactive atmospheres. Each weight change corresponds to physical (crystallization, phase transformation) or chemical (oxidation, reduction, reaction) processes that take place by increasing the temperature. The sample is placed into platinum or alumina pan and along with an empty or standard pan are placed onto two high precision balances inside a high temperature oven. A method for pretreating the samples is selected and the procedure is initiated. Differential scanning calorimetry (DSC) is a technique usually accompanying TGA and is used for calculating enthalpy energy changes or heat capacity changes associated with phase transitions and/or ligand-binding energy cleavage.
In Figure \(\PageIndex{11}\) the TGA/DSC plot acquired for the ligand decomposition of WO3-x nanorods is presented. The sample was heated at constant rate under N2 atmosphere up to 195 °C for removing moisture and then up to 700 °C for removing the oleylamine ligands. It is important to use an inert gas for performing such a study to avoid any premature oxidation and/or capping agent combustion. 26.5% of the weight loss is due to oleylamine evaporations which means about 0.004 moles per gram of sample. After isothermal heating at 700 °C for 25 min the flow was switched to air for oxidizing the ligand-free WO3-x to WO3. From the DSC curve we noticed the following changes of the weight corrected heat flow:
- From 0 – 10 min assigned to water evaporation.
- From 65 – 75 min assigned to OA evaporation.
- From 155 – 164 min assigned to WO3-x oxidation.
- From 168 – 175 min is also due to further oxidation of W5+ atoms.
The heat flow increase during the WO3-x to WO3 oxidation is proportional to the crystal phase defects (or W atoms of oxidation state +5) and can be used for performing qualitative studies between different WOx nanoparticles.
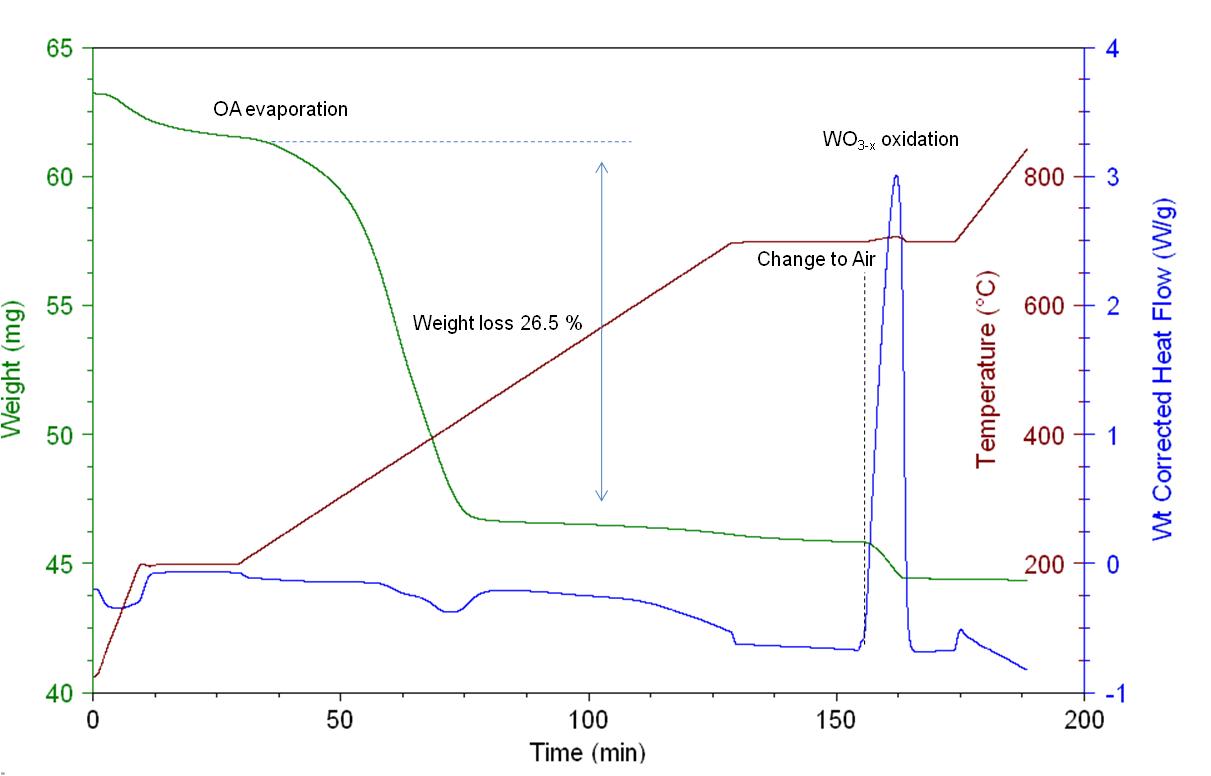
The detailed information about the procedure used to acquire the TGA/DSC plot shown in Figure \(\PageIndex{11}\) is as follows.
- Select gas (N2 with flow rate 50 mL/min.)
- Ramp 20 °C/min to 200 °C.
- Isothermal for 20 min.
- Ramp 5 °C/min to 700 °C.
- Isothermal for 25 min.
- Select gas (air).
- Isothermal for 20 min.
- Ramp 10 °C/min to 850 °C.
- Cool down
Fourier Transform Infrared Spectroscopy
Fourier transform infrared spectroscopy (FTIR) is the most popular spectroscopic method used for characterizing organic and inorganic compounds. The basic modification of an FTIR from a regular IR instrument is a device called interferometer, which generates a signal that allows very fast IR spectrum acquisition. For doing so, the generatated interferogram has to be “expanded” using a Fourier transformation to generate a complete IR frequency spectrum. In the case of performing FTIR transmission studies the intensity of the transmitted signal is measured and the IR fingerprint is generated \ref{2} .
\[T = \frac{I}{L} = e^{c \varepsilon l} \label{2} \]
Where I is the intensity of the samples, Ib is the intensity of the background, c is the concentration of the compound, ε is the molar extinction coefficient and l is the distance that light travels through the material. A transformation of transmission to absorption spectra is usually performed and the actual concentration of the component can be calculated by applying the Beer-Lambert law \ref{3}
\[A = -ln(T) = c \varepsilon l \label{3} \]
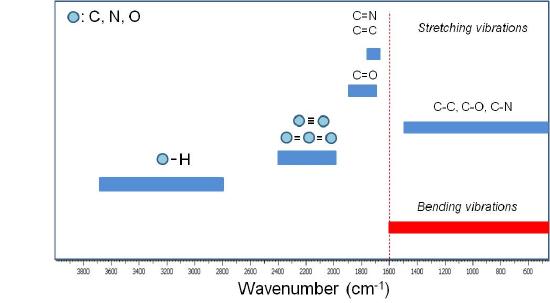
A qualitative IR-band map is presented in Figure \(\PageIndex{12}\).
The absorption bands between 4000 to 1600 cm-1 represent the group frequency region and are used to identify the stretching vibrations of different bonds. At lower frequencies (from 1600 to 400 cm-1) vibrations due to intermolecular bond bending occurs upon IR excitation and therefore are usually not taken into account.
TGA/DSC-FTIR Characterization
TGA/DSC is a powerful tool for identifying the different compounds evolved during the controlled pyrolysis and therefore provide qualitative and quantitative information about the volatile components of the sample. In metal oxide nanoparticle synthesis TGA/DSC-FTIR studies can provide qualitative and quantitative information about the volatile compounds of the nanoparticles.
TGA–FTIR results presented below were acquired using a Q600 Simultaneous TGA/DSC (SDT) instrument online with a Nicolet 5700 FTIR spectrometer. This system has a digital mass flow control and two gas inlets giving the capability to switch reacting gas during each run. It allows simultaneous weight change and differential heat flow measurements up to 1500 °C, while at the same time the outflow line is connected to the FTIR for performing gas phase compound identification. Grand-Schmidt thermographs were usually constructed to present the species evolution with time in 3 dimensions.
Selected IR spectra are presented in Figure \(\PageIndex{13}\). Four regions with intense peaks are observed. Between 4000 – 3550 cm-1 due to O-H bond stretching assigned to H2O that is always present and due to due to N-H group stretching that is assigned to the amine group of oleylamine. Between 2400 – 2250 cm-1 due to O=C=O stretching, between 1900 – 1400 cm-1 which is mainly to C=O stretching and between 800 – 400 cm-1 cannot be resolved as explained previously.
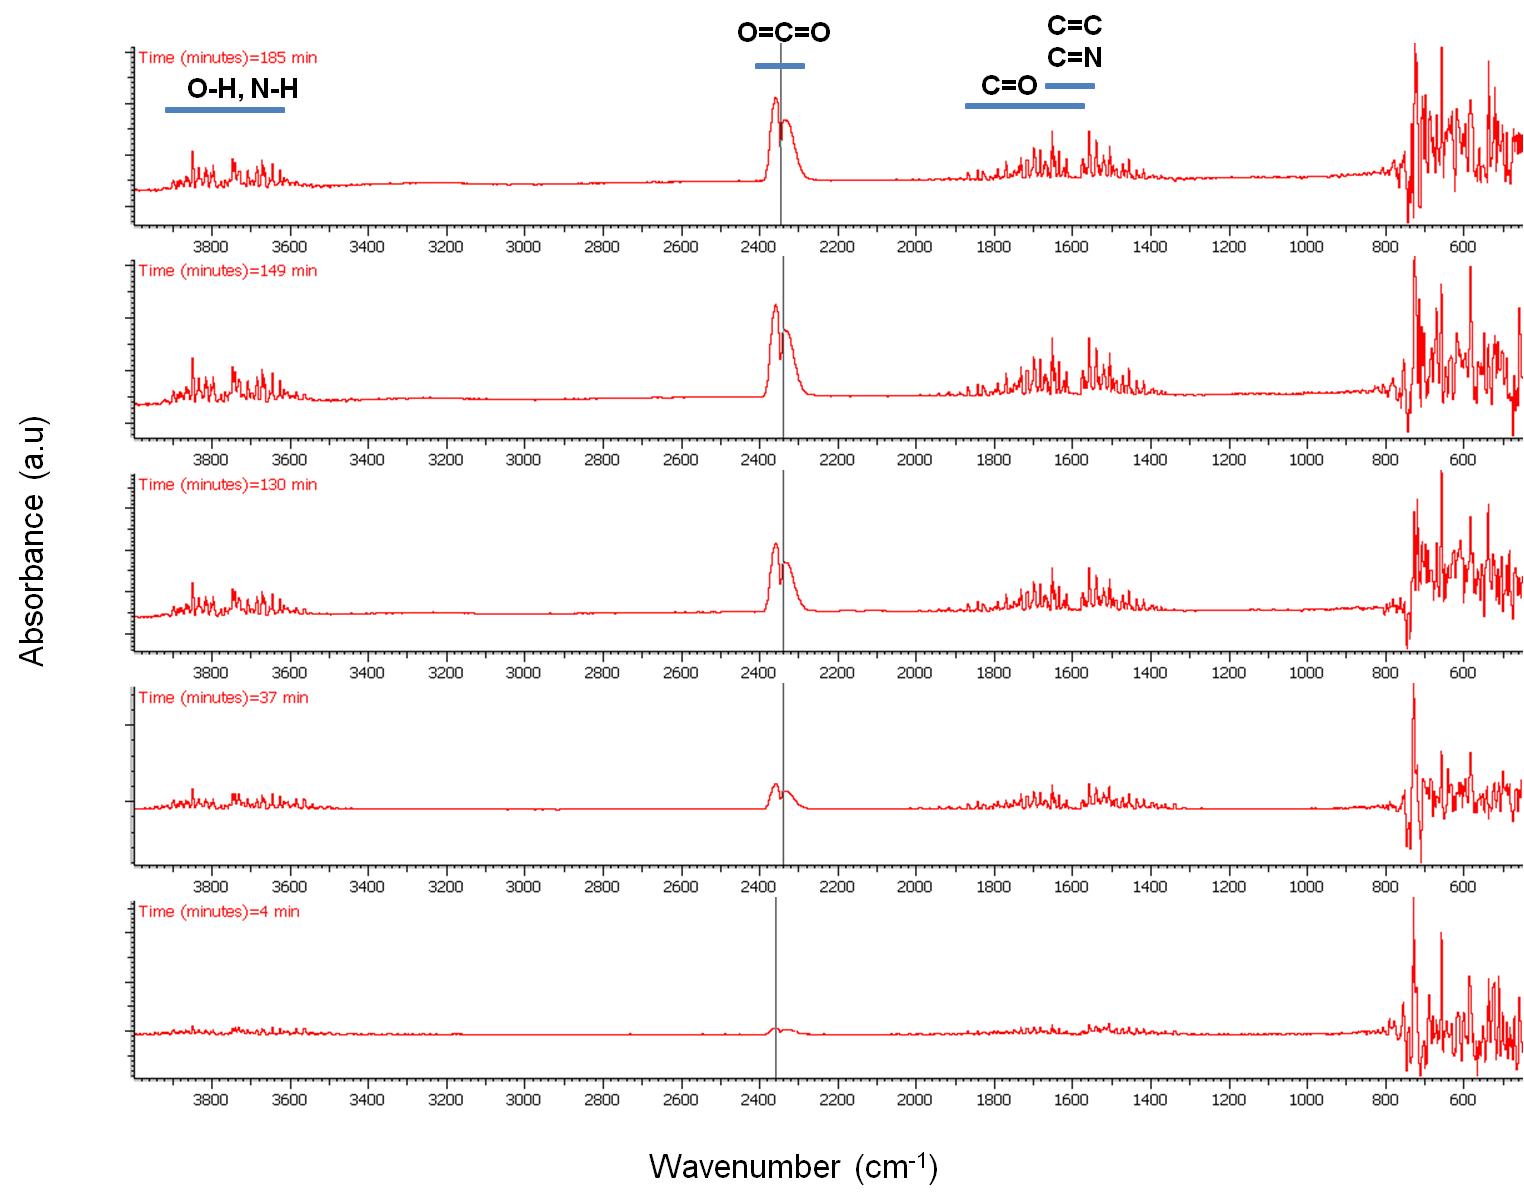
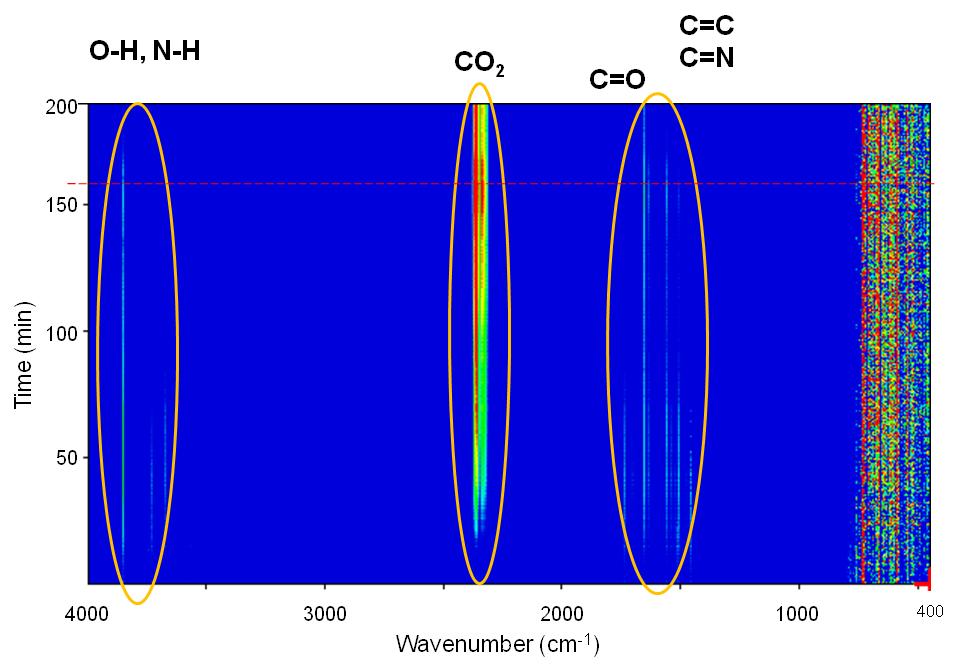
The peak intensity evolution with time can be more easily observed in Figure \(\PageIndex{14}\) and Figure \(\PageIndex{15}\). As seen, CO2 evolution increases significantly with time especially after switching our flow from N2 to air. H2O seems to be present in the outflow stream up to 700 °C while the majority of the N-H amine peaks seem to disappear at about 75 min. C=N compounds are not expected to be present in the stream which leaves bands between 1900 – 1400 cm-1 assigned to C=C and C=O stretching vibrations. Unsaturated olefins resulting from the cracking of the oleylamine molecule are possible at elevated temperatures as well as the presence of CO especially under N2atmosphere.

From the above compound identification we can summarize and propose the following applications for TGA-FTIR. First, more complex ligands, containing aromatic rings and maybe other functional groups may provide more insight in the ligand to MOx interaction. Second, the presence of CO and CO2 even under N2 flow means that complete O2 removal from the TGA and the FTIR cannot be achieved under these conditions. Even though the system was equilibrated for more than an hour, traces of O2 are existent which create errors in our calculations.
Determination of Sublimation Enthalpy and Vapor Pressure for Inorganic and Metal-Organic Compounds by Thermogravimetric Analysis
Metal compounds and complexes are invaluable precursors for the chemical vapor deposition (CVD) of metal and non-metal thin films. In general, the precursor compounds are chosen on the basis of their relative volatility and their ability to decompose to the desired material under a suitable temperature regime. Unfortunately, many readily obtainable (commercially available) compounds are not of sufficient volatility to make them suitable for CVD applications. Thus, a prediction of the volatility of a metal-organic compounds as a function of its ligand identity and molecular structure would be desirable in order to determine the suitability of such compounds as CVD precursors. Equally important would be a method to determine the vapor pressure of a potential CVD precursor as well as its optimum temperature of sublimation.
It has been observed that for organic compounds it was determined that a rough proportionality exists between a compound’s melting point and sublimation enthalpy; however, significant deviation is observed for inorganic compounds.
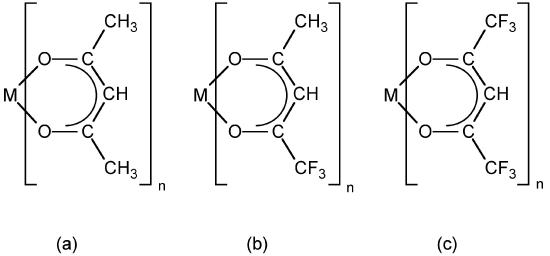
Enthalpies of sublimation for metal-organic compounds have been previously determined through a variety of methods, most commonly from vapor pressure measurements using complex experimental systems such as Knudsen effusion, temperature drop microcalorimetry and, more recently, differential scanning calorimetry (DSC). However, the measured values are highly dependent on the experimental procedure utilized. For example, the reported sublimation enthalpy of Al(acac)3 (Figure \(\PageIndex{16}\) a where M = Al, n = 3) varies from 47.3 to 126kJ/mol.
Thermogravimetric analysis offers a simple and reproducible method for the determination of the vapor pressure of a potential CVD precursor as well as its enthalpy of sublimation.
Determination of Sublimation Enthalpy
The enthalpy of sublimation is a quantitative measure of the volatility of a particular solid. This information is useful when considering the feasibility of a particular precursor for CVD applications. An ideal sublimation process involves no compound decomposition and only results in a solid-gas phase change, i.e., \ref{4}
\[ [M(L)_{n}I]_{ (solid) } \rightarrow [M(L_{n})]_{ (vapor) } \label{4} \]
Since phase changes are thermodynamic processes following zero-order kinetics, the evaporation rate or rate of mass loss by sublimation (msub), at a constant temperature (T), is constant at a given temperature, \ref{5} . Therefore, the msub values may be directly determined from the linear mass loss of the TGA data in isothermal regions.
\[ m_{sub} \ =\ \frac{\Delta [mass]}{\Delta t} \label{5} \]
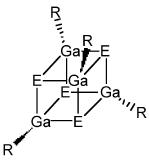
The thermogravimetric and differential thermal analysis of the compound under study is performed to determine the temperature of sublimation and thermal events such as melting. Figure \(\PageIndex{17}\) shows a typical TG/DTA plot for a gallium chalcogenide cubane compound (Figure \(\PageIndex{18}\) ).
![A typical thermogravimetric/differential thermal analysis (TG/DTA) analysis of [(EtMe2C)GaSe]4](https://chem.libretexts.org/@api/deki/files/418475/graphics4_a744.jpg?revision=1&size=bestfit&width=400&height=291)
Data Collection
In a typical experiment 5 - 10 mg of sample is used with a heating rate of ca. 5 °C/min up to under either a 200-300 mL/min inert (N2 or Ar) gas flow or a dynamic vacuum (ca. 0.2 Torr if using a typical vacuum pump). The argon flow rate was set to 90.0 mL/min and was carefully monitored to ensure a steady flow rate during runs and an identical flow rate from one set of data to the next.
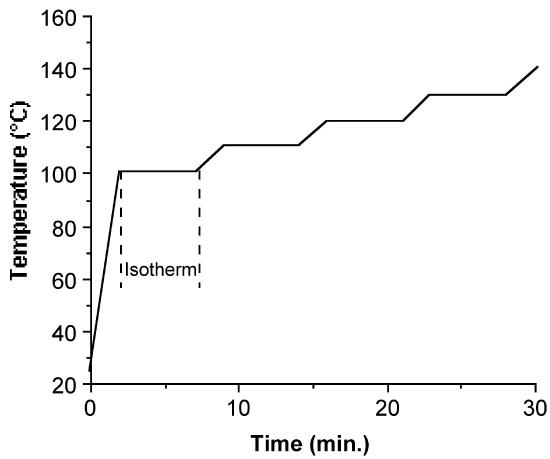
Once the temperature range is defined, the TGA is run with a preprogrammed temperature profile (Figure \(\PageIndex{19}\) ). It has been found that sufficient data can be obtained if each isothermal mass loss is monitored over a period (between 7 and 10 minutes is found to be sufficient) before moving to the next temperature plateau. In all cases it is important to confirm that the mass loss at a given temperature is linear. If it is not, this can be due to either (a) temperature stabilization had not occurred and so longer times should be spent at each isotherm, or (b) decomposition is occurring along with sublimation, and lower temperature ranges must be used. The slope of each mass drop is measured and used to calculate sublimation enthalpies as discussed below.
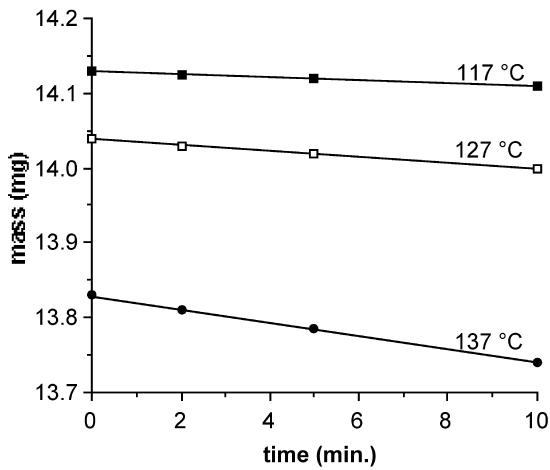
As an illustrative example, Figure \(\PageIndex{20}\) displays the data for the mass loss of Cr(acac)3 (Figure \(\PageIndex{16}\) a, where M = Cr, n = 3 ) at three isothermal regions under a constant argon flow. Each isothermal data set should exhibit a linear relation. As expected for an endothermal phase change, the linear slope, equal to msub, increases with increasing temperature.
Samples of iron acetylacetonate (Figure \(\PageIndex{16}\) a, where M = Fe, n = 3) may be used as a calibration standard through ΔHsub determinations before each day of use. If the measured value of the sublimation enthalpy for Fe(acac)3 is found to differ from the literature value by more than 5%, the sample is re-analyzed and the flow rates are optimized until an appropriate value is obtained. Only after such a calibration is optimized should other complexes be analyzed. It is important to note that while small amounts (< 10%) of involatile impurities will not interfere with the ΔHsub analysis, competitively volatile impurities will produce higher apparent sublimation rates.
It is important to discuss at this point the various factors that must be controlled in order to obtain meaningful (useful) msub data from TGA data.
- The sublimation rate is independent of the amount of material used but may exhibit some dependence on the flow rate of an inert carrier gas, since this will affect the equilibrium concentration of the cubane in the vapor phase. While little variation was observed we decided that for consistency msub values should be derived from vacuum experiments only.
- The surface area of the solid in a given experiment should remain approximately constant; otherwise the sublimation rate (i.e., mass/time) at different temperatures cannot be compared, since as the relative surface area of a given crystallite decreases during the experiment the apparent sublimation rate will also decrease. To minimize this problem, data was taken over a small temperature ranges (ca. 30 °C), and overall sublimation was kept low (ca. 25% mass loss representing a surface area change of less than 15%). In experiments where significant surface area changes occurred the values of msub deviated significantly from linearity on a log(msub) versus 1/T plot.
- The compound being analyzed must not decompose to any significant degree, because the mass changes due to decomposition will cause a reduction in the apparent msub value, producing erroneous results. With a simultaneous TG/DTA system it is possible to observe exothermic events if decomposition occurs, however the clearest indication is shown by the mass loss versus time curves which are no longer linear but exhibit exponential decays characteristic of first or second order decomposition processes.
Data Analysis
The basis of analyzing isothermal TGA data involves using the Clausius-Clapeyron relation between vapor pressure (p) and temperature (T), \ref{6} , where ∆Hsub is the enthalpy of sublimation and R is the gas constant (8.314 J/K.mol).
\[ \frac{d\ ln(p)}{dT}\ =\ \frac{\Delta H_{sub} }{RT^{2} } \label{6} \]
Since msub data are obtained from TGA data, it is necessary to utilize the Langmuir equation, \ref{7} , that relates the vapor pressure of a solid with its sublimation rate.
\[ p\ =\ [\frac{2\pi RT}{M_{W} }]^{0.5} m_{sub} \label{7} \]
After integrating \ref{6} in log form, substituting \ref{7} , and consolidating, one one obtains the useful equality, \ref{8} .
\[log(m_{sub} \sqrt{T} ) = \frac{-0.0522(\Delta H_{sub} )}{T} + [ \frac{0.0522(\Delta H_{sub} )}{T} - \frac{1}{2} log(\frac{1306}{M_{W} } ) ] \label{8} \]
Hence, the linear slope of a log(msubT1/2) versus 1/T plot yields ΔHsub. An example of a typical plot and the corresponding ΔHsub value is shown in Figure \(\PageIndex{21}\). In addition, the y intercept of such a plot provides a value for Tsub, the calculated sublimation temperature at atmospheric pressure.
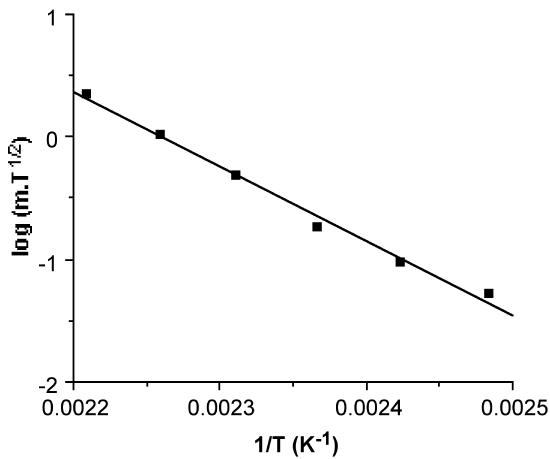
Table \(\PageIndex{3}\) lists the typical results using the TGA method for a variety of metal β-diketonates, while Table \(\PageIndex{4}\) lists similar values obtained for gallium chalcogenide cubane compounds.
| Compound | ΔHsub (kJ/mol) | ΔSsub (J/K.mol) | Tsub calc. (°C) | Calculated vapor pressure @ 150 °C (Torr) |
| Al(acac)3 | 93 | 220 | 150 | 3.261 |
| Al(tfac)3 | 74 | 192 | 111 | 9.715 |
| Al(hfac)3 | 52 | 152 | 70 | 29.120 |
| Cr(acac)3 | 91 | 216 | 148 | 3.328 |
| Cr(tfac)3 | 71 | 186 | 109 | 9.910 |
| Cr(hfac)3 | 46 | 134 | 69 | 29.511 |
| Fe(acac)3 | 112 | 259 | 161 | 2.781 |
| Fe(tfac)3 | 96 | 243 | 121 | 8.340 |
| Fe(hfac)3 | 60 | 169 | 81 | 25.021 |
| Co(acac)3 | 138 | 311 | 170 | 1.059 |
| Co(tfac)3 | 119 | 295 | 131 | 3.319 |
| Co(hfac)3 | 73 | 200 | 90 | 9.132 |
| Compound | ∆Hsub (kJ/mol) | ∆Ssub (J/K. mol) | Tsub calc. (°C) | Calculated vapor pressure @ 150 °C (Torr) |
| [(Me3C)GaS]4 | 110 | 300 | 94 | 22.75 |
| [(EtMe2C)GaS]4 | 124 | 330 | 102 | 18.89 |
| [(Et2MeC)GaS]4 | 137 | 339 | 131 | 1.173 |
| [(Et3C)GaS]4 | 149 | 333 | 175 | 0.018 |
| [(Me3C)GaSe)]4 | 119 | 305 | 116 | 3.668 |
| [(EtMe2C)GaSe]4 | 137 | 344 | 124 | 2.562 |
| [(Et2MeC)GaSe]4 | 147 | 359 | 136 | 0.815 |
| [(Et3C)GaSe]4 | 156 | 339 | 189 | 0.005 |
A common method used to enhance precursor volatility and corresponding efficacy for CVD applications is to incorporate partially (Figure \(\PageIndex{16}\) b ) or fully (Figure \(\PageIndex{16}\) c) fluorinated ligands. As may be seen from Table \(\PageIndex{3}\) this substitution does results in significant decrease in the ΔHsub, and thus increased volatility. The observed enhancement in volatility may be rationalized either by an increased amount of intermolecular repulsion due to the additional lone pairs or that the reduced polarizability of fluorine (relative to hydrogen) causes fluorinated ligands to have less intermolecular attractive interactions.
Determination of Sublimation Entropy
The entropy of sublimation is readily calculated from the ΔHsub and the calculated Tsub data, \ref{9}
\[ \Delta S_{sub} \ =\ \frac{ \Delta H_{sub} }{ T_{sub} } \label{9} \]
Table \(\PageIndex{3}\) and Table \(\PageIndex{4}\) show typical values for metal β-diketonate compounds and gallium chalcogenide cubane compounds, respectively. The range observed for gallium chalcogenide cubane compounds (ΔSsub = 330 ±20 J/K.mol) is slightly larger than values reported for the metal β-diketonates compounds (ΔSsub = 130 - 330 J/K.mol) and organic compounds (100 - 200 J/K.mol), as would be expected for a transformation giving translational and internal degrees of freedom. For any particular chalcogenide, i.e., [(R)GaS]4, the lowest ΔSsubare observed for the Me3C derivatives, and the largest ΔSsub for the Et2MeC derivatives, see Table \(\PageIndex{4}\). This is in line with the relative increase in the modes of freedom for the alkyl groups in the absence of crystal packing forces.
Determination of Vapor Pressure
While the sublimation temperature is an important parameter to determine the suitability of a potential precursor compounds for CVD, it is often preferable to express a compound's volatility in terms of its vapor pressure. However, while it is relatively straightforward to determine the vapor pressure of a liquid or gas, measurements of solids are difficult (e.g., use of the isoteniscopic method) and few laboratories are equipped to perform such experiments. Given that TGA apparatus are increasingly accessible, it would therefore be desirable to have a simple method for vapor pressure determination that can be accomplished on a TGA.
Substitution of \ref{5} into \ref{8} allows for the calculation of the vapor pressure (p) as a function of temperature (T). For example, Figure \(\PageIndex{22}\) shows the calculated temperature dependence of the vapor pressure for [(Me3C)GaS]4. The calculated vapor pressures at 150 °C for metal β-diketonates compounds and gallium chalcogenide cubane compounds are given in Table \(\PageIndex{3}\) and Table \(\PageIndex{4}\)
![A plot of calculated vapor pressure (Torr) against temperature (K) for [(Me3C)GaS]4.](https://chem.libretexts.org/@api/deki/files/418486/graphics13.jpg?revision=1&size=bestfit&width=400&height=335)
The TGA approach to show reasonable agreement with previous measurements. For example, while the value calculated for Fe(acac)3(2.78 Torr @ 113 °C) is slightly higher than that measured directly by the isoteniscopic method (0.53 Torr @ 113 °C); however, it should be noted that measurements using the sublimation bulb method obtained values much lower (8 x 10⁻³ Torr @ 113 °C). The TGA method offers a suitable alternative to conventional (direct) measurements of vapor pressure.
Differential Scanning Calorimetry (DSC)
Differential scanning calorimetry (DSC) is a technique used to measure the difference in the heat flow rate of a sample and a reference over a controlled temperature range. These measurements are used to create phase diagrams and gather thermoanalytical information such as transition temperatures and enthalpies.
History
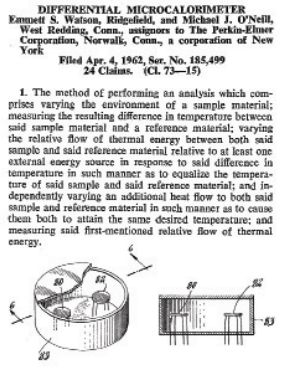
DSC was developed in 1962 by Perkin-Elmer employees Emmett Watson and Michael O’Neill and was introduced at the Pittsburgh Conference on Analytical Chemistry and Applied Spectroscopy. The equipment for this technique was available to purchase beginning in 1963 and has evolved to control temperatures more accurately and take measurements more precisely, ensuring repeatability and high sensitivity.
Theory
Phase Transitions
Phase transitions refer to the transformation from one state of matter to another. Solids, liquids, and gasses are changed to other states as the thermodynamic system is altered, thereby affecting the sample and its properties. Measuring these transitions and determining the properties of the sample is important in many industrial settings and can be used to ensure purity and determine composition (such as with polymer ratios). Phase diagrams (Figure \(\PageIndex{23}\) ) can be used to clearly demonstrate the transitions in graphical form, helping visualize the transition points and different states as the thermodynamic system is changed.

Differential Thermal Analysis
Prior to DSC, differential thermal analysis (DTA) was used to gather information about transition states of materials. In DTA, the sample and reference are heated simultaneously with the same amount of heat and the temperature of each is monitored independently. The difference between the sample temperature and the reference temperature gives information about the exothermic or endothermic transition occurring in the sample. This strategy was used as the foundation for DSC, which sought to measure the difference in energy needed to keep the temperatures the same instead of measure the difference in temperature from the same amount of energy.
Differntial Scanning Calorimeter
Instead of measuring temperature changes as heat is applied as in DTA, DSC measures the amount of heat that is needed to increase the temperatures of the sample and reference across a temperature gradient. The sample and reference are kept at the same temperature as it changes across the gradient, and the differing amounts of heat required to keep the temperatures synchronized are measured. As the sample undergoes phase transitions, more or less heat is needed, which allows for phase diagrams to be created from the data. Additionally, specific heat, glass transition temperature, crystallization temperature, melting temperature, and oxidative/thermal stability, among other properties, can be measured using DSC.
Applications
DSC is often used in industrial manufacturing, ensuring sample purity and confirming compositional analysis. Also used in materials research, providing information about properties and composition of unknown materials can be determined. DSC has also been used in the food and pharmaceutical industries, providing characterization and enabling the fine-tuning of certain properties. The stability of proteins and folding/unfolding information can also be measured with DSC experiments.
Instrumentation
Equipment
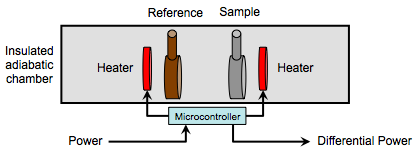
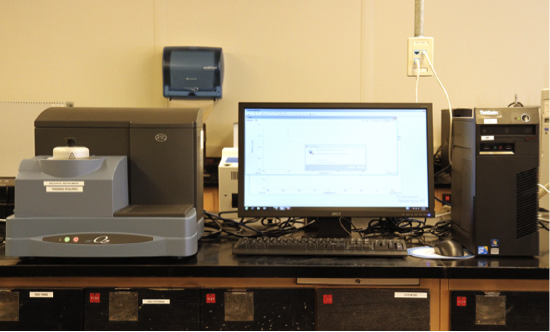
The sample and reference cells (also known as pans), each enclosing their respective materials, are contained in an insulted adiabatic chamber (Figure \(\PageIndex{25}\) ). The cells can be made of a variety of materials, such as aluminum, copper, gold and platinum. The choice of which is dictated by the necessary upper temperature limit. A variable heating element around each cell transfers heat to the sample, causing both cells’ temperature to rise in coordination with the other cell. A temperature monitor measures the temperatures of each cell and a microcontroller controls the variable heating elements and reports the differential power required for heating the sample versus the reference. A typical setup, including a computer for controlling software, is shown in Figure \(\PageIndex{26}\).
Modes of Operations
With advancement in DSC equipment, several different modes of operations now exist that enhance the applications of DSC. Scanning mode typically refers to conventional DSC, which uses a linear increase or decrease in temperature. An example of an additional mode often found in newer DSC equipment is an isothermal scan mode, which keeps temperature constant while the differential power is measured. This allows for stability studies at constant temperatures, particularly useful in shelf life studies for pharmaceutical drugs.
Calibration
As with practically all laboratory equipment, calibration is required. Calibration substances, typically pure metals such as indium or lead, are chosen that have clearly defined transition states to ensure that the measured transitions correlate to the literature values.
Obtaining Measurements
Sample Preparation
Sample preparation mostly consists of determining the optimal weight to analyze. There needs to be enough of the sample to accurately represent the material, but the change in heat flow should typically be between 0.1 - 10 mW. The sample should be kept as thin as possible and cover as much of the base of the cell as possible. It is typically better to cut a slice of the sample rather than crush it into a thin layer. The correct reference material also needs to be determined in order to obtain useful data.
DSC Curves
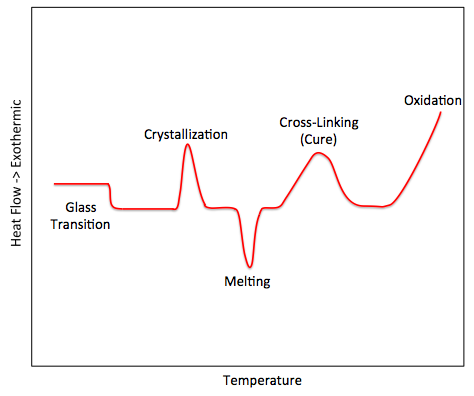
DSC curves (e.g., Figure \(\PageIndex{27}\) ) typically consist of heat flow plotted versus the temperature. These curves can be used to calculate the enthalpies of transitions, (ΔH), \ref{10} , by integrating the peak of the state transition, where K is the calorimetric constant and A is the area under the curve.
\[ \Delta H \ =\ KA \label{10} \]
Sources of error
Common error sources apply, including user and balance errors and improper calibration. Incorrect choice of reference material and improper quantity of sample are frequent errors. Additionally, contamination and how the sample is loaded into the cell affect the DSC.
DSC Characterization of Polymers
Differential scanning calorimetry (DSC), at the most fundamental level, is a thermal analysis technique used to track changes in the heat capacity of some substance. To identify this change in heat capacity, DSC measures heat flow as a function of temperature and time within a controlled atmosphere. The measurements provide a quantitative and qualitative look into the physical and chemical alterations of a substance related to endothermic or exothermic events.
The discussion done here will be focused on the analysis of polymers; therefore, it is important to have an understanding of polymeric properties and how heat capacity is measured within a polymer.
Overview of Polymeric Properties
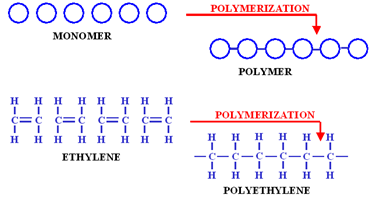
A polymer is, essentially, a chemical compound whose molecular structure is a composition of many monomer units bonded together (Figure \(\PageIndex{28}\) ). The physical properties of a polymer and, in turn, its thermal properties are determined by this very ordered arrangement of the various monomer units that compose a polymer. The ability to correctly and effectively interpret differential scanning calorimetry data for any one polymer stems from an understanding of a polymer’s composition. As such, some of the more essential dynamics of polymers and their structures are briefly addressed below.
An aspect of the ordered arrangement of a polymer is its degree of polymerization, or, more simply, the number of repeating units within a polymer chain. This degree of polymerization plays a role in determining the molecular weight of the polymer. The molecular weight of the polymer, in turn, plays a role in determining various thermal properties of the polymer such as the perceived melting temperature.
Related to the degree of polymerization is a polymer’s dispersity, i.e. the uniformity of size among the particles that compose a polymer. The more uniform a series of molecules, the more monodisperse the polymer; however, the more non-uniform a series of molecules, the more polydisperse the polymer. Increases in initial transition temperatures follow an increase in polydispersity. This increase is due to higher intermolecular forces and polymer flexibility in comparison to more uniform molecules.
In continuation with the study of a polymer’s overall composition is the presence of cross-linking between chains. The ability for rotational motion within a polymer decreases as more chains become cross-linked, meaning initial transition temperatures will increase due to a greater level of energy needed to overcome this restriction. In turn, if a polymer is composed of stiff functional groups, such as carbonyl groups, the flexibility of the polymer will drastically decrease, leading to higher transitional temperatures as more energy will be required to break these bonds. The same is true if the backbone of a polymer is composed of stiff molecules, like aromatic rings, as this also causes the flexibility of the polymer to decrease. However, if the backbone or internal structure of the polymer is composed of flexible groups, such as aliphatic chains, then either the packing or flexibility of the polymer decreases. Thus, transitional temperatures will be lower as less energy is needed to break apart these more flexible polymers.
Lastly, the actual bond structure (i.e. single, double, triple) and chemical properties of the monomer units will affect the transitional temperatures. For examples, molecules more predisposed towards strong intermolecular forces, such as molecules with greater dipole to dipole interactions, will result in the need for higher transitional temperatures to provide enough energy to break these interactions.
In terms of the relationship between heat capacity and polymers: heat capacity is understood to be the amount of energy a unit or system can hold before its temperature raises one degree; further, in all polymers, there is an increase in heat capacity with an increase in temperature. This is due to the fact that as polymers are heated, the molecules of the polymer undergo greater levels of rotation and vibration which, in turn, contribute to an increase in the internal energy of the system and thus an increase in the heat capcity of the polymer.
In knowing the composition of a polymer, it becomes easier to not only pre-emptively hypothesize the results of any DSC analysis but also troubleshoot why DSC data does not seem to corroborate with the apparent properties of a polymer.
Note, too, that there are many variations in DSC techniques and types as they relate to characterization of polymers. These differences are discussed below.
Standard DSC (Heat Flux DSC)
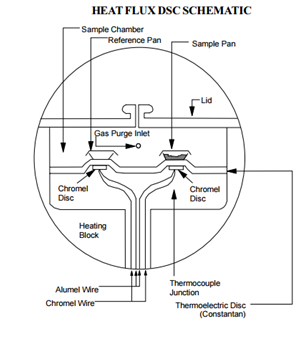
The composition of a prototypical, unmodified DSC includes two pans. One is an empty reference plate and the other contains the polymer sample. Within the DSC system is also a thermoelectric disk. Calorimetric measurements are then taken by heating both the sample and empty reference plate at a controlled rate, say 10 °C/min, through the thermoelectric disk. A purge gas is admitted through an orifice in the system, which is preheated by circulation through a heating block before entering the system. Thermocouples within the thermoelectric disk then register the temperature difference between the two plates. Once a temperature difference between the two plates is measured, the DSC system will alter the applied heat to one of the pans so as to keep the temperature between the two pans constant. In Figure \(\PageIndex{29}\) is a cross-section of a common heat flux DSC instrument.
The resulting plot that is one in which the heat flow is understood to be a function of temperature and time. As such, the slope at any given point is proportional to the heat capacity of the sample. The plot as a whole, however, is reperesentative of thermal events within the polymer. The orientation of peaks or stepwise movements within the plot, therefore, lend themselves to interpretation as thermal events.
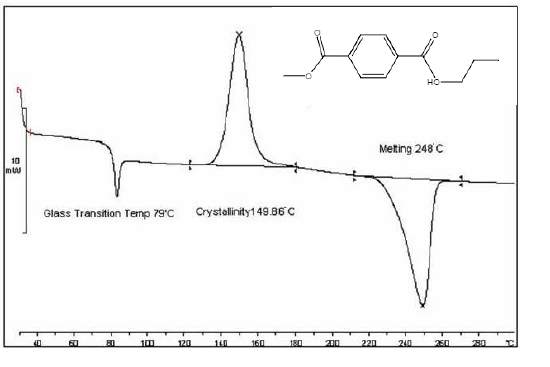
To interpret these events, it is important to define the thermodynamic system of the DSC instrument. For most heat flux systems, the thermodynamic system is understood to be only the sample. This means that when, for example, an exothermic event occurs, heat from the polymer is released to the outside environment and a positive change is measured on the plot. As such, all exothermic events will be positive shifts within the plot while all endothermic events will be negative shifts within the plot. However, this can be flipped within the DSC system, so be sure to pay attention to the orientation of your plot as “exo up” or “exo down.” See Figure \(\PageIndex{30}\) for an example of a standard DSC plot of polymer poly(ethylene terephthalate) (PET). By understanding this relationship within the DSC system, the ability to interpret thermal events, such as the ones described below, becomes all the more approachable.
Heat Capacity (Cp)
As previously stated, a typical plot created via DSC will be a measure of heat flow vs temperature. If the polymer undergoes no thermal processes, the plot of heat flow vs temperature will be zero slope. If this is the case, then the heat capacity of the polymer is proportional to the distance between the zero-slopped line and the x-axis. However, in most instances, the heat capacity is measured to be the slope of the resulting heat flow vs temperature plot. Note that any thermal alteration to a polymer will result in a change in the polymer’s heat capacity; therefore, all DSC plots with a non-zero slope indicate some thermal event must have occurred.
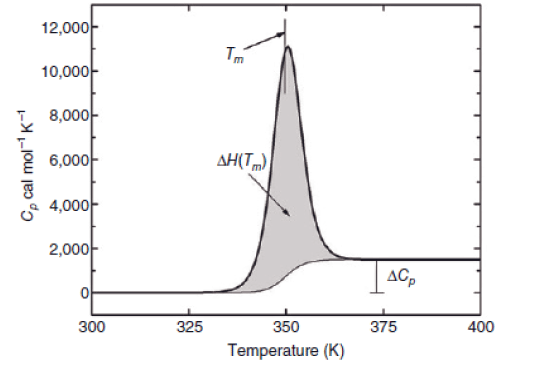
However, it is also possible to directly measure the heat capacity of a polymer as it undergoes some phase change. To do so, a heat capacity vs temperature plot is to be created. In doing so it becomes easier to zero in on and analyze a weak thermal event in a reproducible manner. To measure heat capacity as a function of increasing temperature, it is necessary to divide all values of a standard DSC plot by the measured heating rate.
For example, say a polymer has undergone a subtle thermal event at a relatively low temperature. To confirm a thermal event is occurring, zero in on the temperature range the event was measured to have occurred at and create a heat capacity vs temperature plot. The thermal event becomes immediately identifiable by the presence of a change in the polymer’s heat capacity as shown in Figure \(\PageIndex{31}\).
Glass Transition Temperature (Tg)
As a polymer is continually heated within the DSC system, it may reach the glass transition: a temperature range under which a polymer can undergo a reversible transition between a brittle or viscous state. The temperature at which this reversible transition can occur is understood to be the glass transition temperature (Tg); however, make note that the transition does not occur suddenly at one temperature but, instead, transitions slowly across a range of temperatures.
Once a polymer is heated to the glass transition temperature, it will enter a molten state. Upon cooling the polymer, it loses its elastic properties and instead becomes brittle, like glass, due to a decrease in chain mobility. Should the polymer continue to be heated above the glass transition temperature, it will become soft due to increased heat energy inducing different forms of transitional and segmental motion within the polymer, promoting chain mobility. This allows the polymer to be deformed or molded without breaking.
Upon reaching the glass transition range, the heat capacity of the polymer will change, typically become higher. In turn, this will produce a change in the DSC plot. The system will begin heating the sample pan at a different rate than the reference pan to accommodate this change in the polymer’s heat capacity. Figure \(\PageIndex{32}\) is an example of the glass transition as measured by DSC. The glass transition has been highlighted, and the glass transition temperature is understood to be the mid-point of the transitional range.
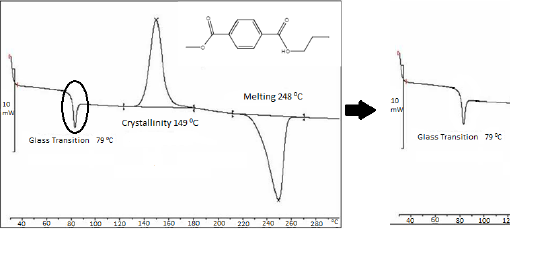
While the DSC instrument will capture a glass transition, the glass transition temperature cannot, in actuality, be exactly defined with a standard DSC. The glass transition is a property that is completely dependent on the extent that the polymer is heated or cooled. As such, the glass transition is dependent on the applied heating or cooling rate of the DSC system. Therefore, the glass transition of the same polymer can have different values when measured on separate occasions. For example, if the applied cooling rate is lower during a second trial, then the measured glass transition temperature will also be lower.
However, in having a general knowledge of the glass transition temperature, it becomes possible to hypothesize the polymers chain length and structure. For example, the chain length of a polymer will affect the number of Van der Waal or entangling chain interactions that occur. These interactions will in turn determine just how resistant the polymer is to increasing heat. Therefore, the temperature at which Tg occurs is correlated to the magnitude of chain interactions. In turn, if the glass transition of a polymer is consistently shown to occur quickly at lower temperatures, it may be possible to infer that the polymer has flexible functional groups that promote chain mobility.
Crystallization (Tc)
Should a polymer sample continue to be heated beyond the glass transition temperature range, it becomes possible to observe crystallization of the polymer sample. Crystallization is understood to be the process by which polymer chains form ordered arrangements with one another, thereby creating crystalline structures.
Essentially, before the glass transition range, the polymer does not have enough energy from the applied heat to induce mobility within the polymer chains; however, as heat is continually added, the polymer chains begin to have greater and greater mobility. The chains eventually undergo transitional, rotational, and segmental motion as well as stretching, disentangling, and unfolding. Finally, a peak temperature is reached and enough heat energy has been applied to the polymer that the chains are mobile enough to move into very ordered parallel, linear arrangements. At this point, crystallization begins. The temperature at which crystallization begins is the crystallization temperature (Tc).
As the polymer undergoes crystalline arrangements, it will release heat since intramolecular bonding is occurring. Because heat is being released, the process is exothermic and the DSC system will lower the amount of heat being supplied to the sample plate in relation to the reference plate so as to maintain a constant temperature between the two plates. As a result, a positive amount of energy is released to the environment and an increase in heat flow is measured in an “exo up” DSC system, as seen in Figure \(\PageIndex{33}\). The maximum point on the curve is known to be the Tc of the polymer while the area under the curve is the latent energy of crystallization, i.e., the change in the heat content of the system associated with the amount of heat energy released by the polymer as it undergoes crystallization.
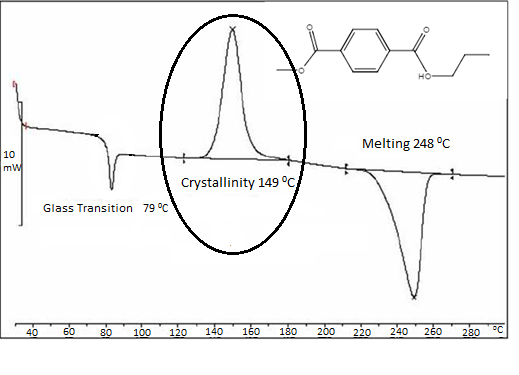
The degree to which crystallization can be measured by the DSC is dependent not only on the measured conditions but also on the polymer itself. For example, in the case of a polymer with very random ordering, i.e., an amorphous polymer, crystallization will not even occur.
In knowing the crystallization temperature of the polymer, it becomes possible to hypothesize on the polymer’s chain structure, average molecular weight, tensile strength, impact strength, resistance to solvents, etc. For example, if the polymer tends to have a lower crystallization temperature and a small latent heat of crystallization, it becomes possible to assume that the polymer may already have a chain structure that is highly linear since not much energy is needed to induce linear crystalline arrangements.
In turn, in obtaining crystallization data via DSC, it becomes possible to determine the percentage of crystalline structures within the polymer, or, the degree of crystallinity. To do so, compare the latent heat of crystallization, as determined by the area under the crystallization curve, to the latent heat of a standard sample of the same polymer with a known crystallization degree.
Knowledge of the polymer sample’s degree of crystallinity also provides an avenue for hypothesizing the composition of the polymer. For example, having a very high degree of crystallinity may suggest that the polymer contains small, brittle molecules that are very ordered.
Melting behavior (Tm)
As the heat being applied pushes the temperature of the system beyond Tc, the polymer begins to approach a thermal transition associated with melting. In the melting phase, the heat applied provides enough energy to, now, break apart the intramolecular bonds holding together the crystalline structure, undoing the polymer chains’ ordered arrangements. As this occurs, the temperature of the sample plate does not change as the applied heat is no longer being used to raise the temperature but instead to break apart the ordered arrangements.
As the sample melts, the temperature slowly increases as less and less of the applied heat is needed to break apart crystalline structures. Once all the polymer chains in the sample are able to move around freely, the temperature of the sample is said to reach the melting temperature (Tm). Upon reaching the melting temperature, the applied heat begins exclusively raising the temperature of the sample; however, the heat capacity of the polymer will have increased upon transitioning from the solid crystalline phase to the melt phase, meaning the temperature will increase more slowly than before.
Since, during the endothermic melting process of the polymer, most of the applied heat is being absorbed by the polymer, the DSC system must substantially increase the amount of heat applied to the sample plate so as to maintain the temperature between the sample plate and the reference plate. Once the melting temperature is reached, however, the applied heat of the sample plate decreases to match the applied heat of the reference plate. As such, since heat is being absorbed from the environment, the resulting “exo up” DSC plot will have a negative curve as seen in Figure \(\PageIndex{34}\) where the lowest point is understood to be the melt phase temperature. The area under the curve is, in turn, understood to be the latent heat of melting, or, more precisely, the change in the heat content of the system associated with the amount of heat energy absorbed by the polymer to undergo melting.
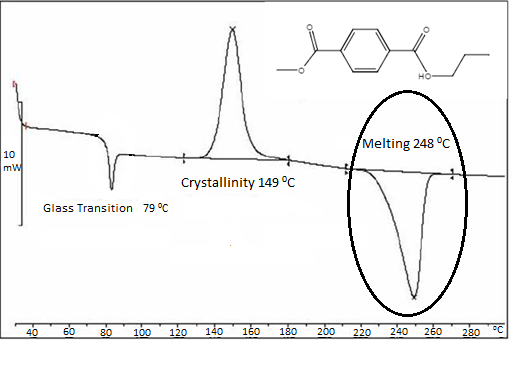
Once again, in knowing the melting range of the polymer, insight can be gained on the polymer’s average molecular weight, composition, and other properties. For example, the greater the molecular weight or the stronger the intramolecular attraction between functional groups within crosslinked polymer chains, the more heat energy that will be needed to induce melting in the polymer.
Modulated DSC: an Overview
While standard DSC is useful in characterization of polymers across a broad temperature range in a relatively quick manner and has user-friendly software, it still has a series of limitations with the main limitation being that it is highly operator dependent. These limitations can, at times, reduce the accuracy of analysis regarding the measurements of Tg, Tc and Tm, as described in the previous section. For example, when using a synthesized polymer that is composed of multiple blends of different monomer compounds, it can become difficult to interpret the various transitions of the polymer due to overlap. In turn, some transitional events are completely dependent on what the user decides to input for the heating or cooling rate.
To resolve some of the limitations associated with standard DSC, there exists modulated DSC (MDSC). MDSC not only uses a linear heating rate like standard DSC, but also uses a sinusoidal, or modulated, heating rate. In doing so, it is as though the MDSC is performing two, simultaneous experiements on the sample.
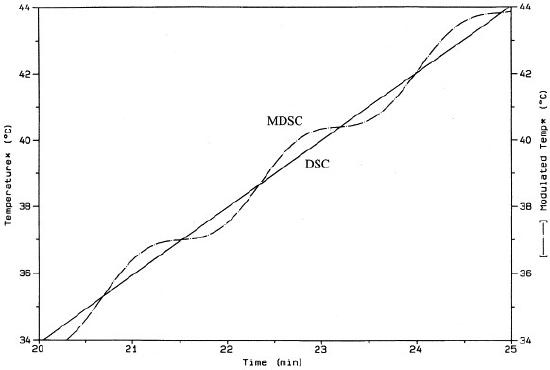
What is meant by a modulated heating rate is that the MDSC system will vary the heating rate of the sample by a small range of heat across some modulating period of time. However, while the temperature rate of change is sinusoidal, it is still ultimately increasing acorss time as indicated in Figure \(\PageIndex{35}\). In turn, Figure \(\PageIndex{36}\) also shows the sinusoidal heating rate as a function of time overlaying the linear heating rate of standard DSC. The linear heating rate of DSC is 2 °C/min and the modulated heating rate of MDSC varies from roughly ~0.1 °C/min and ~3.8 °C/min across a period of time.
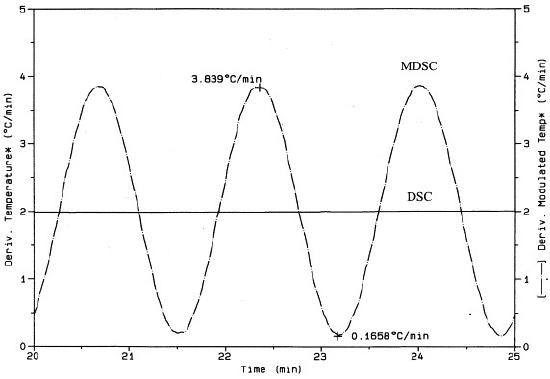
By providing two heating rates, a linear and a modulated one, MDSC is able to measure more accurately how heating rates affect the rate of heat flow within a polymer sample. As such, MDSC offers a means to eliminate the applied heating rate aspects of operator dependency.
In turn, the MDSC instrument also performs mathematical processes that separate the standard DSC plot into reversing and a non-reversing components. The reversing signal is representative of properties that respond to temperature modulation and heating rate, such as glass transition and melting. On the other hand, the non-reversing component is representative of kinetic, time-dependent process such as decomposition, crystallization, and curing. Figure \(\PageIndex{37}\) provides an example of such a plot using PET.
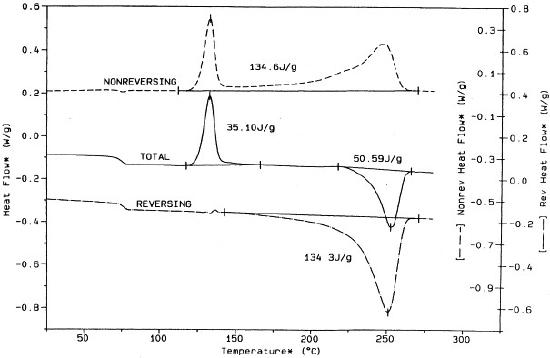
The mathematics behind MDSC is most simply represented by this formula: dH/dt = Cp(dT/dt) + f(T,t) where dH/dt is the total change in heat flow that would be derived from a standard DSC. Cp is heat capacity derived from modulated heating rate, dT/dt is representative of both the linear and modulated heating rate, and f(T,t) is representative of kinetic, time-dependent events, i.e the non-reversing signal. When combining Cp and dT/dt, creating Cp(dT/dt), the reversing signal is produced. The non-reversing signal is, therefore, found by simply subtracting the reversing signal from the total heat flow singal, i.e. dH/dt = Cp(dT/dt) + f(T,t)
As such, MDSC is capable of independently measuring not only total heat flow but also the heating rate and kinetic components of said heat flow, meaning MDSC can break down complex or small transitions into their many singular components with improved sensitivity, allowing for more accurate analysis. Below are some cases in which MDSC proved to be useful for analytics.
Modulated DSC: Advanced Analysis of Tg
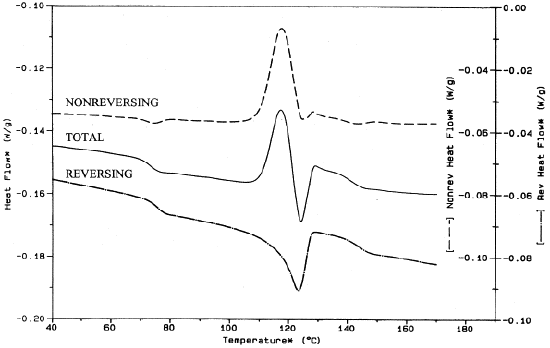
Using a standard DSC, it can be difficult to ascertain the accuracy of measured transitions that are relatively weak, such as Tg, since these transitions can be overlapped by stronger, kinetic transitions. This is quite the problem as missing a weak transition could cause the misinterpretation of polymer to be a uniform sample as opposed to a polymer blend. To resolve this, it is useful to split the plot into its reversing component, i.e. the portion which will contain heat dependent properties like Tg, and its non-reversing, kinetic component.
For example, shown in the Figure \(\PageIndex{38}\) is the MDSC of an unknown polymer blend which, upon analysis, is composed of PET, amorphous polycarbonate (PC), and a high density polyethylene (HDPE). Looking at the reversing signal, the Tg of polycarbonate is around 140 °C and the Tg of PET is around 75 °C. As seen in the total heat flow signal, which is representative of a standard DSC plot, the Tg of PC would have been more difficult to analyze and, as such, may have been incorrectly analyzed.
Modulated DSC: Advanced Analysis of Tm
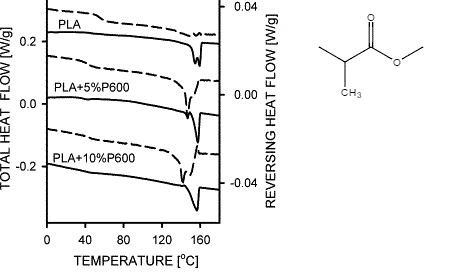
Further, there are instances in which a polymer or, more likely, a polymer blend will produce two different sets of crystalline structures. With two crystalline structures, the resulting melting peak will be poorly defined and, thus, difficult to analyze via a standard DSC.
Using MDSC, however, it becomes possible to isolate the reversing signal, which will contain the melting curve. Through isolation of the reversing signal, it becomes clear that there is an overlapping of two melting peaks such that the MDSC system reveals two melting points. For example, as seen in Figure \(\PageIndex{39}\) the analysis of a poly(lactic acid) polymer (PLA) with 10% wt of a plasticize (P600) reveals two melting peaks in the reversing signal not visible in the total heat flow. The presence of two melting peaks could, in turn, suggest the formation of two crystalline structures within the polymer sample. Other interpretations are, of course, possible via analyzing the reversing signal.
Modulated DSC: Analysis of Polymer Aging
In many instances, polymers may be left to sit in refrigeration or stored at temperatures below their respective glass transition temperatures. By leaving a polymer under such conditions, the polymer is situated to undergo physical aging. Typically, the more flexible the chains of a polymer are, the more likely they will undergo time-related changes in storage. That is to say, the polymer will begin to undergo molecular relaxation such that the chains will form very dense regions while they conglomerate together. As the polymer ages, it will tend towards embrittlement and develop internal stresses. As such, it is very important to be aware if the polymer being studied has gone through aging while in storage.
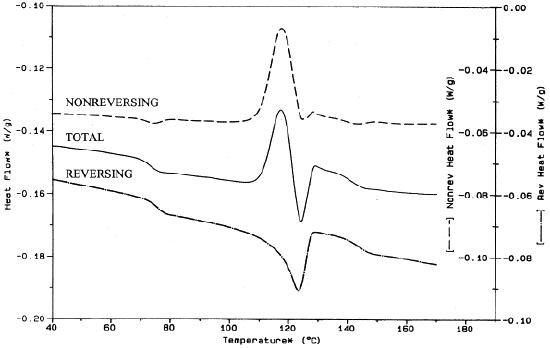
If a polymer has undergone physical aging, it will develop a new endothermic peak when undergoing thermal analysis. This occurs because, as the polymer is being heated, the polymer chains absorb heat, increase mobility, and move to a more relaxed condition as time goes on, transforming back to pre-aged conditions. In turn an endothermic shift, in association with this heat absorbance, will occur just before the Tg step change. This peak is known as the enthalpy of relaxation (ΔHR).
Since the Tg and ΔHR are relatively close to one another energy-wise, they will tend to overlap, making it difficult to distinguish the two from one another. However, ΔHR is a kinetics dependent thermal shift while Tg is a heating dependent thermal shift; therefore, the two can be separated into a non-reversing and reversing plot via MDSC and be independently analyzed.
Figure \(\PageIndex{40}\) is an example of an MDSC plot of a polymer blend of PET, PC, and HDPE in which the enthalpy of relaxation of PET is visible in the dashed non reversing signal around 75 °C. In turn, within the reversing signal, the glass transition of PET is visible around 75 °C as well.
Quasi-isothermal DSC
While MDSC is a strong step in the direction of elinating operator error, it is possible to have an even higher level of precision and accuracy when analyzing a polymer. To do so, the DSC system must expose the sample to quasi-isothermal conditions. In creating quasi-isothermal conditions, the polymer sample is held at a specific temperature for extended periods of time with no applied heating rate. With the heating rate being efficticely zero, the conditions are isothermal. The temperature of the sample may change, but the change will be derived solely from a kinetic transition that has occurred within the polymer. Once a kinetic transition has occurred within the polymer, it will absorb or release some heat, which will raise or decrease the temperature of the system without the application of any external heat.
In creating these conditions, issues created by the variation of the applied heating rate by operators is no longer a large concern. Further, in subjecting a polymer sample to quasi-isothermal conditions, it becomes possible to get improved and more accurate measurements of heat dependent thermal events, such as events typically found in the reversing signal, as a function of time.
Quasi-isothermal DSC: Improved Glass Transition
As mentioned earlier, the glass transition is volatile in the sense that it is highly dependent on the heating and cooling rate of the DSC system as applied by the operator. An minor change in the heating or cooling rate between two experimental measurements of the same polymer sample can result in fairly different measured glass transitions, even though the sample itself has not been altered.
Remember also, that the glass transition is a measure of the changing Cp of the polymer sample as it crosses certain heat energy thresholds. Therefore, it should be possible to capture a more accurate and precise glass transition under quasi-isothermal conditions since these conditions produce highly accurate Cpmeasurements as a function of time.
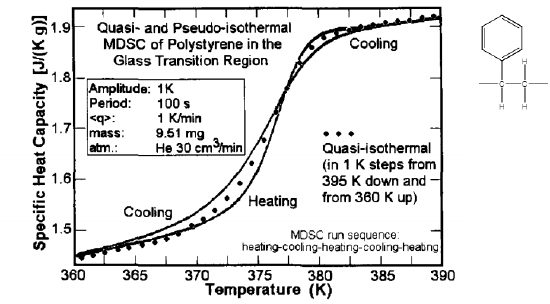
By applying quasi-isothermal conditions, the polymer’s Cp can be measured in fixed-temperature steps within the apparent glass transition range as measured via standard DSC. In measuring the polymer across a set of quasi-isothermal steps, it becomes possible to obtain changing Cp rates that, in turn, would be nearly reflective of an exact glass transition range for a polymer.
In Figure \(\PageIndex{41}\) the glass transition of polystyrene is shown to vary depending on the heating or cooling rate of the DSC; however, when applying qusi-isothermal conditions and measuring the heat capacity at temperature steps produces a very accurate glass transition that can be used as a standard for comparison.
Low-Temperature Specific Heat Measurements for Magnetic Materials
Magnetic materials attract the attention of researchers and engineers because of their potential for application in magnetic and electronic devices such as navigational equipment, computers, and even high-speed transportation. Perhaps more valuable still, however, is the insight they provide into fundamental physicals. Magnetic materials provide an opportunity for studying exotic quantum mechanical phenomena such as quantum criticality, superconductivity, and heavy fermionic behavior intrinsic to these materials. A battery of characterization techniques exist for measuring the physical properties of these materials, among them a method for measuring the specific heat of a material throughout a large range of temperatures. Specific heat measurments are an important means of determining the transition temperature of magnetic materials—the temperature below which magnetic ordering occurs. Additionally, the functionality of specific heat with temperature is characteristic of the behavior of electrons within the material and can be used to classify materials into different categories.
Temperature-dependence of Specific Heat
The molar specific heat of a material is defined as the amount of energy required to raise the temperature of 1 mole of the material by 1 K. This value is calculated theoretically by taking the partial derivative of the internal energy with respect to temperature. This value is not a constant, as it is typically treated in high-school science courses: it depends on the temperature of the material. Moreover, the temperature-dependence itself also changes based on the type of material. There are three broad families of solid state materials defined by their specific heat behaviors. Each of these families is discussed in the following sections.
Insulators
Insulators have specific heat with the simplest dependence on temperature. According to the Debye theory of specific heat, which models materials as phonons (lattice vibrational modes) in a potential well, the internal energy of an insulating system is given by \ref{11} , where TD is the Debye temperature, defined as the temperature associated with the energy of the highest allowed phonon mode of the material. In the limit that T<<TD, the energy expression reduces to \ref{12} .
\[ U\ =\frac{9Nk_{B}T^{4} }{T^{3}_{D}} \int ^{T_{D}/T}_{0} \frac{x^{3}}{e^{x}-1} dx \label{11} \]
\[ U\ =\frac{3 \pi ^{4} N k_{B} T^{4}}{5T^{3}_{D} } \label{12} \]
For most magnetic materials, the Debye temperature is several orders of magnitude higher than the temperature at which magnetic ordering occurs, making this a valid approximation of the internal energy. The specific heat derived from this expression is given by \ref{13}
\[ C_{\nu }\ =\frac{\delta U}{\delta T} =\frac{12 \pi ^{4} Nk_{B} }{5T^{3}_{D}} T^{3} = \beta T^{3} \label{13} \]
The behavior described by the Debye theory accurately matches experimental measurements of specific heat for insulators at low temperatures. Normal insulators, then, have a T3 dependence in the specific heat that is dominated by contributions from phonon excitations. Essentially all energy absorbed by insulating materials is stored in the vibrational modes of a solid lattice. At very low temperatures this contribution is very small, and insulators display a high sensitivity to changes in heat energy.
Metals: Fermi Liquids
While the Debye theory of specific heat accurately describes the behavior of insulators, it does not adequately describe the temperature dependence of the specific heat for metallic materials at low temperatures, where contributions from delocalized conduction electrons becomes significant. The predictions made by the Debye model are corrected in the Einstein-Debye model of specific heat, where an additional term describing the contributions from the electrons (as modeled by a free electron gas) is added to the phonon contribution. The internal energy of a free electron gas is given by \ref{14} ,where g(Ef) is the density of states at the Fermi level, which is material dependent. The partial derivative of this expression with respect to temperature yields the specific heat of the electron gas, \ref{15} .
\[ U = \frac{\pi ^{2}}{6}(k_{B}T)^{2}g(E_{f})+U_{0} \label{14} \]
\[ C_{\nu }= \frac{ \pi^{2}} {3} k^{2}_{B}g(E_{f})T= \gamma T \label{15} \]
Combining this expression with the phonon contribution to specific heat gives the expression predicted by the Einstein-Debye model, \ref{16} .
\[ C_{\nu }= \frac{pi^{2}}{3} k^{2}_{B} g(E_{f})T\ + \frac{12 \pi^{4}Nk_{B}}{5T^{3}_{D}}T^{3} = \gamma T\ +\ \beta T^{3} \label{16} \]
This is the general expression for the specific heat of a Fermi liquid—a variation on the Fermi gas in which fermions (typically electrons) are allowed to interact with each other and form quasiparticles—weakly bound and often short-lived composites of more fundamental particles such as electron-hole pairs or the Cooper pairs of BCS superconductor theory.
Most metallic materials follow this behavior and are thus classified as Fermi liquids. This is easily confirmed by measuring the heat capacity as a function of temperature and linearizing the results by plotting C/T vs. T2. The slope of this graph equal the coefficient β, and the y-intercept is equal to γ. The ability to obtain these coefficients is important for gaining understanding of some unique physical phenomena. For example, the compound YbRh2Si2 is a heavy fermionic material—a material with charge carriers that have an “effective” mass much greater than the normal mass of an electron. The increased mass is due to coupling of magnetic moments between conduction electrons and localized magnetic ions. The coefficient γ is related to the density of states at the Fermi level, which is dependent on the carrier mass. Determination of this coefficient via specific heat measurements provides a way to determine the effective carrier mass and the coupling strength of the quasiparticles.
Additionally, knowledge of Fermi-liquid behavior provides insight for application development. The temperature dependence of the specific heat shows that the phonon contribution dominates at higher temperatures, where the behavior of metals and insulators is very similar. At low temperatures, the electronic term is dominant, and metals can absorb more heat without a signficant change in temperature. As will be discussed breifly later, this property of metals is utilized in low-temperature refrigeration systems for heat storage at low temperatures.
Metals: non-Fermi liquids
While most metals fall under the category of Fermi liquids, there are some that show a different dependence on temperature. Naturally, these are classified as non-Fermi liquids. Often, deviation from Fermi-liquid behavior is an indicator of some of the interesting physical phenomena that currently garner the attention of many condensed matter researchers. For instance, non-Fermi liquid behavior has been observed near quantum critical points. Classically, fluctuations in physical properties such as magnetic susceptibility and resistivity occur near critical points which include phase changes or magnetic ordering transitions. Normally, these fluctuations are suppressed at low temperatures—at absolute zero, classical systems collapse into the lowest energy state and remain stable; However, when the critical transition temperature is lowered by the application of pressure, doping, or magnetic field to absolute zero, the fluctuations are enhanced as the temperature approaches absolute zero, propagating throughout the whole of the material. As this is not classically allowed, this behavior indicates a quantum mechanical effect at play that is currently not well understood. The transition point is then called a quantum critical point. Non-fermi liquid behavior as identified by deviations in the expected specific heat, then, is used to identify materials that can provide an experimental basis for development of a theory that describes the physics of quantum criticality.
Determination of magnetic transition temperatures viz specific heat measurements
While analysis of the temperature dependence of specific heat is a vital tool for studying the strange physical behaviors of quantum mechanics in solid state materials, these are studied by only a small subsection of the physics community. The utility of specific heat measurements is not limited to a few niche subjects, however. Possibly the most important use for specific heat measurements is the determination of critical transition temperatures. For any sort of physical state transition—phase transitions, magnetic ordering, transitions to superconducting states—a sharp increase in the specific heat occurs during the transition. This increase in specific heat is the reason why, for example, water does not change temperature as it changes from a liquid to a solid. These increases are quite obvious in plots of the specific heat vs. temperature as seen in Figure \(\PageIndex{42}\). These transition-associated peaks are called Schottky anomalies, as normal specific heat behavior is not followed near to the transition temperature.
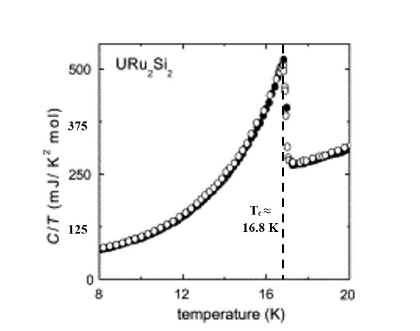
For the purposes of this chapter, the following sections will focus on specific heat measurements as they relate to magnetic ordering transititions. The following sections will describe the practical aspects of measuring the specific heat of these materials.
A practical guide to low-temperature specific heat measurements
The thermal relaxation method of measurement
Specific heat is measured using a calorimeter. The design of basic calorimeters for use over a short range of temperatures is relatively simple. They consist of a sample with a known mass and an unknown specific heat, an energy source which provides heat energy to the sample, a heat reservoir (of known mass and specific heat) that absorbs heat from the sample, insulation to provide adiabatic conditions inside the calorimeter, and probes for measuring the temperature of the sample and the reservoir. The sample is heated with a pulse to a temperature higher than the heat reservoir, which decreases as energy is absorbed by the reservoir until a thermal equilibrium is established. The total energy change is calculated using the specific heat and temperature change of the reservoir. The specific heat of the sample is calculated by dividing the total energy change by the product of the mass of the sample and the temperature change of the sample.
However, this method of measurement produces an average value of the specific heat over the range of the change in temperature of the sample, and therefore, is insufficient for producing accurate measurements of the specific heat as a function of temperature. The solution, then, is to minimize the temperature change by reducing the amount of heat added to the system; yet, this presents another obstacle to making measurement as, in general, the temperature change of the reservoir is much smaller than that of the sample. If the change in temperature of the sample is minimized, the temperature change of reservoir becomes too small to measure with precision. A more direct method of measurement, then, seems to be required.
Fortunately, such a method exists: it is known as the thermal relaxation method. This method involves measurement of the specific heat without the need for precise knowledge of temperature changes in the reservoir. In this method, solid samples are affixed to a platform. Both the specific heat of the sample and the platform itself contribute to the measured specific heat; therefore, the contribution from the platform must be subtracted. This contribution is determined by measuring the specific heat without a sample present. Both the sample and the platform are in thermal contact with a heat reservoir at low temperature as depicted in Figure \(\PageIndex{43}\).
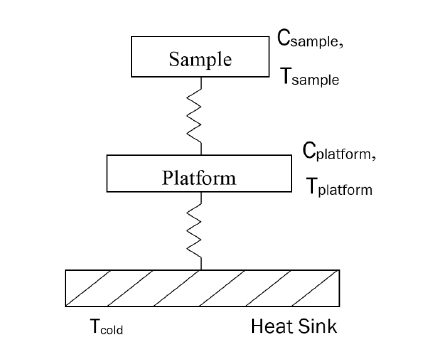
A heat pulse is delivered to the sample to produce a minimal increase in the temperature of the sample. The temperature is measured vs. time as it decays back to the temperature of the reservoir as shown in \(\PageIndex{44}\).
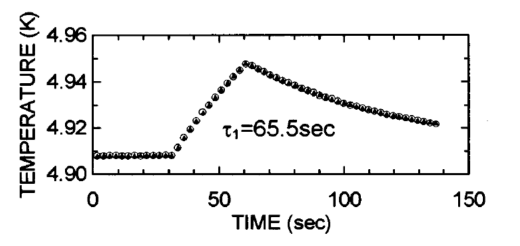
The temperature of the sample decays according to \ref{17} , where T0 is the temperature of the heat reservoir, and ΔT is the temperature difference between the initial sample temperature and the reservoir temperature. The decay time constant τ is directly related to the specific heat of the sample by \ref{18} , Where K is the thermal conductance of the thermal link between the sample and the heat reservoir. In order for this to be valid, however, the thermal conductance must be sufficiently large that the energy transfer from the heated sample to the reservoir can be treated as a single process. If the thermal conduction is poor, a two-τ behavior arises corresponding to two separate processes with different time constants—slow heat transfer from the sample to the platform, and fast transfer from the platform to the reservoir. Figure \(\PageIndex{45}\) shows a relaxation curve in which the two- τ behavior plays a significant role.
\[ T = \Delta e^{t/ \tau}\ +\ T_{0} \label{17} \]
\[ \tau \ =\ C_{p}/K \label{18} \]
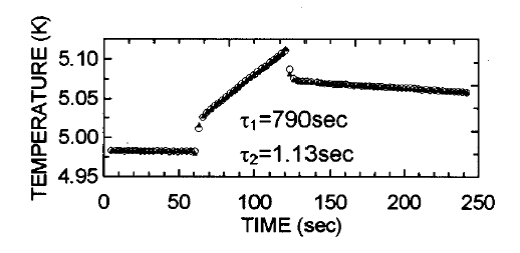
The two-τ effect is generally undesireable for making measurements. It can be avoided by reducing thermal conductance between the sample and the platform, effectively making the contribution from the heat transfer from the sample to the platform insignificant compared to the transfer from the platform to the reservoir; however, if the conductance between the sample and the platform is too low, the time required to reach thermal equilibrium becomes excessively long, translating into very long measurement times. It is necessary, then, to optimize the conductance to compensate for both of these issues. This essentially provides a limitation on the temperature range over which these effects are insignificant.
In order to measure at different temepratures, the temperature of the heat reservoir is increased stepwise from the lowest temperature until the desired temperature range is covered. At each step, the temperature is allowed to equilibrate, and a data point is measured.
Instrumentation
Thermal relaxation calorimeters use advanced technology to make precise measurements of the specific heat using components made of highly specialized materials. For example, the sample platform is made of synthetic sapphire which is used as a standard material, the grease which is applied to the sample to provide even thermal contact with the platform is a special hydrocarbon-based material which can withstand millikelvin temperatures without creeping, cracking, or releasing vapor, and the resistance thermometers used for ultralow temperatures are often made of treated graphite or germanium. The culmination of years of materials science research and careful engineering has produced instrumentation with the capability for precise measurements from temperatures down to the millikelvin level. There are four main systems that function to provide the proper conditions for measurement: the reservoir temperature control, the sample temperature control, the magnetic field control, and the pressure control system. The essential components of these systems will be discussed in more detail in the following sections with special emphasis on the cooling systems that allow these extreme low temperatures to be achieved.
Cooling systems
The first of these is responsible for maintaining the low baseline temperature to which the sample temperature relaxes. This is typically accomplished with the use of liquid helium cryostats or, in more recent years, so-called “cryogen-free” pulse tube coolers.
A cryostat is simply a bath of cryogenic fluid that is kept in thermal contact with the sample. The fluid bath may be static or may be pumped through a circulation system for better cooling. The cryostat must also be thermally insulated from the external environment in order to maintain low temperatures. Insulation is provided by a metallic vacuum dewar: The vacuum virtually eliminates conuductive or convective heat transfer from the environment and the reflective metallic outer sleeve acts as a radiation shield. For the low temperatures required to observe some magnetic transitions, liquid helium is generally required. 4He liquefies at 4.2 K, and the rarer (and much more expensive) isotope, 3He, liquefies at 1.8 K. For temperatures lower than 1.8 K, modern instruments employ evaporative attachments such as a 1-K pot, 3He refrigerator, or a dilution refrigerator. The 1-K pot is so named because it can achieve temperatures down to 1 K. It consists of a small vessel filled with liquid 4He under reduced pressure. Heat is absorbed as the liquid evaporates and is carried away by the vapor. The 3He refrigerator utilizes a 1-K pot for liquefaction of 3He, then evaporation of 3He provide cooling to the sample. 3He refrigerators can provide temperatures as low as 200 mK. The dilution refrigerator works on a similar principle, however the working fluid is a mixture of 3He and 4He. Phase separation of the 3He from the mixture provides further heat absorption as the 3He evaporates. Dilution refrigerators can achieve temperatures as low as 0.002 K (That’s cold!). Evaporative refrigerators work only on a small area in thermal contact with the sample, rather than delivering cooling power to the entire volume of the cryostat bath.
Cryostat baths provide very high cooling power for very efficient cooling; however, they come with a major drawback: the cost of helium is prohibitively high. The helium vapor that boils off as it provides cooling to the sample must leave the system in order to carry the heat away and must therefore be replaced. Even when the instrument is not in use, there is some loss of helium due to the imperfect nature of the insulating dewars. In order to get the most use out of the helium, then, cryostat systems must always be in use. In addition, rather than allowing expensive helium to simply escape, recovery systems for helium exhaust must be installed in order to operate in a cost-effective manner, though these systems are not 100% efficient, and the cost of operation and maintenance of recovery systems is not small either. “Cryogen-free” coolers provide an alternative to cryostats in order to avoid the costs associated with helium usage and recovery.
Figure \(\PageIndex{46}\) shows a Gifford-McMahon type pulse tube—one example of the cryogen-free coolers.
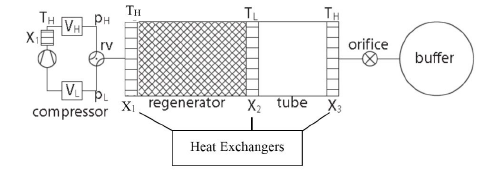
In this type of cooler, helium gas is driven through the regenerator by a compressor. As a small volume element of the gas passes throughout the regenerator, it drops in temperature as it deposits heat into the regenerator. The regenerator must have a high specific heat in order to effectively absorb energy from the helium gas. For higher-temperature pulse tube coolers, the regenerator is often made of copper mesh; however, for very low temperatures, helium has a higher specific heat than most metals. Regenerators for this temperature range are often made of porous rare earth ceramics with magnetic transitions in the low temperature range. The increase in specific heat near the Schottky anomaly for these materials provides the necessary capacity for heat absorption. As the gas enters the tube at a temperature TL(from the diagram above) it is compressed, raising the temperature in accordance with the ideal gas law. At this point, the gas is at a temperature higher than TH and excess heat is exhausted through the heat exchanger marked X3 until the temperature is in equilibrium with TH. When the rotary valve in the compressor turns, the expansion cycle begins, and the gas cools as it expands adiabatically to a temperature below TL. It then absorbs heat from the sample through the heat exchanger X2. This step provides the cooling power in pulse tube coolers. Afterward, it travels back through the regenerator at a cold temperature and reabsorbs the heat that was initially stored during compression, and regains it’s original temperature through the heat exchanger X1. Figure \(\PageIndex{47}\) illustrates the temperature cyle experienced by a volume element of the working gas as it moves through the pulse tube.
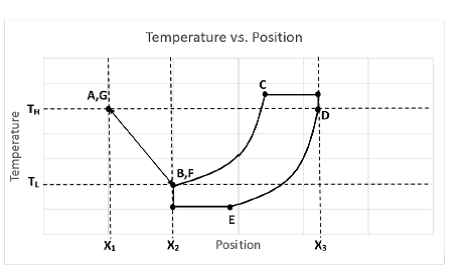
Pulse tube coolers are not truly “cryogen-free” as they are advertised, but they are preferable to cryostats because there is no net loss of the helium in the system. However, pulse tubes are not a perfect solution. They have very low efficiency over large changes in temperature and at very low temperatures as given by \ref{19} .
\[ \zeta \ =\ 1\ -\ \frac{\Delta T}{T_{H}} \label{19} \]
As a result, pulse tube coolers consume a lot of electricity to provide the necessary cooling and may take a long time to achieve the desired temperature. Over large temperature ranges such as the 4 – 300 K range typically used in specific heat measurements, pulse tubes can be used in stages, with one providing pre-cooling for the next, to increase the cooling power and provide a shorter cooling time, though this tends to increase the energy consumption. The cost of running a pulse tube system is still generally less that that of a cryostat, however, and unlike cryostats, pulse tube systems do not have to be used constantly in order to remain cost-effective.
Sample Conditions
While the cooling system works more or less independently, the other systems—the sample temperature control, the magnetic field control, and the pressure control systems—work together to create the proper conditions for measurement of the sample. The sample temperature control system provides the heat pulse used to increase the temperature of the sample before relaxation occurs. The components of this system are incorporated into the sapphire sample platform as shown in Figure \(\PageIndex{48}\).
Figure \(\PageIndex{48}\) The sample platform with important components of the sample temperature control system. Reused with permission from R. J. Schutz. Rev. Sci. Instrum., 1974, 45, 548. Copyright: AIP publishing.
The sample is affixed to the platform over the thermometer with a small amount of grease, which also provides thermal conductance between the heating element and the sample. The heat pulse is delivered to the sample by running a small current pulse through the heating element, and the response is measured by a resistance thermometer. The resistance thermometer is made of specially-treated carbon or germanium which have standardized resistances for given temperatures. The thermometer is calibrated to these standards to provide accurate temperature readings throughout the range of temperatures used for specific heat measurements. A conductive wire provides thermal connection between the sample platform and the heat reservoir. This wire must provide high conductivity to ensure that the heat transfer from the sample to the platform is the dominant process and prevent significant two-τ behavior. Sample preparation is also governed by the temperature control system. The sample must be in good thermal contact with the platform, therefore, a sample with a flat face is preferable. The volume of the sample cannot be too large, either, or the heating element will not be able to heat the sample uniformly. A temperature gradient throughout the sample skews the measurement of the temperature made by the thermometer. Moreover, it is impossible to assign a 1:1 correspondence between the specific heat and temperature if the specific heat values do not correspond to a singular temperature. For the best measurements, heat capacity samples must be cut from large single-crystals or polycrystalline solids using a hard diamond saw to prevent contamination of the sample with foreign material.
The magnetic field control system provides magnetic fields ranging from 0 to >15 T. As was mentioned previously, strong magnetic fields can suppress the transition to magnetically ordered states to lower temepratures, which is important for studying quantum critical behaviors. The magnetic field control consists of a high-current solenoid and regulating electronics to ensure stable current and field outputs.
The pressure systems controls the pressure in the sample chamber, which is physically separated from the bath by a wall which allows thermal transfer only. While the sample is installed in the chamber, the vacuum system must be able to maintain low pressures (~10-5 torr) to ensure that no gas is present. If the vacuum system fails, water from any air present in the system can condense inside the sample chamber, including on the sample platform, which alters thermal conductance and throws off measurement of the specific heat. Moreover, as the temperature in the chamber drops, water can freeze and expand in the chamber which can cause significant damage to the instrument itself.
Conclusions
Through the application of specialized materials and technology, measurements of the specific heat have become both highly accurate and very precise. As our measurement capabilities expand toward the 0 K limit, exciting prospects arise for completion of our understanding, discovery of new phenomena, and development of important applications of novel magnetic materials. Specific heat measurements, then, are a vital tool for studying magnetic materials, whether as a means of exploring the strange phenomena of quantum physics such as quantum criticality or heavy fermions, or simply as a routine method of characterizing physical transitions between different states.


