
1.9: Neutron Activation Analysis (NAA)
- Page ID
- 55826

\( \newcommand{\vecs}[1]{\overset { \scriptstyle \rightharpoonup} {\mathbf{#1}} } \)
\( \newcommand{\vecd}[1]{\overset{-\!-\!\rightharpoonup}{\vphantom{a}\smash {#1}}} \)
\( \newcommand{\dsum}{\displaystyle\sum\limits} \)
\( \newcommand{\dint}{\displaystyle\int\limits} \)
\( \newcommand{\dlim}{\displaystyle\lim\limits} \)
\( \newcommand{\id}{\mathrm{id}}\) \( \newcommand{\Span}{\mathrm{span}}\)
( \newcommand{\kernel}{\mathrm{null}\,}\) \( \newcommand{\range}{\mathrm{range}\,}\)
\( \newcommand{\RealPart}{\mathrm{Re}}\) \( \newcommand{\ImaginaryPart}{\mathrm{Im}}\)
\( \newcommand{\Argument}{\mathrm{Arg}}\) \( \newcommand{\norm}[1]{\| #1 \|}\)
\( \newcommand{\inner}[2]{\langle #1, #2 \rangle}\)
\( \newcommand{\Span}{\mathrm{span}}\)
\( \newcommand{\id}{\mathrm{id}}\)
\( \newcommand{\Span}{\mathrm{span}}\)
\( \newcommand{\kernel}{\mathrm{null}\,}\)
\( \newcommand{\range}{\mathrm{range}\,}\)
\( \newcommand{\RealPart}{\mathrm{Re}}\)
\( \newcommand{\ImaginaryPart}{\mathrm{Im}}\)
\( \newcommand{\Argument}{\mathrm{Arg}}\)
\( \newcommand{\norm}[1]{\| #1 \|}\)
\( \newcommand{\inner}[2]{\langle #1, #2 \rangle}\)
\( \newcommand{\Span}{\mathrm{span}}\) \( \newcommand{\AA}{\unicode[.8,0]{x212B}}\)
\( \newcommand{\vectorA}[1]{\vec{#1}} % arrow\)
\( \newcommand{\vectorAt}[1]{\vec{\text{#1}}} % arrow\)
\( \newcommand{\vectorB}[1]{\overset { \scriptstyle \rightharpoonup} {\mathbf{#1}} } \)
\( \newcommand{\vectorC}[1]{\textbf{#1}} \)
\( \newcommand{\vectorD}[1]{\overrightarrow{#1}} \)
\( \newcommand{\vectorDt}[1]{\overrightarrow{\text{#1}}} \)
\( \newcommand{\vectE}[1]{\overset{-\!-\!\rightharpoonup}{\vphantom{a}\smash{\mathbf {#1}}}} \)
\( \newcommand{\vecs}[1]{\overset { \scriptstyle \rightharpoonup} {\mathbf{#1}} } \)
\(\newcommand{\longvect}{\overrightarrow}\)
\( \newcommand{\vecd}[1]{\overset{-\!-\!\rightharpoonup}{\vphantom{a}\smash {#1}}} \)
\(\newcommand{\avec}{\mathbf a}\) \(\newcommand{\bvec}{\mathbf b}\) \(\newcommand{\cvec}{\mathbf c}\) \(\newcommand{\dvec}{\mathbf d}\) \(\newcommand{\dtil}{\widetilde{\mathbf d}}\) \(\newcommand{\evec}{\mathbf e}\) \(\newcommand{\fvec}{\mathbf f}\) \(\newcommand{\nvec}{\mathbf n}\) \(\newcommand{\pvec}{\mathbf p}\) \(\newcommand{\qvec}{\mathbf q}\) \(\newcommand{\svec}{\mathbf s}\) \(\newcommand{\tvec}{\mathbf t}\) \(\newcommand{\uvec}{\mathbf u}\) \(\newcommand{\vvec}{\mathbf v}\) \(\newcommand{\wvec}{\mathbf w}\) \(\newcommand{\xvec}{\mathbf x}\) \(\newcommand{\yvec}{\mathbf y}\) \(\newcommand{\zvec}{\mathbf z}\) \(\newcommand{\rvec}{\mathbf r}\) \(\newcommand{\mvec}{\mathbf m}\) \(\newcommand{\zerovec}{\mathbf 0}\) \(\newcommand{\onevec}{\mathbf 1}\) \(\newcommand{\real}{\mathbb R}\) \(\newcommand{\twovec}[2]{\left[\begin{array}{r}#1 \\ #2 \end{array}\right]}\) \(\newcommand{\ctwovec}[2]{\left[\begin{array}{c}#1 \\ #2 \end{array}\right]}\) \(\newcommand{\threevec}[3]{\left[\begin{array}{r}#1 \\ #2 \\ #3 \end{array}\right]}\) \(\newcommand{\cthreevec}[3]{\left[\begin{array}{c}#1 \\ #2 \\ #3 \end{array}\right]}\) \(\newcommand{\fourvec}[4]{\left[\begin{array}{r}#1 \\ #2 \\ #3 \\ #4 \end{array}\right]}\) \(\newcommand{\cfourvec}[4]{\left[\begin{array}{c}#1 \\ #2 \\ #3 \\ #4 \end{array}\right]}\) \(\newcommand{\fivevec}[5]{\left[\begin{array}{r}#1 \\ #2 \\ #3 \\ #4 \\ #5 \\ \end{array}\right]}\) \(\newcommand{\cfivevec}[5]{\left[\begin{array}{c}#1 \\ #2 \\ #3 \\ #4 \\ #5 \\ \end{array}\right]}\) \(\newcommand{\mattwo}[4]{\left[\begin{array}{rr}#1 \amp #2 \\ #3 \amp #4 \\ \end{array}\right]}\) \(\newcommand{\laspan}[1]{\text{Span}\{#1\}}\) \(\newcommand{\bcal}{\cal B}\) \(\newcommand{\ccal}{\cal C}\) \(\newcommand{\scal}{\cal S}\) \(\newcommand{\wcal}{\cal W}\) \(\newcommand{\ecal}{\cal E}\) \(\newcommand{\coords}[2]{\left\{#1\right\}_{#2}}\) \(\newcommand{\gray}[1]{\color{gray}{#1}}\) \(\newcommand{\lgray}[1]{\color{lightgray}{#1}}\) \(\newcommand{\rank}{\operatorname{rank}}\) \(\newcommand{\row}{\text{Row}}\) \(\newcommand{\col}{\text{Col}}\) \(\renewcommand{\row}{\text{Row}}\) \(\newcommand{\nul}{\text{Nul}}\) \(\newcommand{\var}{\text{Var}}\) \(\newcommand{\corr}{\text{corr}}\) \(\newcommand{\len}[1]{\left|#1\right|}\) \(\newcommand{\bbar}{\overline{\bvec}}\) \(\newcommand{\bhat}{\widehat{\bvec}}\) \(\newcommand{\bperp}{\bvec^\perp}\) \(\newcommand{\xhat}{\widehat{\xvec}}\) \(\newcommand{\vhat}{\widehat{\vvec}}\) \(\newcommand{\uhat}{\widehat{\uvec}}\) \(\newcommand{\what}{\widehat{\wvec}}\) \(\newcommand{\Sighat}{\widehat{\Sigma}}\) \(\newcommand{\lt}{<}\) \(\newcommand{\gt}{>}\) \(\newcommand{\amp}{&}\) \(\definecolor{fillinmathshade}{gray}{0.9}\)Introduction
Neutron activation analysis (NAA) is a non-destructive analytical method commonly used to determine the identities and concentrations of elements within a variety of materials. Unlike many other analytical techniques, NAA is based on nuclear rather than electronic transitions. In NAA, samples are subjected to neutron radiation (i.e., bombarded with neutrons), which causes the elements in the sample to capture free neutrons and form radioactive isotopes, such as
\[ ^{59}_{27}\ce{Co} + ^1_0 n \rightarrow ^{60}_{27}\ce{Co} \nonumber. \]
The excited isotope undergoes nuclear decay and loses energy by emitting a series of particles that can include neutrons, protons, alpha particles, beta particles, and high-energy gamma ray photons. Each element on the periodic table has a unique emission and decay path that allows the identity and concentration of the element to be determined.
History
Almost eighty years ago in 1936, George de Hevesy and Hilde Levi published the first paper on the process of neutron activation analysis. They had discovered that rare earth elements such as dysprosium became radioactive after being activated by thermal neutrons from a radon-beryllium (266Ra + Be) source. Using a Geiger counter to count the beta particles emitted, Hevesy and Levi were able to identify the rare earth elements by half-life. This discovery led to the increasingly popular process of inducing radioactivity and observing the resulting nuclear decay in order to identify an element, a process we now know as NAA. In the years immediately following Hevesy and Levi’s discovery, however, the advancement of this technique was restricted by the lack of stable neutron sources and adequate spectrometry equipment. Even with the development of charged-particle accelerators in the 1930s, analyzing multi-element samples remained time-consuming and tedious. The method was improved in the mid-1940s with the availability of the X-10 reactor at the Oak Ridge National Laboratory, the first research-type nuclear reactor. As compared with the earlier neutron sources used, this reactor increased the sensitivity of NAA by a factor of a million. Yet the detection step of NAA still revolved around Geiger or proportional counters; thus, many technological advancements were still to come. As technology has progressed in the recent decades, the NAA method has grown tremendously, and scientists now have a plethora of neutron sources and detectors to choose from when analyzing a sample with NAA.
Sample preparation
In order to analyze a material with NAA, a small sample of at least 50 milligrams must be obtained from the material, usually by drilling. It is suggested that two different samples are obtained from the material using two drill bits of different compositions. This will show any contamination from the drill bits and, thus, minimize error. Prior to irradiation, the small samples are encapsulated in vials of either quartz or high purity linear polyethylene.
Instrument
How it Works
Neutron activation analysis works through the processes of neutron activation and radioactive decay. In neutron activation, radioactivity is induced by bombarding a sample with free neutrons from a neuron source. The target atomic nucleus captures a free neutron and, in turn, enters an excited state. This excited and therefore unstable isotope undergoes nuclear decay, a process in which the unstable nucleus emits a series of particles that can include neutrons, protons, alpha, and beta particles in an effort to return to a low-energy, stable state. As suggested by the several different particles of ionizing radiation listed above, there are many different types of nuclear decay possible. These are summarized in the figure below.
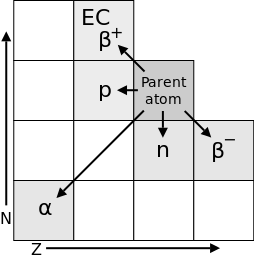
An additional type of nuclear decay is that of gamma radiation (denoted as γ), a process in which the excited nucleus emits high-energy gamma ray photons. There is no change in either neutron number N or atomic number Z, yet the nucleus undergoes a nuclear transformation involving the loss of energy. In order to distinguish the higher energy parent nucleus (prior to gamma decay) from the lower energy daughter nucleus (after gamma decay), the mass number of the parent nucleus is labeled with the letter m, which means “metastable.” An example of gamma radiation with the element technetium is shown here.
\[ ^{99m}_{43}\ce{Tc} \rightarrow ^{99}_{43}\ce{Tc} + ^0_0\gamma \nonumber \]
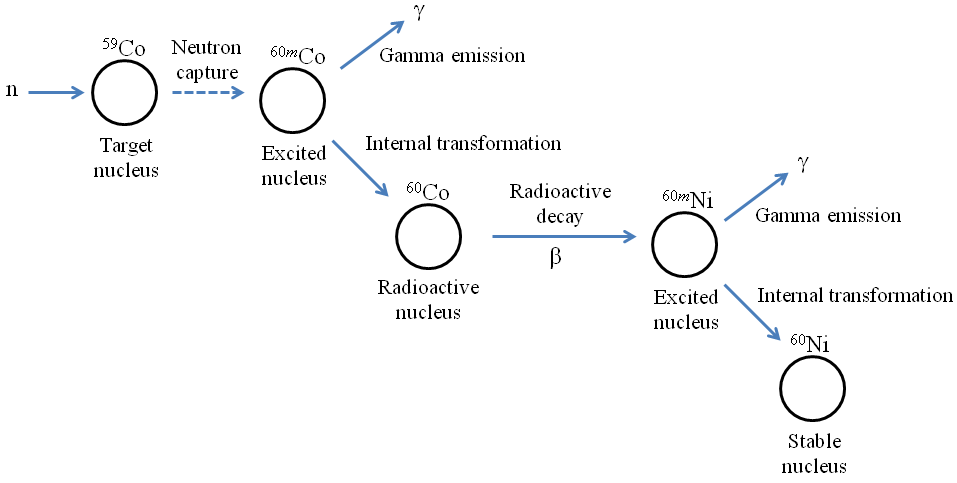
In NAA, the radioactive nuclei in the sample undergo both gamma and particle nuclear decay. The figure below presents a schematic example of nuclear decay. After capturing a free neutron, the excited 60mCo nucleus undergoes an internal transformation by emitting gamma rays. The lower-energy daughter nucleus 60Co, which is still radioactive, then emits a beta particle. This results in a high-energy 60Ni nucleus, which once again undergoes an internal transformation by emitting gamma rays. The nucleus then reaches the stable 60Ni state.
Although alpha and beta particle detectors do exist, most detectors used in NAA are designed to detect the gamma rays that are emitted from the excited nuclei following neutron capture. Each element has a unique radioactive emission and decay path that is scientifically known. Thus, based on the path and the spectrum produced by the instrument, NAA can determine the identity and concentration of the element.
Neutron Sources
As mentioned above, there are many different neutron sources that can be used in modern-day NAA. A chart comparing three common sources is shown in the table below.
| Source type | Description | Example(s) | Typical output |
|---|---|---|---|
| Isotopic neutron sources | Certain isotopes undergo spontaneous fission and release neutrons as they decay. | 226Ra(Be), 124Sb(Be), 241Am(Be), 252Cf | 105-107 s-1 GBq-1 or 2.2 1012 s-1 g-1 for 252Cf |
| Particle accelerators or neutron generators | Particle accelerators produce neutrons by colliding hydrogen, deuterium, and tritium with target nuclei such as deuterium, tritium, lithium, and beryllium. | Acceleration of deuterium ions toward a target containing deuterium or tritium, resulting in the reactions 2H(2H,n)3He and 3H(2H,n)4He | 108-1010 s-1 for the first deuterium on deuterium reactions and 109-1011 s-1 for deuterium on tritium reactions |
| Nuclear research reactors | Within nuclear reactors, large atomic nuclei absorbs neutrons and undergo nuclear fission. The nuclei split into lighter nuclei, which releases energy, radiation, and free neutrons. | 235U and 239Pu | 1015-1018 m-2 s-1 |
Gamma and Particle Detectors
As mentioned earlier, most detectors used in NAA are designed to detect the gamma rays emitted from the decaying nucleus. Two widely used gamma detectors are the scintillation type and the semiconductor type. The former uses a sensitive crystal, often sodium iodide that is doped with thallium (NaI(Tl)), that emits light when gamma rays strike it. Semiconductor detectors, on the other hand, use germanium to form a diode that produces a signal in response to gamma radiation. The signal produced is proportional to the energy of the emitted gamma radiation. Both types of gamma detectors have excellent sensitivity with detection limits ranging from 0.1 to 106 nanogram element per gram sample, but semiconductor type detectors usually have superior resolution.
Furthermore, particles detectors designed to detect the alpha and beta particles that are emitted in nuclear decay are also available; however, gamma detectors are favorable. Particle detectors require a high vacuum since atmospheric gases in the air can absorb and affect the emission of these particles. Gamma rays are not affected in this way.
Variations/Parameters
INAA versus RNAA
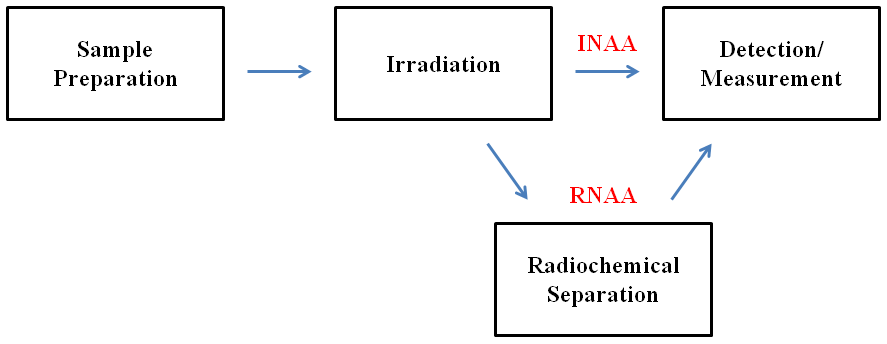
Instrumental neutron activation analysis (INAA) is the simplest and most widely used form of NAA. It involves the direct irradiation of the sample, meaning that the sample does not undergo any chemical separation or treatment prior to detection. INAA can only be used if the activity of the other radioactive isotopes in the sample does not interfere with the measurement of the element(s) of interest. Interference often occurs when the element(s) of interest are present in trace or ultratrace amounts. If interference does occur, the activity of the other radioactive isotopes must be removed or eliminated. Radiochemical separation is one way to do this. NAA that involves sample decomposition and elemental separation is known as radiochemical neutron activation analysis (RNAA). In RNAA, the interfering elements are separated from the element(s) of interest through an appropriate separation method. Such methods include extractions, precipitations, distillations, and ion exchanges. Inactive elements and matrices are often added to ensure appropriate conditions and typical behavior for the element(s) of interest. A schematic comparison of INAA and RNAA is shown below.
ENAA versus FNAA
Another experimental parameter that must be considered is the kinetic energy of the neutrons used for irradiation. In epithermal neutron activation analysis (ENAA), the neutrons – known as epithermal neutrons – are partially moderated in the reactor and have kinetic energies between 0.5 eV to 0.5 MeV. These are lower-energy neutrons as compared to fast neutrons, which are used in fast neutron activation analysis (FNAA). Fast neutrons are high-energy, unmoderated neutrons with kinetic energies above 0.5 MeV.
PGNAA versus DGNAA
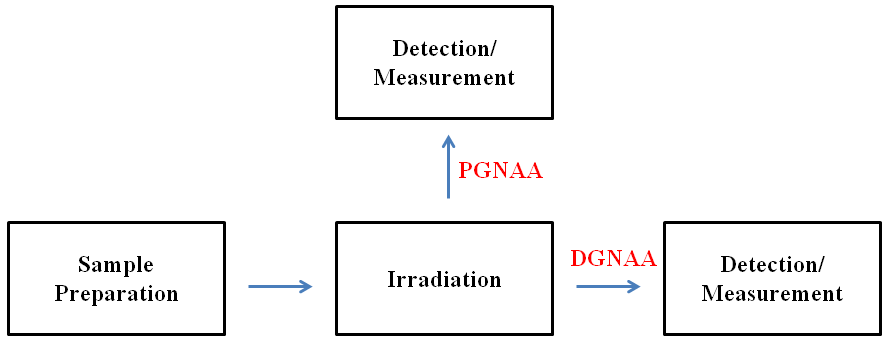
The final parameter to be discussed is the time of measurement. The nuclear decay products can be measured either during or after neutron irradiation. If the gamma rays are measured during irradiation, the procedure is known as prompt gamma neutron activation analysis (PGNAA). This is a special type of NAA that requires additional equipment including an adjacent gamma detector and a neutron beam guide. PGNAA is often used for elements with rapid decay rates, elements with weak gamma emission intensities, and elements that cannot easily be determined by delayed gamma neutron activation analysis (DGNAA) such as hydrogen, boron, and carbon. In DGNAA, the emitted gamma rays are measured after irradiation. DGNAA procedures include much longer irradiation and decay periods than PGNAA, often extending into days or weeks. This means that DGNAA is ideal for long-lasting radioactive isotopes. A schematic comparison of PGNAA and DGNAA is shown below.
Examples
Characterizing archaeological materials
Throughout recent decades, NAA has often been used to characterize many different types of samples including archaeological materials. In 1961, the Demokritos nuclear reactor, a water moderated and cooled reactor, went critical at low power at the National Center for Scientific Research “Demokritos” (NCSR “Demokritos”) in Athens, Greece. Since then, NCSR “Demokritos” has been a leading center for the analysis of archaeological materials.
Ceramics, carbonates, silicates, and steatite are routinely analyzed at NCSR “Demokritos” with NAA. A routine analysis begins by weighing and placing 130 milligrams of the powdered sample into a polyethylene vial. Two batches of ten vials, eight samples and two standards, are then irradiated in the Demokritos nuclear reactor for 45 minutes at a thermal neutron flux of 6 x 10¹³ neutrons cm-2 s-1. The first measurement occurs seven days after irradiation. The gamma ray emissions of both the samples and standards are counted with a germanium gamma detector (semiconductor type) for one hour. This measurement determines the concentrations of the following elements: As, Ca, K, La, Lu, Na, Sb, Sm, U, and Yb. A second measurement is performed three weeks after irradiation in which the samples and standards are counted for two hours. In this measurement, the concentrations of the following elements are determined: Ba, Ce, Co, Cr, Cs, Eu, Fe, Hf, Nd, Ni, Rb, Sc, Ta, Tb, Th, Zn, and Zr.
Using the method described above, NCSR “Demokritos” analyzed 195 samples of black-on-red painted pottery from the late Neolithic age in what is now known as the Black-On-Red Pottery Project. An example of black-on-red painted pottery is shown here.
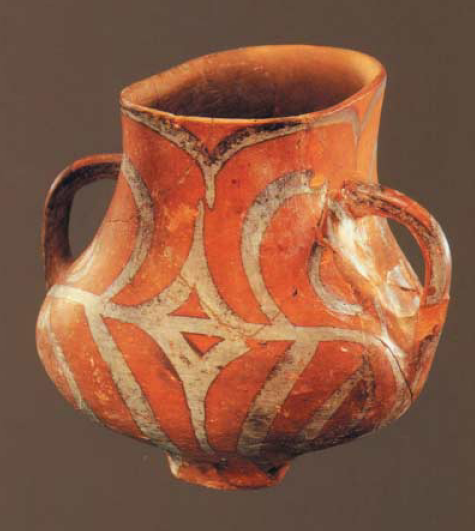
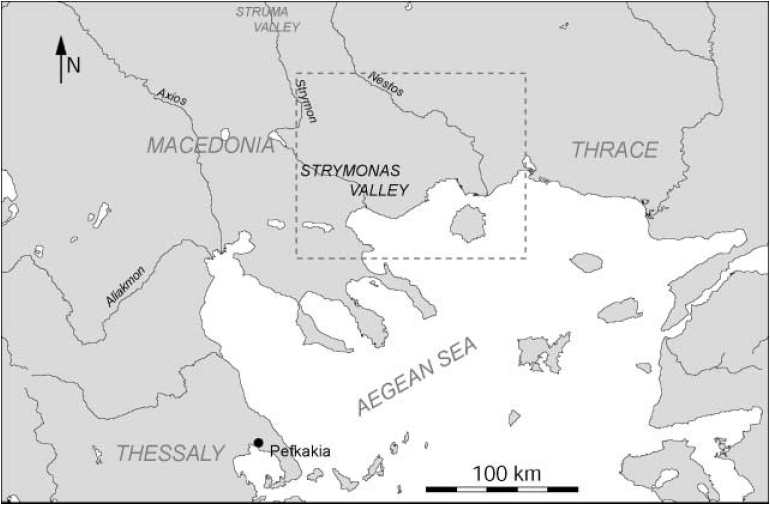
This project aimed to identify production patterns in this ceramic group and explore the degree of standardization, localization, and scale of production from 14 sites throughout the Strymonas Valley in northern Greece. A map of the area of interest is provided below in figure \(\PageIndex{6}\). NCSR “Demokritos” also sought to analyze the variations in pottery traditions by differentiating so-called ceramic recipes. By using NAA, NCSR “Demokritos” was able to determine the unique chemical make-ups of the many pottery fragments. The chemical patterning revealed through the analyses suggested that the 195 samples of black-on-red Neolithic pottery came from four distinct productions areas with the primary production area located in the valley of the Strymon and Angitis rivers. Although distinct, the pottery from the four different geographical areas all had common technological and stylistic characteristics, which suggests that a level of standardization did exist throughout the area of interest during the late Neolithic age.
Determining elemental concentrations in blood
Additionally, NAA has been used in hematology laboratories to determine specific elemental concentrations in blood and provide information to aid in the diagnosis and treatment of patients. Identifying abnormalities and unusual concentrations of certain elements in the bloodstream can also aid in the prediction of damage to the organ systems of the human body.
In one study, NAA was used to determine the concentrations of sodium and chlorine in blood serum. In order to investigate the accuracy of the technique in this setting, 26 blood samples of healthy male and female donors – aged between 25 and 60 years and weighing between 50 and 85 kilograms – were selected from the Paulista Blood Bank in São Paulo. The samples were initially irradiated for 2 minutes at a neutron flux ranging from approximately 1 x 10¹¹ to 6 x 10¹¹ neutrons cm-2 s-1 and counted for 10 minutes using a gold activation detector. The procedure was later repeated using a longer irradiation time of 10 minutes. The determined concentrations of sodium and chlorine were then compared to standard values. The NAA analyses resulted in concentrations that strongly agreed with the adopted reference value. For example, the chlorine concentration was found to be 3.41 - 3.68 µg/µL of blood, which correlates closely to the reference value of 3.44 - 3.76 µg/µL of blood. This illustrates that NAA can accurately measure elemental concentrations in a variety of materials including blood samples.
Limitations
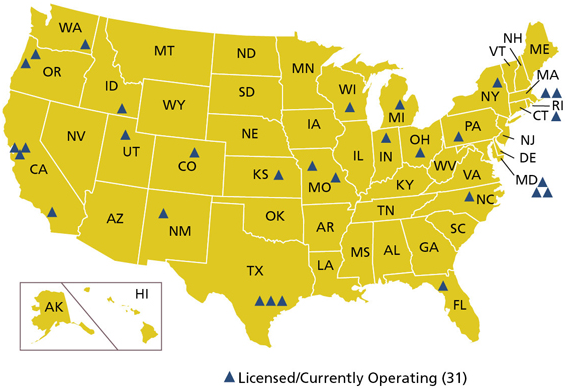
Although NAA is an accurate (~5%) and precise (<0.1%) multi-element analytical technique, it has several limitations that should be addressed. Firstly, samples irradiated in NAA will remain radioactive for a period of time (often years) following the analysis procedures. These radioactive samples require special handling and disposal protocols. Secondly, the number of the available nuclear reactors has declined in recent years. In the United States, only 31 nuclear research and test reactors are currently licensed and operating. A map of these reactors shown here.
As a result of the declining number of reactors and irradiation facilities in the nation, the cost of neutron activation analysis has increased. The popularity of NAA has declined in recent decades due to both the increasing cost and the development of other successful multi-element analytical methods such as inductively coupled plasma atomic emission spectroscopy (ICP-AES).
Bibliography
- Z. B. Alfassi, Activation Analysis, CRC Press, Boca Raton (1990).
- P. Bode, A. Byrne, Z. Chai, A. Chatt, V. Dimic, T. Z. Hossain, J. Kučera, G. C. Lalor, and R. Parthasarathy, Report of an Advisory Group Meeting Held in Vienna, 22-26 June 1998, IAEA, Vienna, 2001, 1.
- V. P. Guinn, Bio. Trace Elem. Res., 1990, 26-27, 1.
- L. Hamidatou, H. Slamene, T. Akhal, and B. Zouranen, Imaging and Radioanalytical Techniques in Interdisciplinary Research – Fundamentals and Cutting Edge Applications, ed. F. Kharfi, InTech, Rijeka (2013).
- V. Kilikoglou, A. P. Grimanis, A. Tsolakidou, A. Hein, D. Malalmidou, and Z. Tsirtsoni, Archaeometry, 2007, 49, 301.
- S. S. Nargolwalla and E. P. Przybylowicz, Activation Analysis with Neutron Generators, Wiley, New York, 39th edn. (1973).
- M. Pollard and C. Heron, Archaeological Chemistry, Royal Society of Chemistry, Cambridge (1996).
- B. Zamboi, L. C. Oliveira, and L. Dalaqua Jr., Americas Nuclear Energy Symposium, Miami, 2004.
- Neutron Activation Analysis Online, www.naa-online.net/theory/types-of-naa/, (accessed February 2014).
- Map of Research and Test Reactor Sites, www.nrc.gov/reactors/operating/map-nonpower-reactors.html, (accessed February 2014).