
1.4: Introduction to Atomic Absorption Spectroscopy
- Page ID
- 55813

\( \newcommand{\vecs}[1]{\overset { \scriptstyle \rightharpoonup} {\mathbf{#1}} } \)
\( \newcommand{\vecd}[1]{\overset{-\!-\!\rightharpoonup}{\vphantom{a}\smash {#1}}} \)
\( \newcommand{\id}{\mathrm{id}}\) \( \newcommand{\Span}{\mathrm{span}}\)
( \newcommand{\kernel}{\mathrm{null}\,}\) \( \newcommand{\range}{\mathrm{range}\,}\)
\( \newcommand{\RealPart}{\mathrm{Re}}\) \( \newcommand{\ImaginaryPart}{\mathrm{Im}}\)
\( \newcommand{\Argument}{\mathrm{Arg}}\) \( \newcommand{\norm}[1]{\| #1 \|}\)
\( \newcommand{\inner}[2]{\langle #1, #2 \rangle}\)
\( \newcommand{\Span}{\mathrm{span}}\)
\( \newcommand{\id}{\mathrm{id}}\)
\( \newcommand{\Span}{\mathrm{span}}\)
\( \newcommand{\kernel}{\mathrm{null}\,}\)
\( \newcommand{\range}{\mathrm{range}\,}\)
\( \newcommand{\RealPart}{\mathrm{Re}}\)
\( \newcommand{\ImaginaryPart}{\mathrm{Im}}\)
\( \newcommand{\Argument}{\mathrm{Arg}}\)
\( \newcommand{\norm}[1]{\| #1 \|}\)
\( \newcommand{\inner}[2]{\langle #1, #2 \rangle}\)
\( \newcommand{\Span}{\mathrm{span}}\) \( \newcommand{\AA}{\unicode[.8,0]{x212B}}\)
\( \newcommand{\vectorA}[1]{\vec{#1}} % arrow\)
\( \newcommand{\vectorAt}[1]{\vec{\text{#1}}} % arrow\)
\( \newcommand{\vectorB}[1]{\overset { \scriptstyle \rightharpoonup} {\mathbf{#1}} } \)
\( \newcommand{\vectorC}[1]{\textbf{#1}} \)
\( \newcommand{\vectorD}[1]{\overrightarrow{#1}} \)
\( \newcommand{\vectorDt}[1]{\overrightarrow{\text{#1}}} \)
\( \newcommand{\vectE}[1]{\overset{-\!-\!\rightharpoonup}{\vphantom{a}\smash{\mathbf {#1}}}} \)
\( \newcommand{\vecs}[1]{\overset { \scriptstyle \rightharpoonup} {\mathbf{#1}} } \)
\( \newcommand{\vecd}[1]{\overset{-\!-\!\rightharpoonup}{\vphantom{a}\smash {#1}}} \)
\(\newcommand{\avec}{\mathbf a}\) \(\newcommand{\bvec}{\mathbf b}\) \(\newcommand{\cvec}{\mathbf c}\) \(\newcommand{\dvec}{\mathbf d}\) \(\newcommand{\dtil}{\widetilde{\mathbf d}}\) \(\newcommand{\evec}{\mathbf e}\) \(\newcommand{\fvec}{\mathbf f}\) \(\newcommand{\nvec}{\mathbf n}\) \(\newcommand{\pvec}{\mathbf p}\) \(\newcommand{\qvec}{\mathbf q}\) \(\newcommand{\svec}{\mathbf s}\) \(\newcommand{\tvec}{\mathbf t}\) \(\newcommand{\uvec}{\mathbf u}\) \(\newcommand{\vvec}{\mathbf v}\) \(\newcommand{\wvec}{\mathbf w}\) \(\newcommand{\xvec}{\mathbf x}\) \(\newcommand{\yvec}{\mathbf y}\) \(\newcommand{\zvec}{\mathbf z}\) \(\newcommand{\rvec}{\mathbf r}\) \(\newcommand{\mvec}{\mathbf m}\) \(\newcommand{\zerovec}{\mathbf 0}\) \(\newcommand{\onevec}{\mathbf 1}\) \(\newcommand{\real}{\mathbb R}\) \(\newcommand{\twovec}[2]{\left[\begin{array}{r}#1 \\ #2 \end{array}\right]}\) \(\newcommand{\ctwovec}[2]{\left[\begin{array}{c}#1 \\ #2 \end{array}\right]}\) \(\newcommand{\threevec}[3]{\left[\begin{array}{r}#1 \\ #2 \\ #3 \end{array}\right]}\) \(\newcommand{\cthreevec}[3]{\left[\begin{array}{c}#1 \\ #2 \\ #3 \end{array}\right]}\) \(\newcommand{\fourvec}[4]{\left[\begin{array}{r}#1 \\ #2 \\ #3 \\ #4 \end{array}\right]}\) \(\newcommand{\cfourvec}[4]{\left[\begin{array}{c}#1 \\ #2 \\ #3 \\ #4 \end{array}\right]}\) \(\newcommand{\fivevec}[5]{\left[\begin{array}{r}#1 \\ #2 \\ #3 \\ #4 \\ #5 \\ \end{array}\right]}\) \(\newcommand{\cfivevec}[5]{\left[\begin{array}{c}#1 \\ #2 \\ #3 \\ #4 \\ #5 \\ \end{array}\right]}\) \(\newcommand{\mattwo}[4]{\left[\begin{array}{rr}#1 \amp #2 \\ #3 \amp #4 \\ \end{array}\right]}\) \(\newcommand{\laspan}[1]{\text{Span}\{#1\}}\) \(\newcommand{\bcal}{\cal B}\) \(\newcommand{\ccal}{\cal C}\) \(\newcommand{\scal}{\cal S}\) \(\newcommand{\wcal}{\cal W}\) \(\newcommand{\ecal}{\cal E}\) \(\newcommand{\coords}[2]{\left\{#1\right\}_{#2}}\) \(\newcommand{\gray}[1]{\color{gray}{#1}}\) \(\newcommand{\lgray}[1]{\color{lightgray}{#1}}\) \(\newcommand{\rank}{\operatorname{rank}}\) \(\newcommand{\row}{\text{Row}}\) \(\newcommand{\col}{\text{Col}}\) \(\renewcommand{\row}{\text{Row}}\) \(\newcommand{\nul}{\text{Nul}}\) \(\newcommand{\var}{\text{Var}}\) \(\newcommand{\corr}{\text{corr}}\) \(\newcommand{\len}[1]{\left|#1\right|}\) \(\newcommand{\bbar}{\overline{\bvec}}\) \(\newcommand{\bhat}{\widehat{\bvec}}\) \(\newcommand{\bperp}{\bvec^\perp}\) \(\newcommand{\xhat}{\widehat{\xvec}}\) \(\newcommand{\vhat}{\widehat{\vvec}}\) \(\newcommand{\uhat}{\widehat{\uvec}}\) \(\newcommand{\what}{\widehat{\wvec}}\) \(\newcommand{\Sighat}{\widehat{\Sigma}}\) \(\newcommand{\lt}{<}\) \(\newcommand{\gt}{>}\) \(\newcommand{\amp}{&}\) \(\definecolor{fillinmathshade}{gray}{0.9}\)Brief overview of atomic absorption spectroscopy
History of atomic absorption spectroscopy
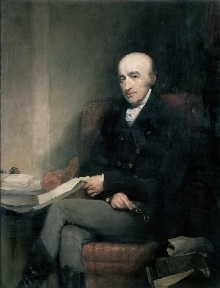
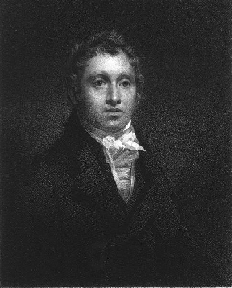
The earliest spectroscopy was first described by Marcus Marci von Kronland in 1648 by analyzing sunlight as is passed through water droplets and thus creating a rainbow. Further analysis of sunlight by William Hyde Wollaston (Figure \(\PageIndex{1}\)) led to the discovery of black lines in the spectrum, which in 1820 Sir David Brewster (Figure \(\PageIndex{2}\)) explained as absorption of light in the sun’s atmosphere.
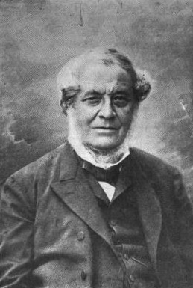
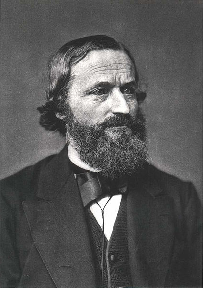
Robert Bunsen (Figure \(\PageIndex{3}\)) and Gustav Kirchhoff (Figure \(\PageIndex{4}\)) studied the sodium spectrum and came to the conclusion that every element has its own unique spectrum that can be used to identify elements in the vapor phase. Kirchoff further explained the phenomenon by stating that if a material can emit radiation of a certain wavelength, that it may also absorb radiation of that wavelength. Although Bunsen and Kirchoff took a large step in defining the technique of atomic absorption spectroscopy (AAS), it was not widely utilized as an analytical technique except in the field of astronomy due to many practical difficulties.
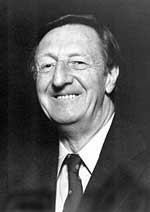
In 1953, Alan Walsh (Figure \(\PageIndex{5}\)) drastically improved the AAS methods. He advocated AAS to many instrument manufacturers, but to no avail. Although he had improved the methods, he hadn’t shown how it could be useful in any applications. In 1957, he discovered uses for AAS that convinced manufactures market the first commercial AAS spectrometers. Since that time, AAS's popularity has fluctuated as other analytical techniques and improvements to the methods are made.
Theory of atomic absorption spectroscopy
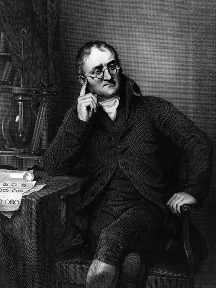
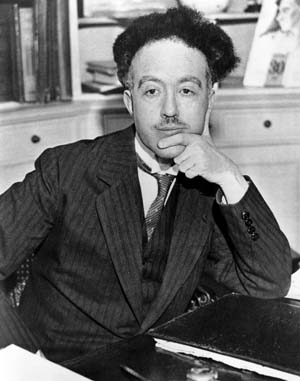
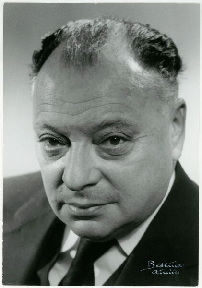
In order to understand how atomic absorption spectroscopy works, some background information is necessary. Atomic theory began with John Dalton (Figure \(\PageIndex{6}\)) in the 18th century when he proposed the concept of atoms, that all atoms of an element are identical, and that atoms of different elements can combine to form molecules. In 1913, Niels Bohr (Figure \(\PageIndex{7}\)) revolutionized atomic theory by proposing quantum numbers, a positively charged nucleus, and electrons orbiting around the nucleus in the what became known as the Bohr model of the atom. Soon afterward, Louis deBroglie (Figure \(\PageIndex{8}\)) proposed quantized energy of electrons, which is an extremely important concept in AAS. Wolfgang Pauli (Figure \(\PageIndex{9}\)) then elaborated on deBroglie’s theory by stating that no two electrons can share the same four quantum numbers. These landmark discoveries in atomic theory are necessary in understanding the mechanism of AAS.

Atoms have valence electrons, which are the outermost electrons of the atom. Atoms can be excited when irradiated, which creates an absorption spectrum. When an atom is excited, the valence electron moves up an energy level. The energies of the various stationary states, or restricted orbits, can then be determined by these emission lines. The resonance line is then defined as the specific radiation absorbed to reach the excited state.
The Maxwell-Boltzmann equation gives the number of electrons in any given orbital. It relates the distribution to the thermal temperature of the system (as opposed to electronic temperature, vibrational temperature, or rotational temperature). Plank proposed radiation emitted energy in discrete packets (quanta),
\[ E= h \nu \nonumber \]
which can be related to Einstein’s equation
\[ E=mc^2 \label{eq:mc2} \]
Both atomic emission and atomic absorption spectroscopy can be used to analyze samples. Atomic emission spectroscopy measures the intensity of light emitted by the excited atoms, while atomic absorption spectroscopy measures the light absorbed by atomic absorption. This light is typically in the visible or ultraviolet region of the electromagnetic spectrum. The percentage is then compared to a calibration curve to determine the amount of material in the sample. The energy of the system can be used to find the frequency of the radiation, and thus the wavelength through the combination of equations \ref{eq:mc2} and \ref{eq:ncl}.
\[ \nu = c/\lambda \label{eq:ncl} \]
Because the energy levels are quantized, only certain wavelengths are allowed and each atom has a unique spectrum. There are many variables that can affect the system. For example, if the sample is changed in a way that increases the population of atoms, there will be an increase in both emission and absorption and vice versa. There are also variables that affect the ratio of excited to unexcited atoms such as an increase in temperature of the vapor.
Applications of Atomic Absorption Spectroscopy
There are many applications of atomic absorption spectroscopy (AAS) due to its specificity. These can be divided into the broad categories of biological analysis, environmental and marine analysis, and geological analysis.
Biological analysis
Biological samples can include both human tissue samples and food samples. In human tissue samples, AAS can be used to determine the amount of various levels of metals and other electrolytes, within tissue samples. These tissue samples can be many things including but not limited to blood, bone marrow, urine, hair, and nails. Sample preparation is dependent upon the sample. This is extremely important in that many elements are toxic in certain concentrations in the body, and AAS can analyze what concentrations they are present in. Some examples of trace elements that samples are analyzed for are arsenic, mercury, and lead.
An example of an application of AAS to human tissue is the measurement of the electrolytes sodium and potassium in plasma. This measurement is important because the values can be indicative of various diseases when outside of the normal range. The typical method used for this analysis is atomization of a 1:50 dilution in strontium chloride (\(\ce{SrCl2}\)) using an air-hydrogen flame. The sodium is detected at its secondary line (330.2 nm) because detection at the first line would require further dilution of the sample due to signal intensity. The reason that strontium chloride is used is because it reduces ionization of the potassium and sodium ions, while eliminating phosphate’s and calcium’s interference.
In the food industry, AAS provides analysis of vegetables, animal products, and animal feeds. These kinds of analyses are some of the oldest application of AAS. An important consideration that needs to be taken into account in food analysis is sampling. The sample should be an accurate representation of what is being analyzed. Because of this, it must be homogenous, and many it is often needed that several samples are run. Food samples are most often run in order to determine mineral and trace element amounts so that consumers know if they are consuming an adequate amount. Samples are also analyzed to determine heavy metals which can be detrimental to consumers.
Environmental and marine analysis
Environmental and marine analysis typically refers to water analysis of various types. Water analysis includes many things ranging from drinking water to waste water to sea water. Unlike biological samples, the preparation of water samples is governed more by laws than by the sample itself. The analytes that can be measured also vary greatly and can often include lead, copper, nickel, and mercury.
An example of water analysis is an analysis of leaching of lead and zinc from tin-lead solder into water. The solder is what binds the joints of copper pipes. In this particular experiment, soft water, acidic water, and chlorinated water were all analyzed. The sample preparation consisted of exposing the various water samples to copper plates with solder for various intervals of time. The samples were then analyzed for copper and zinc with air-acetylene flame AAS. A deuterium lamp was used. For the samples that had copper levels below 100 µg/L, the method was changed to graphite furnace electrothermal AAS due to its higher sensitivity.
Geological analysis
Geological analysis encompasses both mineral reserves and environmental research. When prospecting mineral reserves, the method of AAS used needs to be cheap, fast, and versatile because the majority of prospects end up being of no economic use. When studying rocks, preparation can include acid digestions or leaching. If the sample needs to have silicon content analyzed, acid digestion is not a suitable preparation method.
An example is the analysis of lake and river sediment for lead and cadmium. Because this experiment involves a solid sample, more preparation is needed than for the other examples. The sediment was first dried, then grounded into a powder, and then was decomposed in a bomb with nitric acid (\(\ce{HNO3}\)) and perchloric acid (\(\ce{HClO4}\)). Standards of lead and cadmium were prepared. Ammonium sulfate (\(\ce{[NH4][SO4]}\)]) and ammonium phosphate (\(\ce{[NH4][3PO4]}\)]) were added to the samples to correct for the interferences caused by sodium and potassium that are present in the sample. The standards and samples were then analyzed with electrothermal AAS.
Instrumentation
Atomizer
In order for the sample to be analyzed, it must first be atomized. This is an extremely important step in AAS because it determines the sensitivity of the reading. The most effective atomizers create a large number of homogenous free atoms. There are many types of atomizers, but only two are commonly used: flame and electrothermal atomizers.
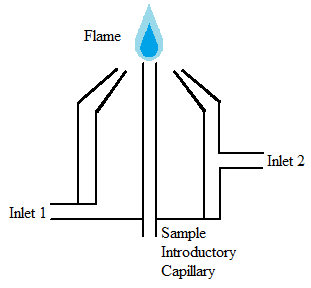
Flame atomizer
Flame atomizers (Figure \(\PageIndex{10}\)) are widely used for a multitude of reasons including their simplicity, low cost, and long length of time that they have been utilized. Flame atomizers accept an aerosol from a nebulizer into a flame that has enough energy to both volatilize and atomize the sample. When this happens, the sample is dried, vaporized, atomized, and ionized. Within this category of atomizers, there are many subcategories determined by the chemical composition of the flame. The composition of the flame is often determined based on the sample being analyzed. The flame itself should meet several requirements including sufficient energy, a long length, non-turbulent, and safe.
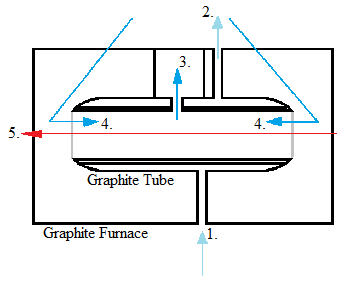
Electrothermal atomizer
Although electrothermal atomizers were developed before flame atomizers, they did not become popular until more recently due to improvements made to the detection level. They employ graphite tubes that increase temperature in a stepwise manner. Electrothermal atomization first dries the sample and evaporates much of the solvent and impurities, then atomizes the sample, and then rises it to an extremely high temperature to clean the graphite tube. Some requirements for this form of atomization are the ability to maintain a constant temperature during atomization, have rapid atomization, hold a large volume of solution, and emit minimal radiation. Electrothermal atomization is much less harsh than the method of flame atomization.
Radiation source
The radiation source then irradiates the atomized sample. The sample absorbs some of the radiation, and the rest passes through the spectrometer to a detector. Radiation sources can be separated into two broad categories: line sources and continuum sources. Line sources excite the analyte and thus emit its own line spectrum. Hollow cathode lamps and electrodeless discharge lamps are the most commonly used examples of line sources. On the other hand, continuum sources have radiation that spreads out over a wider range of wavelengths. These sources are typically only used for background correction. Deuterium lamps and halogen lamps are often used for this purpose.
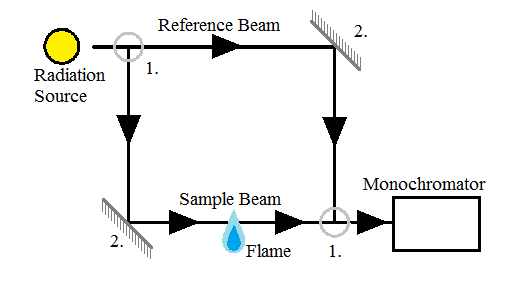
Spectrometer
Spectrometers are used to separate the different wavelengths of light before they pass to the detector. The spectrometer used in AAS can be either single-beam or double-beam. Single-beam spectrometers only require radiation that passes directly through the atomized sample, while double-beam spectrometers (Figure \(\PageIndex{12}\)), as implied by the name, require two beams of light; one that passes directly through the sample, and one that does not pass through the sample at all. (Insert diagrams) The single-beam spectrometers have less optical components and therefore suffer less radiation loss. Double-beam monochromators have more optical components, but they are also more stable over time because they can compensate for changes more readily.
Obtaining Measurements
Sample preparation
Sample preparation is extremely varied because of the range of samples that can be analyzed. Regardless of the type of sample, certain considerations should be made. These include the laboratory environment, the vessel holding the sample, storage of the sample, and pretreatment of the sample.
Sample preparation begins with having a clean environment to work in. AAS is often used to measure trace elements, in which case contamination can lead to severe error. Possible equipment includes laminar flow hoods, clean rooms, and closed, clean vessels for transportation of the sample. Not only must the sample be kept clean, it also needs to be conserved in terms of pH, constituents, and any other properties that could alter the contents.
When trace elements are stored, the material of the vessel walls can adsorb some of the analyte leading to poor results. To correct for this, perfluoroalkoxy polymers (PFA), silica, glassy carbon, and other materials with inert surfaces are often used as the storage material. Acidifying the solution with hydrochloric or nitric acid can also help prevent ions from adhering to the walls of the vessel by competing for the space. The vessels should also contain a minimal surface area in order to minimize possible adsorption sites.
Pretreatment of the sample is dependent upon the nature of the sample. See Table \(\PageIndex{1}\) for sample pretreatment methods.
| Sample | Examples | Pretreatment method |
|---|---|---|
| Aqueous solutions | Water, beverages, urine, blood | Digestion if interference causing substituents are present |
| Suspensions | Water, beverages, urine, blood | Solid matter must either be removed by filtration, centrifugation or digestion, and then the methods for aqueous solutions can be followed |
| Organic liquids | Fuels, oils | Either direct measurement with AAS or diltion with organic material followed by measurement with AAS, standards must contain the analyte in the same form as the sample |
| Solids | Foodstuffs, rocks | Digestion followed by electrothermal AAS |
Calibration curve
In order to determine the concentration of the analyte in the solution, calibration curves can be employed. Using standards, a plot of concentration versus absorbance can be created. Three common methods used to make calibration curves are the standard calibration technique, the bracketing technique, and the analyte addition technique.
Standard calibration technique
This technique is the both the simplest and the most commonly used. The concentration of the sample is found by comparing its absorbance or integrated absorbance to a curve of the concentration of the standards versus the absorbances or integrated absorbances of the standards. In order for this method to be applied the following conditions must be met:
- Both the standards and the sample must have the same behavior when atomized. If they do not, the matrix of the standards should be altered to match that of the sample.
- The error in measuring the absorbance must be smaller than that of the preparation of the standards.
- The samples must be homogeneous.
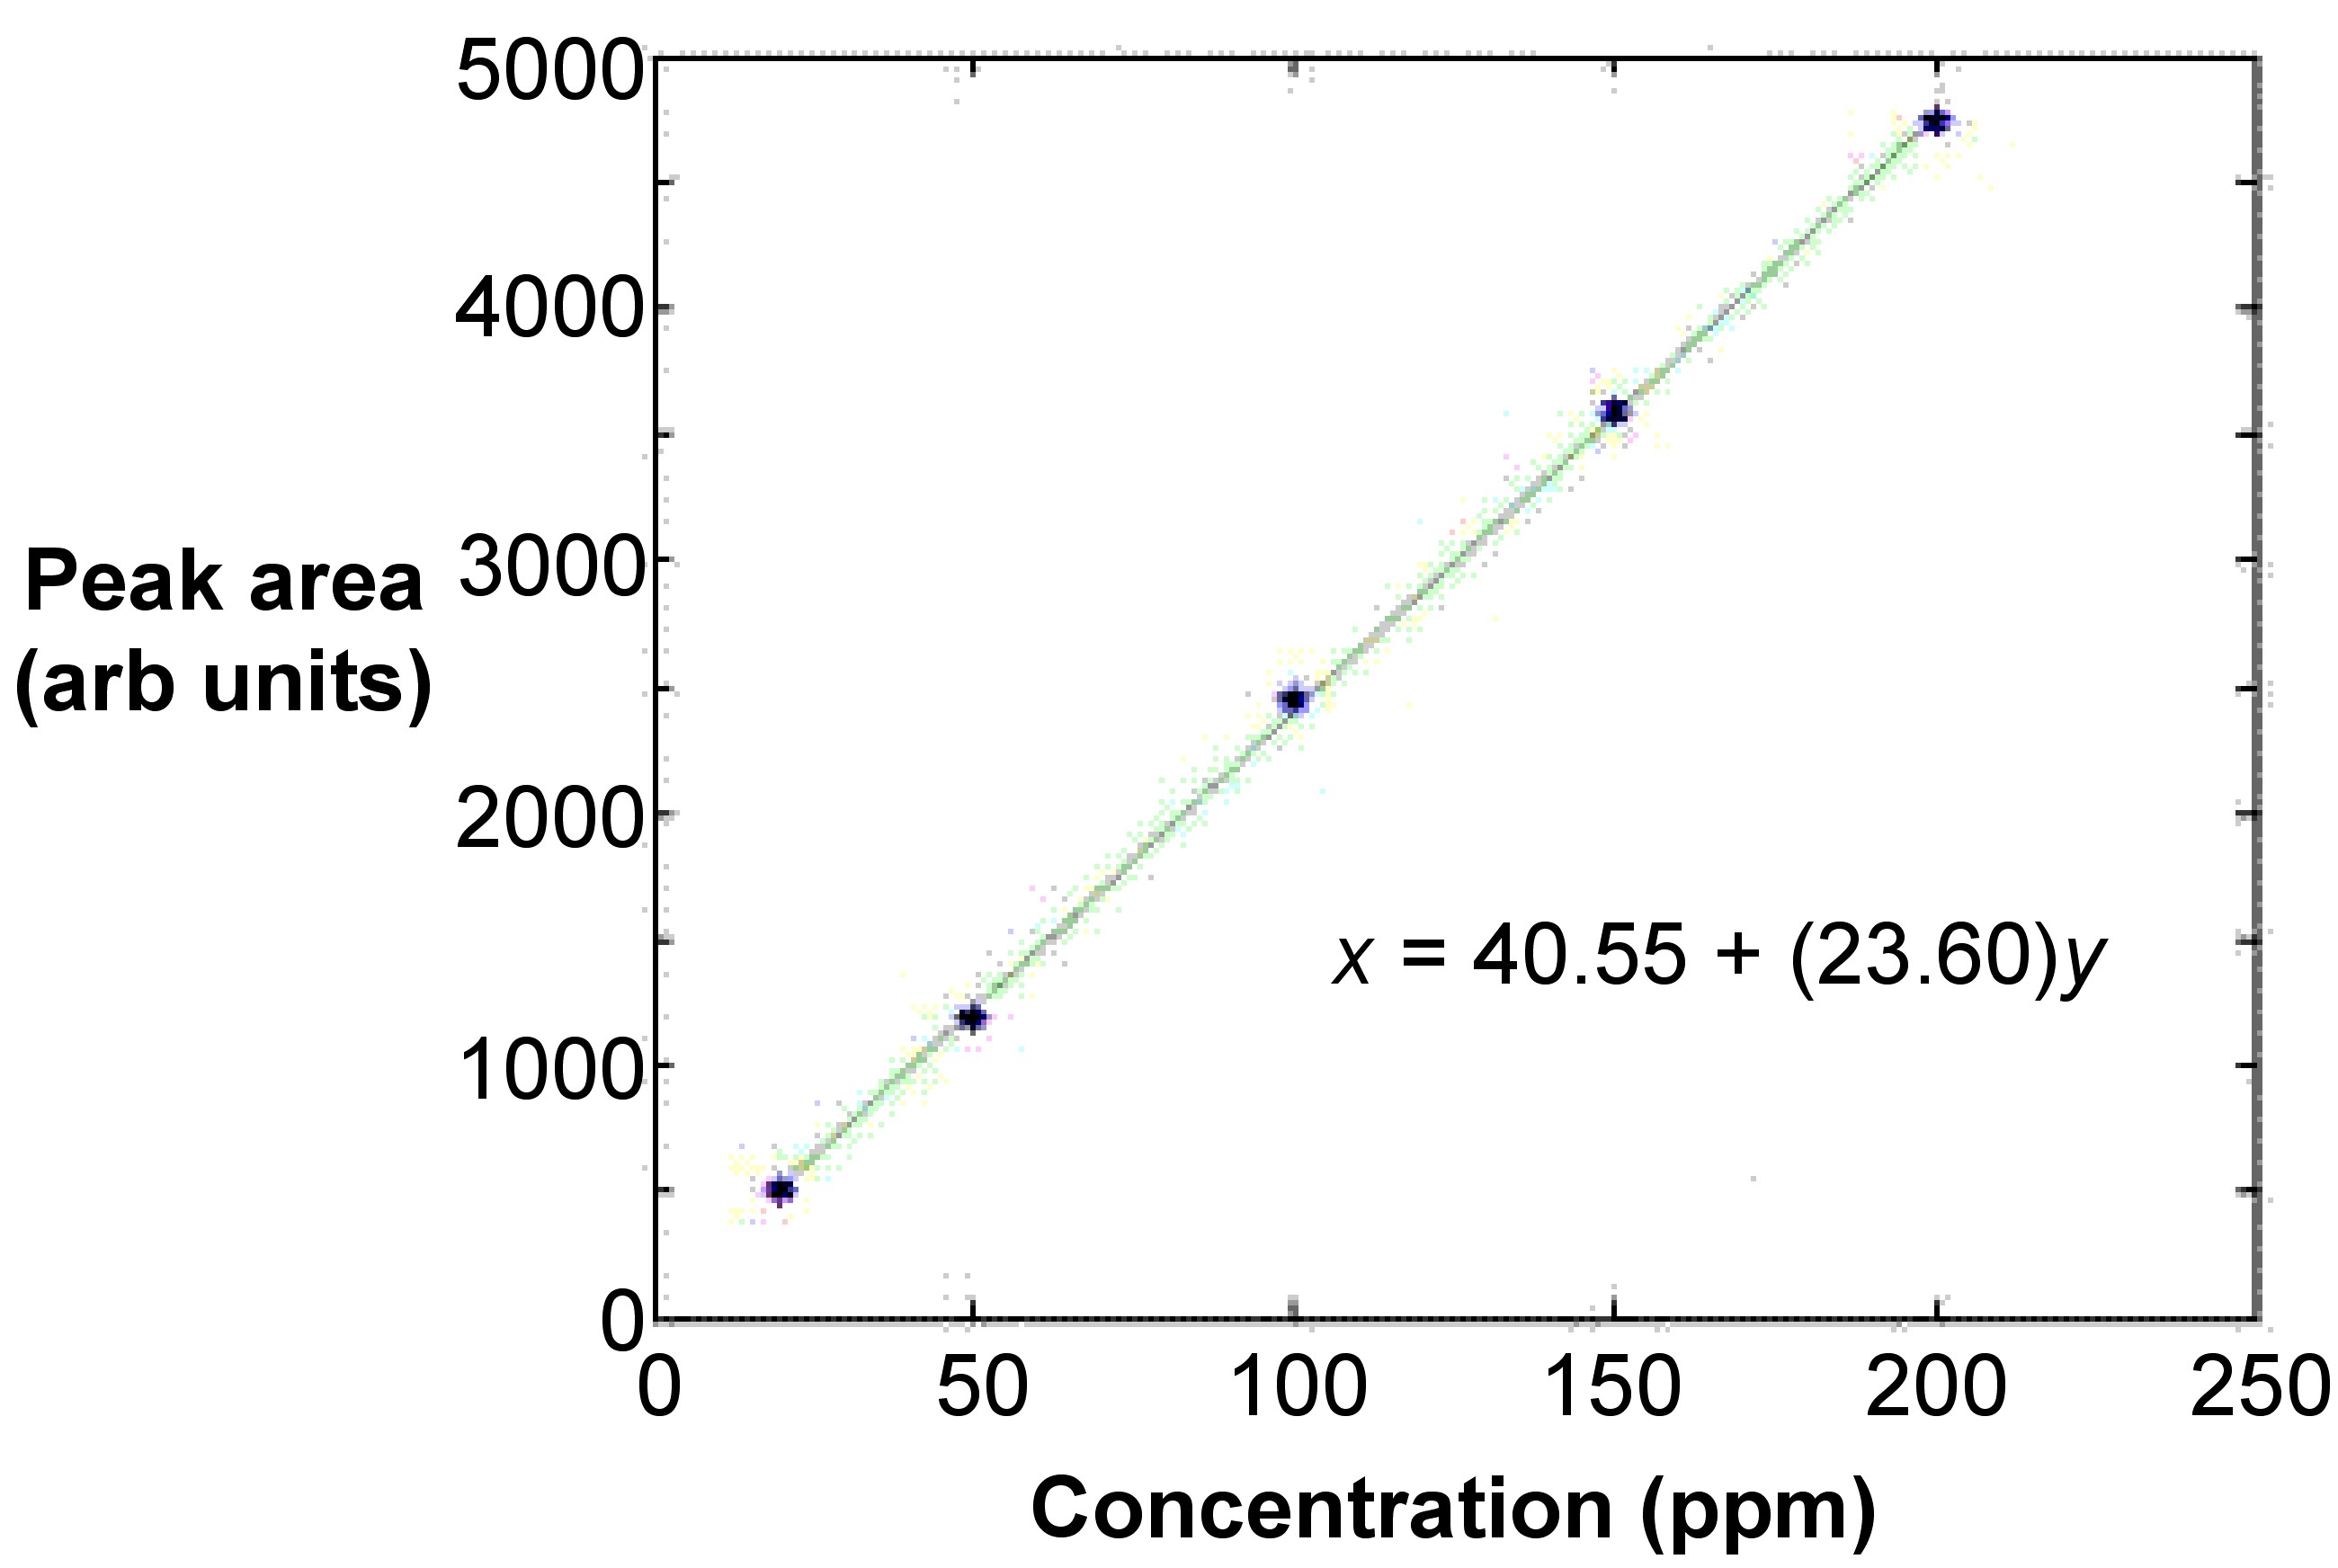
The curve is typically linear and involves at least five points from five standards that are at equidistant concentrations from each other (Figure \(\PageIndex{13}\)). This ensures that the fit is acceptable. A least means squares calculation is used to linearly fit the line. In most cases, the curve is linear only up to absorbance values of 0.5 to 0.8. The absorbance values of the standards should have the absorbance value of a blank subtracted.
Bracketing Technique
The bracketing technique is a variation of the standard calibration technique. In this method, only two standards are necessary with concentrations \(c_1\) and \(c_2\). They bracket the approximate value of the sample concentration very closely. Applying Equation \ref{bracketing } to determines the value for the sample, where \(c_x\) and \(A_x\) are the concentration and adsorbance of the unknown, and \(A_1\) and \(A_2\) are the adsorbance for \(c_1\) and \(c_2\), respectively.
\[ c _ { x } = \frac { \left( A _ { x } - A _ { 1 } \right) \left( c _ { 1 } - c _ { 2 } \right) } { A _ { 2 } - A _ { 1 } } + c _ { 1 } \label{bracketing } \]
This method is very useful when the concentration of the analyte in the sample is outside of the linear portion of the calibration curve because the bracket is so small that the portion of the curve being used can be portrayed as linear. Although this method can be used accurately for nonlinear curves, the further the curve is from linear the greater the error will be. To help reduce this error, the standards should bracket the sample very closely.
Analyte Addition Technique
The analyte addition technique is often used when the concomitants in the sample are expected to create many interferences and the composition of the sample is unknown. The previous two techniques both require that the standards have a similar matrix to that of the sample, but that is not possible when the matrix is unknown. To compensate for this, the analyte addition technique uses an aliquot of the sample itself as the matrix. The aliquots are then spiked with various amounts of the analyte. This technique must be used only within the linear range of the absorbances.
Measurement Interference
Interference is caused by contaminants within the sample that absorb at the same wavelength as the analyte, and thus can cause inaccurate measurements. Corrections can be made through a variety of methods such as background correction, addition of chemical additives, or addition of analyte.
| Interference type | Cause of interference | Result | Example | Correction measures |
|---|---|---|---|---|
| Atomic line overlap | Spectral profile of two elements are within 0.01 nm of each other | Higher experimental absorption value than the real value | Very rare, with the only plausable problem being that of copper (324.754 nm) and europium (324.753 nm) | Typically doesn't occur in practical situations, so there is no established correction method |
| Molecular band and line overlap | Spectral profile of an element overlaps with molecular band | Higher experimental absorption value than the real value | Calcium hydroxide and barium at 553.6 nm in a air-acetylene flame | Background correction |
| Ionization (vapor-phase or cation enhancement) | atoms are ionized at the temperature of the flame/furnace, which decreases the amount of free atoms | Lower experimental absorption value than real value | Problems commonly occur with cesium, potassium, and sodium | Add an ionization suppressor (or buffer) to both the sample and the standards |
| Light scattering | Solid particles scatter the beam of light lowering the intensity of the beam entering the monochromater | Higher experimental absorption value than the real value | High in samples with many refractory elements, highest at UV wavelengths (add specific example) | Matrix modifaction and/or background correction |
| Chemical | The chemical being analyzed is contained withing a compound in the analyte that is not atomized | Lower experimental absorption value than real value | Calcium and phosphate ions form calcium phosphate which is then converted to calcium pyrophosphate which is stable in high heat | Increase the temperature of the flame if flame AAS is being used, use a releasing chemical, or standard addition for electrothermal AAS |
| Physical | If physical properties of the sample and the standards are different, atomization can be affected thus affecting the number of free atom population | Can vary in either direction depending upon the conditions | Viscosity differences, surface tension differences, etc | Alter the standards to have similar physical properties to the samples |
| Volitalization | In electrothermal atomization, interference will occur if the rate of volatilization is not the same for the sample as for the standard, which is often caused by a heavy matrix | Can vary in either direction depending upon the conditions | Chlorides are very volatile, so they need to be converted to a less volatile form. Often this is done by the addition of nitrate or slufate. Zinc and lead are also highly problamatic | Change the matrix by standard addition, or selectively volatileze components of the matrix |
Bibliography
- L. Ebon, A. Fisher and S. J. Hill, An Introduction to Analytical Atomic Spectrometry, Ed. E. H. Evans, Wiley, New York (1998).
- B. Welz and M. Sperling, Atomic Absorption Spectrometry, 3rd Ed, Wiley-VCH, New York (1999).
- J. W. Robinson, Atomic Spectroscopy, 2nd Ed. Marcel Dekker, Inc., New York (1996).
- K. S. Subramanian, Water Res., 1995, 29, 1827.
- M. Sakata and O. Shimoda, Water Res., 1982, 16, 231.
- J. C. Van Loon, Analytical Atomic Absorption Spectroscopy Selected Methods, Academic Press, New York (1980).