
4.3: Fourier-Transform Infrared Spectroscopy (FT-IR)
- Page ID
- 111680

\( \newcommand{\vecs}[1]{\overset { \scriptstyle \rightharpoonup} {\mathbf{#1}} } \)
\( \newcommand{\vecd}[1]{\overset{-\!-\!\rightharpoonup}{\vphantom{a}\smash {#1}}} \)
\( \newcommand{\id}{\mathrm{id}}\) \( \newcommand{\Span}{\mathrm{span}}\)
( \newcommand{\kernel}{\mathrm{null}\,}\) \( \newcommand{\range}{\mathrm{range}\,}\)
\( \newcommand{\RealPart}{\mathrm{Re}}\) \( \newcommand{\ImaginaryPart}{\mathrm{Im}}\)
\( \newcommand{\Argument}{\mathrm{Arg}}\) \( \newcommand{\norm}[1]{\| #1 \|}\)
\( \newcommand{\inner}[2]{\langle #1, #2 \rangle}\)
\( \newcommand{\Span}{\mathrm{span}}\)
\( \newcommand{\id}{\mathrm{id}}\)
\( \newcommand{\Span}{\mathrm{span}}\)
\( \newcommand{\kernel}{\mathrm{null}\,}\)
\( \newcommand{\range}{\mathrm{range}\,}\)
\( \newcommand{\RealPart}{\mathrm{Re}}\)
\( \newcommand{\ImaginaryPart}{\mathrm{Im}}\)
\( \newcommand{\Argument}{\mathrm{Arg}}\)
\( \newcommand{\norm}[1]{\| #1 \|}\)
\( \newcommand{\inner}[2]{\langle #1, #2 \rangle}\)
\( \newcommand{\Span}{\mathrm{span}}\) \( \newcommand{\AA}{\unicode[.8,0]{x212B}}\)
\( \newcommand{\vectorA}[1]{\vec{#1}} % arrow\)
\( \newcommand{\vectorAt}[1]{\vec{\text{#1}}} % arrow\)
\( \newcommand{\vectorB}[1]{\overset { \scriptstyle \rightharpoonup} {\mathbf{#1}} } \)
\( \newcommand{\vectorC}[1]{\textbf{#1}} \)
\( \newcommand{\vectorD}[1]{\overrightarrow{#1}} \)
\( \newcommand{\vectorDt}[1]{\overrightarrow{\text{#1}}} \)
\( \newcommand{\vectE}[1]{\overset{-\!-\!\rightharpoonup}{\vphantom{a}\smash{\mathbf {#1}}}} \)
\( \newcommand{\vecs}[1]{\overset { \scriptstyle \rightharpoonup} {\mathbf{#1}} } \)
\( \newcommand{\vecd}[1]{\overset{-\!-\!\rightharpoonup}{\vphantom{a}\smash {#1}}} \)
\(\newcommand{\avec}{\mathbf a}\) \(\newcommand{\bvec}{\mathbf b}\) \(\newcommand{\cvec}{\mathbf c}\) \(\newcommand{\dvec}{\mathbf d}\) \(\newcommand{\dtil}{\widetilde{\mathbf d}}\) \(\newcommand{\evec}{\mathbf e}\) \(\newcommand{\fvec}{\mathbf f}\) \(\newcommand{\nvec}{\mathbf n}\) \(\newcommand{\pvec}{\mathbf p}\) \(\newcommand{\qvec}{\mathbf q}\) \(\newcommand{\svec}{\mathbf s}\) \(\newcommand{\tvec}{\mathbf t}\) \(\newcommand{\uvec}{\mathbf u}\) \(\newcommand{\vvec}{\mathbf v}\) \(\newcommand{\wvec}{\mathbf w}\) \(\newcommand{\xvec}{\mathbf x}\) \(\newcommand{\yvec}{\mathbf y}\) \(\newcommand{\zvec}{\mathbf z}\) \(\newcommand{\rvec}{\mathbf r}\) \(\newcommand{\mvec}{\mathbf m}\) \(\newcommand{\zerovec}{\mathbf 0}\) \(\newcommand{\onevec}{\mathbf 1}\) \(\newcommand{\real}{\mathbb R}\) \(\newcommand{\twovec}[2]{\left[\begin{array}{r}#1 \\ #2 \end{array}\right]}\) \(\newcommand{\ctwovec}[2]{\left[\begin{array}{c}#1 \\ #2 \end{array}\right]}\) \(\newcommand{\threevec}[3]{\left[\begin{array}{r}#1 \\ #2 \\ #3 \end{array}\right]}\) \(\newcommand{\cthreevec}[3]{\left[\begin{array}{c}#1 \\ #2 \\ #3 \end{array}\right]}\) \(\newcommand{\fourvec}[4]{\left[\begin{array}{r}#1 \\ #2 \\ #3 \\ #4 \end{array}\right]}\) \(\newcommand{\cfourvec}[4]{\left[\begin{array}{c}#1 \\ #2 \\ #3 \\ #4 \end{array}\right]}\) \(\newcommand{\fivevec}[5]{\left[\begin{array}{r}#1 \\ #2 \\ #3 \\ #4 \\ #5 \\ \end{array}\right]}\) \(\newcommand{\cfivevec}[5]{\left[\begin{array}{c}#1 \\ #2 \\ #3 \\ #4 \\ #5 \\ \end{array}\right]}\) \(\newcommand{\mattwo}[4]{\left[\begin{array}{rr}#1 \amp #2 \\ #3 \amp #4 \\ \end{array}\right]}\) \(\newcommand{\laspan}[1]{\text{Span}\{#1\}}\) \(\newcommand{\bcal}{\cal B}\) \(\newcommand{\ccal}{\cal C}\) \(\newcommand{\scal}{\cal S}\) \(\newcommand{\wcal}{\cal W}\) \(\newcommand{\ecal}{\cal E}\) \(\newcommand{\coords}[2]{\left\{#1\right\}_{#2}}\) \(\newcommand{\gray}[1]{\color{gray}{#1}}\) \(\newcommand{\lgray}[1]{\color{lightgray}{#1}}\) \(\newcommand{\rank}{\operatorname{rank}}\) \(\newcommand{\row}{\text{Row}}\) \(\newcommand{\col}{\text{Col}}\) \(\renewcommand{\row}{\text{Row}}\) \(\newcommand{\nul}{\text{Nul}}\) \(\newcommand{\var}{\text{Var}}\) \(\newcommand{\corr}{\text{corr}}\) \(\newcommand{\len}[1]{\left|#1\right|}\) \(\newcommand{\bbar}{\overline{\bvec}}\) \(\newcommand{\bhat}{\widehat{\bvec}}\) \(\newcommand{\bperp}{\bvec^\perp}\) \(\newcommand{\xhat}{\widehat{\xvec}}\) \(\newcommand{\vhat}{\widehat{\vvec}}\) \(\newcommand{\uhat}{\widehat{\uvec}}\) \(\newcommand{\what}{\widehat{\wvec}}\) \(\newcommand{\Sighat}{\widehat{\Sigma}}\) \(\newcommand{\lt}{<}\) \(\newcommand{\gt}{>}\) \(\newcommand{\amp}{&}\) \(\definecolor{fillinmathshade}{gray}{0.9}\)Up until this point, when recording a spectrum, we have described methods in which a monochromator is used to systematically scan through the different wavelengths or frequencies while recording either the absorbance or emission intensity. Spectra recorded in such a mode are said to be in the frequency domain. Fourier transform methods are designed in such a way that they record the spectra in the time domain. The plot in Figure \(\PageIndex{8}\) represents a particular wavelength or frequency of radiation in its time domain. What we observe in the time domain is the oscillation of the amplitude of the wave as a function of time.
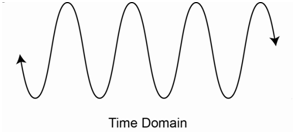
The waveform drawn above has a certain amplitude as well as a single, specific frequency. If a species in a sample could absorb this particular frequency of radiation, we would observe that the amplitude of this wave diminishes. We could then convert this to a frequency domain spectrum, which would consist of a single line as shown in Figure \(\PageIndex{9}\).
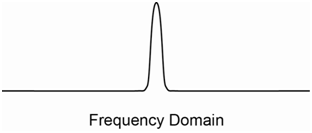
The frequency domain spectrum would have a single line at the same frequency as before, but its amplitude would be reduced.
Suppose we have a frequency domain spectrum that consisted of two single lines, each with a different frequency. The time domain spectrum of this would now consist of two waves, one for each of the frequencies. The net time domain spectrum would be the addition of those two waves. If there were many frequencies, then the time domain wave form would be a complex pattern. A Fourier transform (FT) is a mathematical procedure that can be used to determine the individual frequency components and their amplitudes that are used to construct a composite wave. The Fourier transform allows you to convert a time domain spectrum to a frequency domain spectrum.
Note that time domain spectra are difficult to interpret for either qualitative or quantitative analysis. Frequency domain spectra are more readily interpreted and used for qualitative and quantitative analysis. Yet there are certain advantages to recording a spectrum in the time domain using FT methods. The two most common spectroscopic techniques that are done in an FT mode are IR and NMR spectroscopy. These are two methods that are not the most sensitive among the various spectroscopic techniques that are available, and one advantage of FT methods is that they can be used to improve the signal-to-noise ratio.
Recording an FT-IR spectrum requires a process in which the radiation from the source is somehow converted to the time domain. The most common way of achieving this with IR radiation is to use a device known as a Michelson interferometer. A diagram of a Michelson interferometer is shown in Figure \(\PageIndex{10}\).
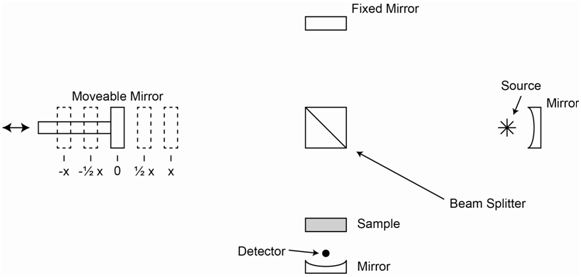
In the Michelson interferometer, radiation from the source is collimated and sent to the beam splitter. At the splitter, half of the radiation is reflected and goes to the fixed mirror. The other half is transmitted through and goes to the moveable mirror. The two beams of radiation reflect off of the two mirrors and meet back up at the beam splitter. Half of the light from the fixed mirror and half of the light from the moveable mirror recombines and goes to the sample. When the moveable mirror is at position 0, it is exactly the same distance from the beam splitter as the fixed mirror. Knowing an exact location of the 0-position is essential to the proper functioning of a Michelson interferometer. The critical factor is to consider what happens to particular wavelengths of light at the moveable mirror is moved to different positions.
Plot the intensity of radiation at the sample versus the position of the moveable mirror for monochromatic radiation of wavelength x, 2x or 4x.
An important thing to recognize in drawing these plots is that, if the mirror is at –½x, the radiation that goes to the moveable mirror travels an extra distance x compared to the radiation that goes to the fixed mirror (It travels an extra ½x to get to the moveable mirror and an extra ½x to get back to the zero position). If the two beams of radiation recombine at the beam splitter in phase with each other, they will constructively interfere. If the two beams of radiation recombine at the beam splitter out of phase with each other, they will destructively interfere. Using this information, we can then determine what mirror positions will lead to constructive and destructive interference for radiation of wavelengths x, 2x and 4x. The plots that are obtained for wavelength x, 2x and 4x are shown in Figure \(\PageIndex{11}\).
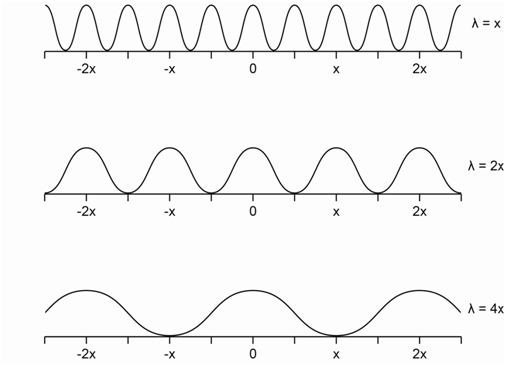
There are two important consequences from the plots in Figure \(\PageIndex{11}\). The first is that for each of these wavelengths, the intensity of the radiation at the sample oscillates from full amplitude to zero amplitude as the mirror is moved. In a Michelson interferometer, the moveable mirror is moved at a fixed speed from one extreme (e.g., +x extreme) to the other (e.g., –x extreme). After the relatively slow movement in one direction, the moveable mirror is then rapidly reset to the original position (in the example we are using, it is reset back to the +x extreme), and then moved again to record a second spectrum that is added to the first. Because the mirror moves at a set, fixed rate, the intensity of any one of these three wavelengths varies as a function of time. Each wavelength now has a time domain property associated with it.
The second important consequence is that the time domain property of radiation with wavelengths x, 2x and 4x is different. An examination of the plots in Figure \(\PageIndex{11}\) shows that the pattern of when the radiation is at full and zero amplitude is different for the radiation with wavelength x, 2x or 4x. The aggregate plot of all of these wavelengths added together is called an interferogram. If a sample could absorb infrared radiation of wavelength x, the intensity of light at this wavelength would drop after the sample and it would be reflected in the interferogram.
The usual process of recording an FT-IR spectrum is to record a background interferogram with no sample in the cell. The interferogram with a sample in the cell is then recorded and subtracted from the background interferogram. The difference is an interferogram reflecting the radiation absorbed from the sample. This time domain infrared spectrum can then be converted to a frequency domain infrared spectrum using the Fourier transform.
It is usually common to record several interferograms involving repetitive scans of the moveable mirror and then adding them together. An advantage of using multiple scans is that the signal of each scan is additive. Noise is a random process so adding together several scans leads to a reduction due to cancelling out of some of the noise. Therefore, adding together multiple scans will lead to an improvement in the signal-to-noise ratio. The improvement in the signal-to-noise ratio actually goes up as the square root of the number of scans. This means that recording twice as many scans, which takes twice as long, does not double the signal-to-noise ratio. As such, there are diminishing returns to running excessively large numbers of scans if the sample has an especially weak signal (e.g., due to a low concentration) because the time for the experiment can become excessive.
Two important characteristics of an FT-IR spectrophotometer are to have an accurate location of the zero position and a highly reproducible movement of the mirror. Identifying the exact location of the zero position and controlling the mirror movement is usually accomplished in FT-IR spectrophotometers using a laser system. With regards to mirror movement, since the position is equated with time, it is essential that the mirror move with exactly the same speed over the entire scan, and that the speed remain identical for each scan. More expensive FT-IR spectrophotometers have better control of the mirror movement.
What are the advantages of FT-IR spectrophotometers over conventional IR spectrophotometers that use a monochromator?
We have already mentioned one, which is the ease of recording multiple spectra and adding them together. Whereas a conventional scanning spectrophotometer that uses a monochromator takes several minutes to scan through the wavelengths, the mirror movement in an FT-IR occurs over a few seconds.
Another advantage is that an FT-IR has no slits and therefore has a high throughput of radiation. Essentially all of the photons from the source are used in the measurement and there are no losses of power because of the monochromator. Since IR sources have weaker power than UV and visible sources, this is an important advantage of FT-IR instruments. This is especially so in the far IR region where the source power drops off considerably.
The ability to add together multiple scans combined with the higher throughput of radiation leads to a significant sensitivity advantage of FT-IR over conventional IR spectrophotometers that use a monochromator. As such, FT-IR instruments can be used with much lower concentrations of substances.
An FT-IR will also have much better resolution than a conventional scanning IR, especially if there is reproducible movement of the mirror. Resolution is the ability to distinguish two nearby peaks in the spectrum. The more reproducible the mirror movement, the better the resolution. Distinguishing nearby frequencies is more readily accomplished by a Fourier transform of a composite time domain wave than it is using a monochromator comprised of a grating and slits.