28.4: Partition Chromatography
- Page ID
- 362587

\( \newcommand{\vecs}[1]{\overset { \scriptstyle \rightharpoonup} {\mathbf{#1}} } \)
\( \newcommand{\vecd}[1]{\overset{-\!-\!\rightharpoonup}{\vphantom{a}\smash {#1}}} \)
\( \newcommand{\dsum}{\displaystyle\sum\limits} \)
\( \newcommand{\dint}{\displaystyle\int\limits} \)
\( \newcommand{\dlim}{\displaystyle\lim\limits} \)
\( \newcommand{\id}{\mathrm{id}}\) \( \newcommand{\Span}{\mathrm{span}}\)
( \newcommand{\kernel}{\mathrm{null}\,}\) \( \newcommand{\range}{\mathrm{range}\,}\)
\( \newcommand{\RealPart}{\mathrm{Re}}\) \( \newcommand{\ImaginaryPart}{\mathrm{Im}}\)
\( \newcommand{\Argument}{\mathrm{Arg}}\) \( \newcommand{\norm}[1]{\| #1 \|}\)
\( \newcommand{\inner}[2]{\langle #1, #2 \rangle}\)
\( \newcommand{\Span}{\mathrm{span}}\)
\( \newcommand{\id}{\mathrm{id}}\)
\( \newcommand{\Span}{\mathrm{span}}\)
\( \newcommand{\kernel}{\mathrm{null}\,}\)
\( \newcommand{\range}{\mathrm{range}\,}\)
\( \newcommand{\RealPart}{\mathrm{Re}}\)
\( \newcommand{\ImaginaryPart}{\mathrm{Im}}\)
\( \newcommand{\Argument}{\mathrm{Arg}}\)
\( \newcommand{\norm}[1]{\| #1 \|}\)
\( \newcommand{\inner}[2]{\langle #1, #2 \rangle}\)
\( \newcommand{\Span}{\mathrm{span}}\) \( \newcommand{\AA}{\unicode[.8,0]{x212B}}\)
\( \newcommand{\vectorA}[1]{\vec{#1}} % arrow\)
\( \newcommand{\vectorAt}[1]{\vec{\text{#1}}} % arrow\)
\( \newcommand{\vectorB}[1]{\overset { \scriptstyle \rightharpoonup} {\mathbf{#1}} } \)
\( \newcommand{\vectorC}[1]{\textbf{#1}} \)
\( \newcommand{\vectorD}[1]{\overrightarrow{#1}} \)
\( \newcommand{\vectorDt}[1]{\overrightarrow{\text{#1}}} \)
\( \newcommand{\vectE}[1]{\overset{-\!-\!\rightharpoonup}{\vphantom{a}\smash{\mathbf {#1}}}} \)
\( \newcommand{\vecs}[1]{\overset { \scriptstyle \rightharpoonup} {\mathbf{#1}} } \)
\(\newcommand{\longvect}{\overrightarrow}\)
\( \newcommand{\vecd}[1]{\overset{-\!-\!\rightharpoonup}{\vphantom{a}\smash {#1}}} \)
\(\newcommand{\avec}{\mathbf a}\) \(\newcommand{\bvec}{\mathbf b}\) \(\newcommand{\cvec}{\mathbf c}\) \(\newcommand{\dvec}{\mathbf d}\) \(\newcommand{\dtil}{\widetilde{\mathbf d}}\) \(\newcommand{\evec}{\mathbf e}\) \(\newcommand{\fvec}{\mathbf f}\) \(\newcommand{\nvec}{\mathbf n}\) \(\newcommand{\pvec}{\mathbf p}\) \(\newcommand{\qvec}{\mathbf q}\) \(\newcommand{\svec}{\mathbf s}\) \(\newcommand{\tvec}{\mathbf t}\) \(\newcommand{\uvec}{\mathbf u}\) \(\newcommand{\vvec}{\mathbf v}\) \(\newcommand{\wvec}{\mathbf w}\) \(\newcommand{\xvec}{\mathbf x}\) \(\newcommand{\yvec}{\mathbf y}\) \(\newcommand{\zvec}{\mathbf z}\) \(\newcommand{\rvec}{\mathbf r}\) \(\newcommand{\mvec}{\mathbf m}\) \(\newcommand{\zerovec}{\mathbf 0}\) \(\newcommand{\onevec}{\mathbf 1}\) \(\newcommand{\real}{\mathbb R}\) \(\newcommand{\twovec}[2]{\left[\begin{array}{r}#1 \\ #2 \end{array}\right]}\) \(\newcommand{\ctwovec}[2]{\left[\begin{array}{c}#1 \\ #2 \end{array}\right]}\) \(\newcommand{\threevec}[3]{\left[\begin{array}{r}#1 \\ #2 \\ #3 \end{array}\right]}\) \(\newcommand{\cthreevec}[3]{\left[\begin{array}{c}#1 \\ #2 \\ #3 \end{array}\right]}\) \(\newcommand{\fourvec}[4]{\left[\begin{array}{r}#1 \\ #2 \\ #3 \\ #4 \end{array}\right]}\) \(\newcommand{\cfourvec}[4]{\left[\begin{array}{c}#1 \\ #2 \\ #3 \\ #4 \end{array}\right]}\) \(\newcommand{\fivevec}[5]{\left[\begin{array}{r}#1 \\ #2 \\ #3 \\ #4 \\ #5 \\ \end{array}\right]}\) \(\newcommand{\cfivevec}[5]{\left[\begin{array}{c}#1 \\ #2 \\ #3 \\ #4 \\ #5 \\ \end{array}\right]}\) \(\newcommand{\mattwo}[4]{\left[\begin{array}{rr}#1 \amp #2 \\ #3 \amp #4 \\ \end{array}\right]}\) \(\newcommand{\laspan}[1]{\text{Span}\{#1\}}\) \(\newcommand{\bcal}{\cal B}\) \(\newcommand{\ccal}{\cal C}\) \(\newcommand{\scal}{\cal S}\) \(\newcommand{\wcal}{\cal W}\) \(\newcommand{\ecal}{\cal E}\) \(\newcommand{\coords}[2]{\left\{#1\right\}_{#2}}\) \(\newcommand{\gray}[1]{\color{gray}{#1}}\) \(\newcommand{\lgray}[1]{\color{lightgray}{#1}}\) \(\newcommand{\rank}{\operatorname{rank}}\) \(\newcommand{\row}{\text{Row}}\) \(\newcommand{\col}{\text{Col}}\) \(\renewcommand{\row}{\text{Row}}\) \(\newcommand{\nul}{\text{Nul}}\) \(\newcommand{\var}{\text{Var}}\) \(\newcommand{\corr}{\text{corr}}\) \(\newcommand{\len}[1]{\left|#1\right|}\) \(\newcommand{\bbar}{\overline{\bvec}}\) \(\newcommand{\bhat}{\widehat{\bvec}}\) \(\newcommand{\bperp}{\bvec^\perp}\) \(\newcommand{\xhat}{\widehat{\xvec}}\) \(\newcommand{\vhat}{\widehat{\vvec}}\) \(\newcommand{\uhat}{\widehat{\uvec}}\) \(\newcommand{\what}{\widehat{\wvec}}\) \(\newcommand{\Sighat}{\widehat{\Sigma}}\) \(\newcommand{\lt}{<}\) \(\newcommand{\gt}{>}\) \(\newcommand{\amp}{&}\) \(\definecolor{fillinmathshade}{gray}{0.9}\)Of the many forms of liquid chromatography, partition chromatography is the most common. In partition chromatography, a solute's retention time is determined by the extent to which it moves from the mobile phase into the stationary phase, and from the stationary phase back into the mobile phase. The extent of this equilibrium partitioning is determined by the polarity of the solutes, the stationary phase, and the mobile phase. In normal-phase partition chromatography, the stationary phase is polar and the mobile phase is non-polar (or of low polarity), with more polar solutes taking longer to elute as they are more strongly retained by the polar stationary phase. In reverse-phase partition chromatography, the stationary phase is non-polar and the mobile phase is polar, with more polar solutes eluting more quickly as they are less strongly retained by the stationary phase. Of the two modes, reverse-phase partition chromatography is the more common.
Stationary Phases for Partition Chromatography
In partition chromatography the stationary phase is a liquid film coated on a packing material, typically 3–10 μm porous silica particles. Because the stationary phase may be partially soluble in the mobile phase, it may elute, or bleed from the column over time. To prevent the loss of stationary phase, which shortens the column’s lifetime, it is bound covalently to the silica particles. Bonded stationary phases are created by reacting the silica particles with an organochlorosilane of the general form Si(CH3)2RCl, where R is an alkyl or substituted alkyl group.

To prevent unwanted interactions between the solutes and any remaining –SiOH groups, Si(CH3)3Cl is used to convert unreacted sites to \(–\text{SiOSi(CH}_3)_3\); such columns are designated as end-capped.
The properties of a stationary phase depend on the organosilane’s alkyl group. If R is a polar functional group, then the stationary phase is polar. Examples of polar stationary phases include those where R contains a cyano (–C2H4CN), a diol (–C3H6OCH2CHOHCH2OH), or an amino (–C3H6NH2) functional group. The most common nonpolar stationary phases use an organochlorosilane where the R group is an n-octyl (C8) or n-octyldecyl (C18) hydrocarbon chain. Most reversed-phase separations are carried out using a buffered aqueous solution as a polar mobile phase, or using other polar solvents, such as methanol and acetonitrile. Because the silica substrate may undergo hydrolysis in basic solutions, the pH of the mobile phase must be less than 7.5.
It seems odd that the more common form of liquid chromatography is identified as reverse-phase instead of normal phase. One of the earliest examples of chromatography was Mikhail Tswett’s separation of plant pigments, which used a polar column of calcium carbonate and a nonpolar mobile phase of petroleum ether. The assignment of normal and reversed, therefore, is all about precedence.
Mobile Phases for Partition Chromatography
The elution order of solutes in HPLC is governed by polarity. For a normal-phase separation, a solute of lower polarity spends proportionally less time in the polar stationary phase and elutes before a solute that is more polar. Given a particular stationary phase, retention times in normal-phase HPLC are controlled by adjusting the mobile phase’s properties. For example, if the resolution between two solutes is poor, switching to a less polar mobile phase keeps the solutes on the column for a longer time and provides more opportunity for their separation. In reversed-phase HPLC the order of elution is the opposite that in a normal-phase separation, with more polar solutes eluting first. Increasing the polarity of the mobile phase leads to longer retention times. Shorter retention times require a mobile phase of lower polarity.
Choosing a Mobile Phase: Using the Polarity Index
There are several indices that help in selecting a mobile phase, one of which is the polarity index [Snyder, L. R.; Glajch, J. L.; Kirkland, J. J. Practical HPLC Method Development, Wiley-Inter- science: New York, 1988]. Table 28.4.1 provides values of the polarity index, \(P^{\prime}\), for several common mobile phases, where larger values of \(P^{\prime}\) correspond to more polar solvents. Mixing together two or more mobile phases—assuming they are miscible—creates a mobile phase of intermediate polarity. For example, a binary mobile phase made by combining solvent A and solvent B has a polarity index, \(P_{AB}^{\prime}\), of
\[P_{A B}^{\prime}=\Phi_{A} P_{A}^{\prime}+\Phi_{B} P_{B}^{\prime} \label{12.1} \]
where \(P_A^{\prime}\) and \(P_B^{\prime}\) are the polarity indices for solvents A and B, and \(\Phi_A\) and \(\Phi_B\) are the volume fractions for the two solvents.
| mobile phase | polarity index (\(P^{\prime}\)) | UV cutoff (nm) |
|---|---|---|
| cyclohexane | 0.04 | 210 |
| n-hexane | 0.1 | 210 |
| carbon tetrachloride | 1.6 | 265 |
| i-propyl ether | 2.4 | 220 |
| toluene | 2.4 | 286 |
| diethyl ether | 2.8 | 218 |
| tetrahydrofuran | 4.0 | 220 |
| ethanol | 4.3 | 210 |
| ethyl acetate | 4.4 | 255 |
| dioxane | 4.8 | 215 |
| methanol | 5.1 | 210 |
| acetonitrile | 5.8 | 190 |
| water | 10.2 | — |
A reversed-phase HPLC separation is carried out using a mobile phase of 60% v/v water and 40% v/v methanol. What is the mobile phase’s polarity index?
Solution
Using Equation \ref{12.1} and the values in Table 28.4.1 , the polarity index for a 60:40 water–methanol mixture is
\[P_{A B}^{\prime}=\Phi_\text{water} P_\text{water}^{\prime}+\Phi_\text{methanol} P_\text{methanol}^{\prime} \nonumber \]
\[P_{A B}^{\prime}=0.60 \times 10.2+0.40 \times 5.1=8.2 \nonumber \]
Suppose you need a mobile phase with a polarity index of 7.5. Explain how you can prepare this mobile phase using methanol and water.
- Answer
-
If we let x be the fraction of water in the mobile phase, then 1 – x is the fraction of methanol. Substituting these values into Equation \ref{12.1} and solving for x
\[7.5=10.2 x+5.1(1-x) \nonumber \]
\[7.5=10.2 x+5.1-5.1 x \nonumber \]
\[2.4=5.1 x \nonumber \]
gives x as 0.47. The mobile phase is 47% v/v water and 53% v/v methanol.
As a general rule, a two unit change in the polarity index corresponds to an approximately 10-fold change in a solute’s retention factor. Here is a simple example. If a solute’s retention factor, k, is 22 when using water as a mobile phase (\(P^{\prime}\) = 10.2), then switching to a mobile phase of 60:40 water–methanol (\(P^{\prime}\) = 8.2) decreases k to approximately 2.2. Note that the retention factor becomes smaller because we are switching from a more polar mobile phase to a less polar mobile phase in a reversed-phase separation.
Choosing a Mobile Phase: Adjusting Selectivity
Changing the mobile phase’s polarity index changes a solute’s retention factor. As we learned in Chapter 26.4, however, a change in k is not an effective way to improve resolution when the initial value of k is greater than 10. To effect a better separation between two solutes we must improve the selectivity factor, \(\alpha\). There are two common methods for increasing \(\alpha\): adding a reagent to the mobile phase that reacts with the solutes in a secondary equilibrium reaction or switching to a different mobile phase.
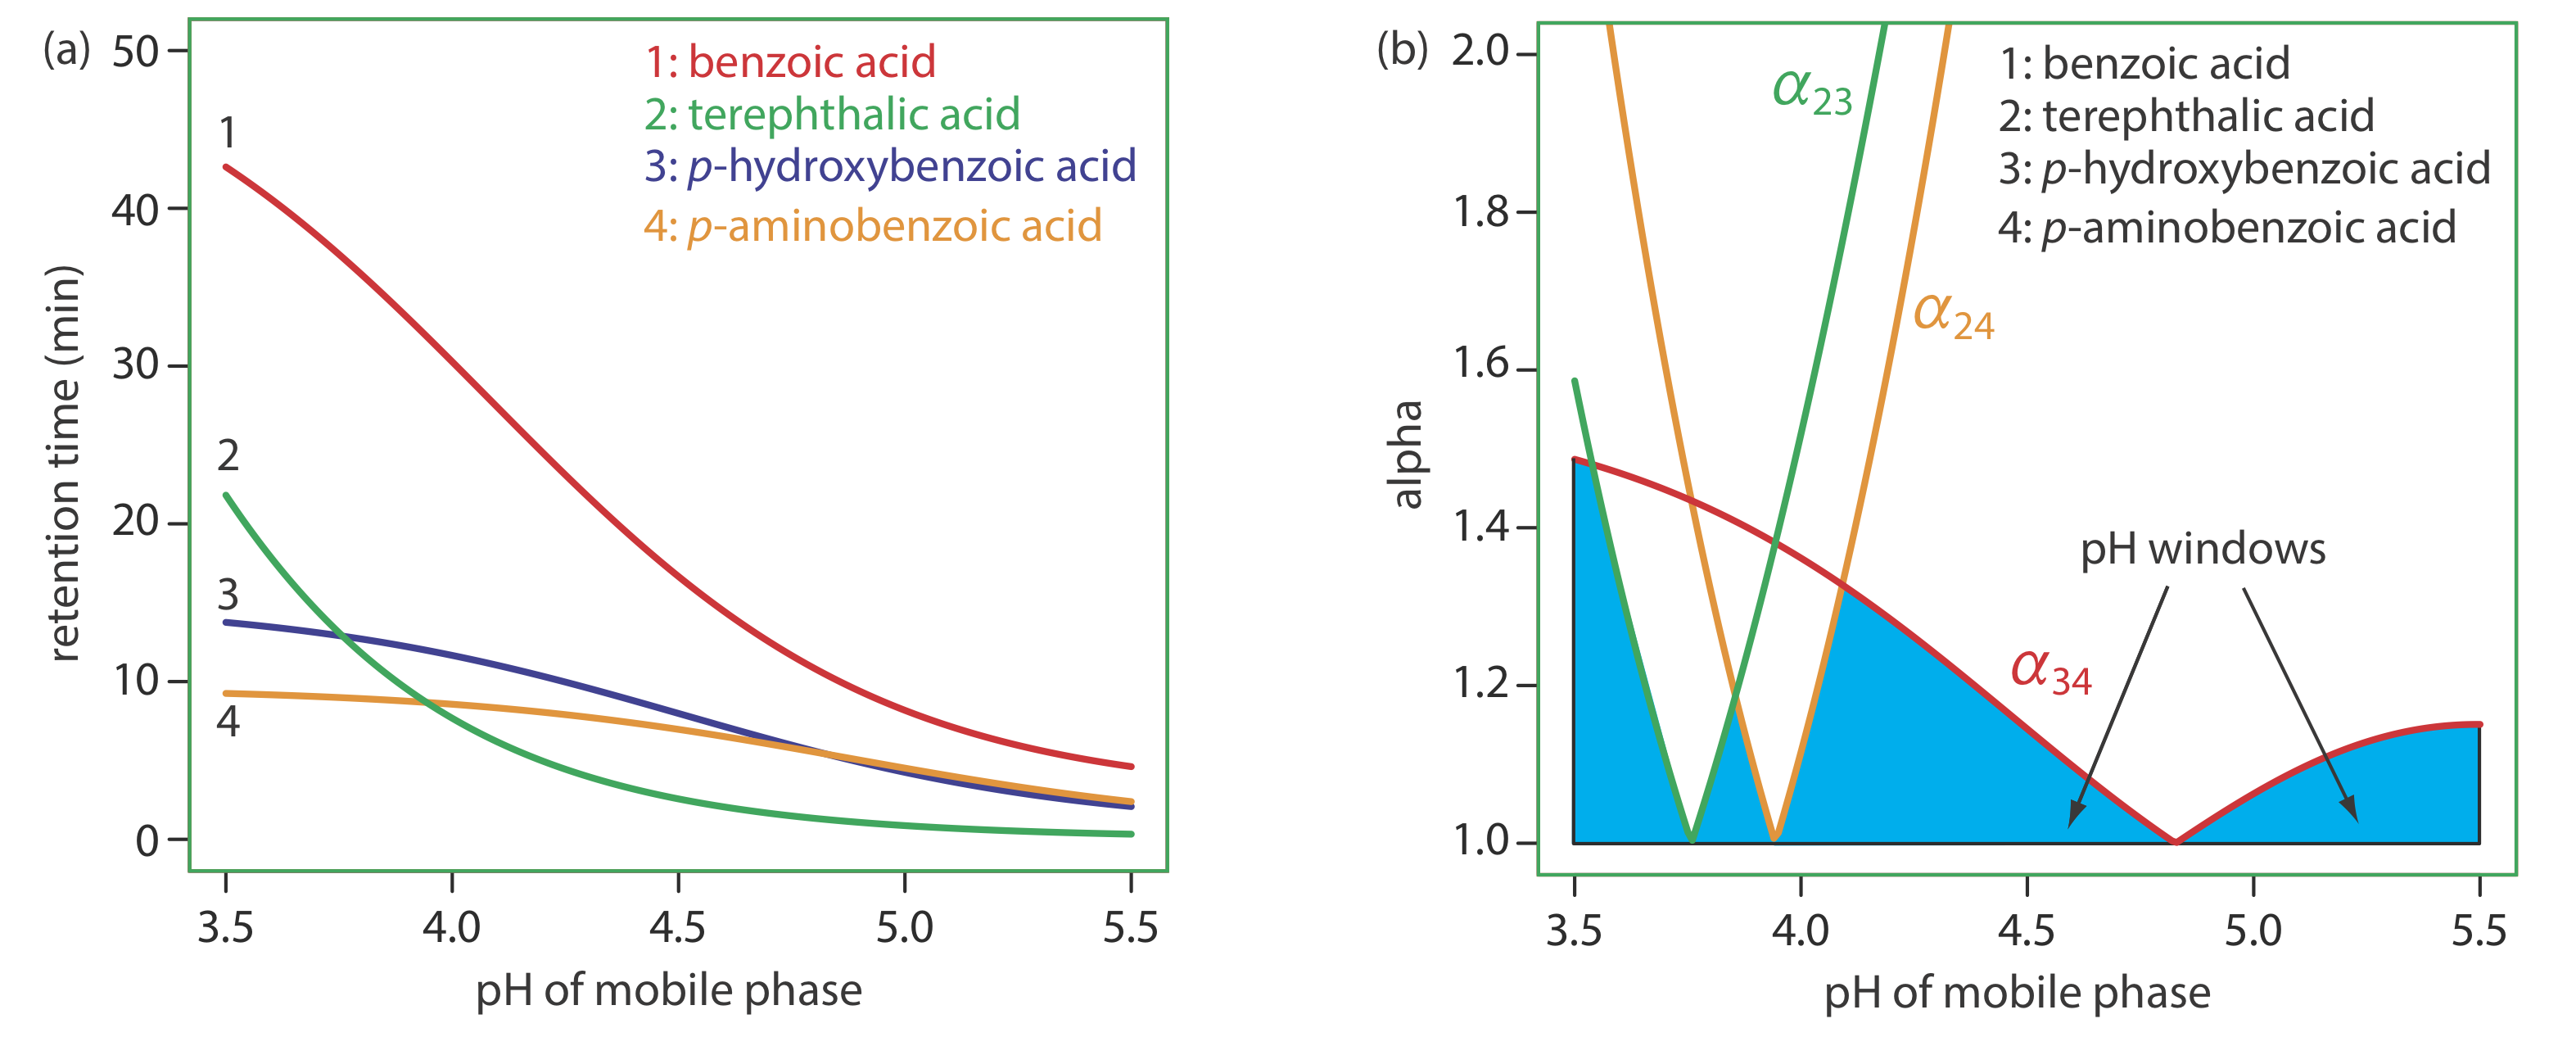
Taking advantage of a secondary equilibrium reaction is a useful strategy for improving a separation [(a) Foley, J. P. Chromatography, 1987, 7, 118–128; (b) Foley, J. P.; May, W. E. Anal. Chem. 1987, 59, 102–109; (c) Foley, J. P.; May, W. E. Anal. Chem. 1987, 59, 110–115]. Figure 28.4.1 shows the reversed-phase separation of four weak acids—benzoic acid, terephthalic acid, p-aminobenzoic acid, and p-hydroxybenzoic acid—on a nonpolar C18 column using an aqueous buffer of acetic acid and sodium acetate as the mobile phase. The retention times for these weak acids are shorter when using a less acidic mobile phase because each solute is present in an anionic, weak base form that is less soluble in the nonpolar stationary phase. If the mobile phase’s pH is sufficiently acidic, the solutes are present as neutral weak acids that are more soluble in the stationary phase and take longer to elute. Because the weak acid solutes do not have identical pKa values, the pH of the mobile phase has a different effect on each solute’s retention time, allowing us to find the optimum pH for effecting a complete separation of the four solutes.
In Example 28.4.1 we learned how to adjust the mobile phase’s polarity by blending together two solvents. A polarity index, however, is just a guide, and binary mobile phase mixtures with identical polarity indices may not resolve equally a pair of solutes. Table 28.4.2 , for example, shows retention times for four weak acids in two mobile phases with nearly identical values for \(P^{\prime}\). Although the order of elution is the same for both mobile phases, each solute’s retention time is affected differently by the choice of organic solvent. If we switch from using acetonitrile to tetrahydrofuran, for example, we find that benzoic acid elutes more quickly and that p-hydroxybenzoic acid elutes more slowly. Although we can resolve fully these two solutes using mobile phase that is 16% v/v acetonitrile, we cannot resolve them if the mobile phase is 10% tetrahydrofuran.
| retention time (min) |
16% acetonitrile (CH3CN) 84% pH 4.11 aqueous buffer (\(P^{\prime}\) = 9.5) |
10% tetrahydrofuran (THF) 90% pH 4.11 aqueous buffer (\(P^{\prime}\) = 9.6) |
|---|---|---|
| \(t_\text{r, BA}\) | 5.18 | 4.01 |
| \(t_\text{r, PH}\) | 1.67 | 2.91 |
| \(t_\text{r, PA}\) | 1.21 | 1.05 |
| \(t_\text{r, TP}\) | 0.23 | 0.54 |
|
Key: BA is benzoic acid; PH is p-hydroxybenzoic acid; PA is p-aminobenzoic acid; TP is terephthalic acid |
||
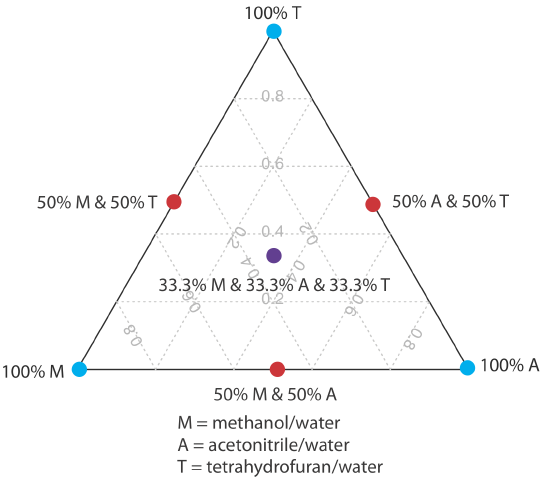
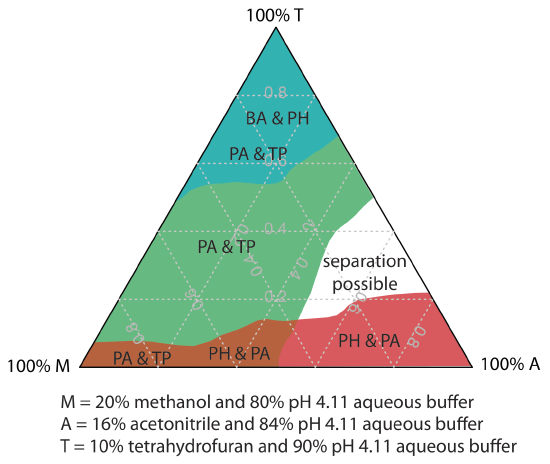
One strategy for finding the best mobile phase is to use the solvent triangle shown in Figure 28.4.2 , which allows us to explore a broad range of mobile phases with only seven experiments. We begin by adjusting the amount of acetonitrile in the mobile phase to produce the best possible separation within the desired analysis time. Next, we use Table 28.4.3 to estimate the composition of methanol/H2O and tetrahydrofuran/H2O mobile phases that will produce similar analysis times. Four additional mobile phases are prepared using the binary and ternary mobile phases shown in Figure 28.4.2 . When we examine the chromatograms from these seven mobile phases we may find that one or more provides an adequate separation, or we may identify a region within the solvent triangle where a separation is feasible. Figure 28.4.3 shows a resolution map for the reversed-phase separation of benzoic acid, terephthalic acid, p-aminobenzoic acid, and p-hydroxybenzoic acid on a nonpolar C18 column in which the maximum desired analysis time is set to 6 min [Harvey, D. T.; Byerly, S.; Bowman, A.; Tomlin, J. J. Chem. Educ. 1991, 68, 162–168]. The areas in blue, green, and red show mobile phase compositions that do not provide baseline resolution. The unshaded area represents mobile phase compositions where a separation is possible.
The choice to start with acetonitrile is arbitrary—we can just as easily choose to begin with methanol or with tetrahydrofuran.
| %v/v CH3OH | % v/v CH3CN | %v/v THF |
|---|---|---|
| 0 | 0 | 0 |
| 10 | 6 | 4 |
| 20 | 14 | 10 |
| 30 | 22 | 16 |
| 40 | 32 | 24 |
| 50 | 40 | 30 |
| 6 | 50 | 36 |
| 70 | 60 | 44 |
| 80 | 72 | 52 |
| 90 | 87 | 62 |
| 100 | 99 | 71 |
Choosing a Mobile Phase: Isocratic and Gradient Elutions
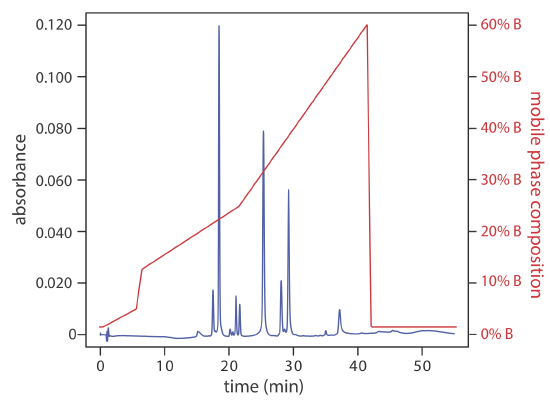
A separation using a mobile phase that has a fixed composition is an isocratic elution. One difficulty with an isocratic elution is that an appropriate mobile phase strength for resolving early-eluting solutes may lead to unacceptably long retention times for late-eluting solutes. Optimizing the mobile phase for late-eluting solutes, on the other hand, may provide an inadequate separation of early-eluting solutes. Changing the mobile phase’s composition as the separation progresses is one solution to this problem. For a reversed-phase separation we use an initial mobile phase that is more polar. As the separation progresses, we adjust the composition of mobile phase so that it becomes less polar (see Figure 28.4.4 ). Such separations are called gradient elutions.
Choosing a Detector
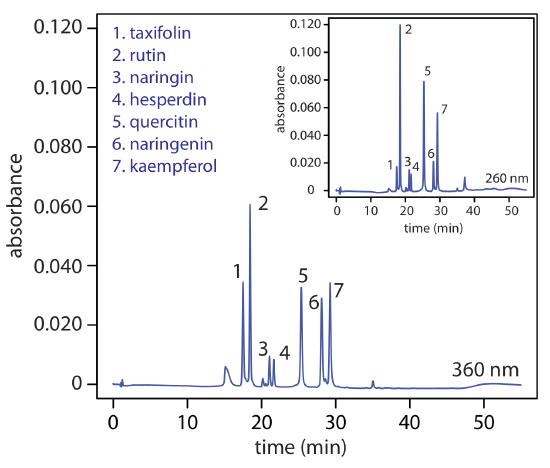
The availability of different types detectors provides another way to build selectivity into an analysis. Figure 28.4.5 , for example, shows the reverse-phase separation of a mixture of flavonoids using UV/Vis detection at two different wavelengths. In this case, a wavelength of 260 nm increases the method's sensitivity for rutin relative to that for taxifolin.
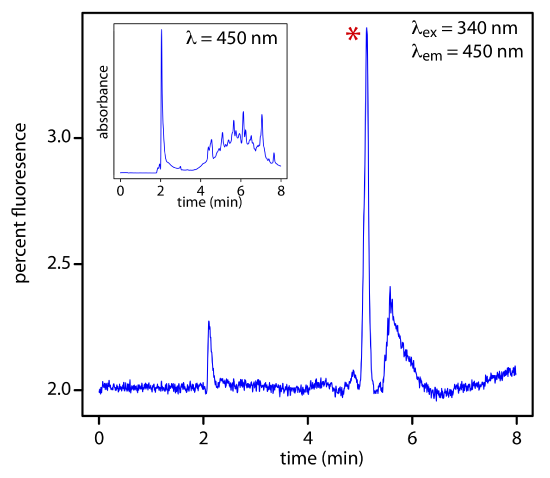
As shown in Figure 28.4.6 , a fluorescence detector provides additional selectivity because only a few of a sample’s components are fluorescent.
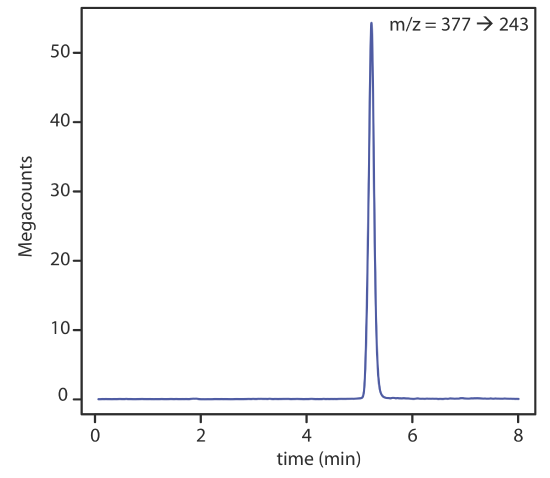
With a mass spectrometer as a detector, there are several options for monitoring the chromatogram. The most common method is to continuously scan the entire mass spectrum and report the total signal for all ions reaching the detector during each scan. This total ion scan provides universal detection for all analytes. As seen in Figure 28.4.7 , we can achieve some degree of selectivity by monitoring only specific mass-to-charge ratios, a process called selective-ion monitoring.
Quantitative Applications of Partition Chromatography
Partition chromatography is used routinely for both qualitative and quantitative analyses of environmental, pharmaceutical, industrial, forensic, clinical, and consumer product samples.
Preparing Samples for Analysis
Samples in liquid form are injected into the HPLC after a suitable clean-up to remove any particulate materials, or after a suitable extraction to remove matrix interferents. In determining polyaromatic hydrocarbons (PAH) in wastewater, for example, an extraction with CH2Cl2 serves the dual purpose of concentrating the analytes and isolating them from matrix interferents. Solid samples are first dissolved in a suitable solvent or the analytes of interest brought into solution by extraction. For example, an HPLC analysis for the active ingredients and the degradation products in a pharmaceutical tablet often begins by extracting the powdered tablet with a portion of mobile phase. Gas samples are collected by bubbling them through a trap that contains a suitable solvent. Organic isocyanates in industrial atmospheres are collected by bubbling the air through a solution of 1-(2-methoxyphenyl)piperazine in toluene. The reaction between the isocyanates and 1-(2-methoxyphenyl)piperazine both stabilizes them against degradation before the HPLC analysis and converts them to a chemical form that can be monitored by UV absorption.
Quantitative Calculations
A quantitative HPLC analysis is often easier than a quantitative GC analysis because a fixed volume sample loop provides a more precise and accurate injection. As a result, most quantitative HPLC methods do not need an internal standard and, instead, use external standards and a normal calibration curve.
An internal standard is necessary when using HPLC–MS because the interface between the HPLC and the mass spectrometer does not allow for a reproducible transfer of the column’s eluent into the MS’s ionization chamber.
The concentration of polynuclear aromatic hydrocarbons (PAH) in soil is determined by first extracting the PAHs with methylene chloride. The extract is diluted, if necessary, and the PAHs separated by HPLC using a UV/Vis or fluorescence detector. Calibration is achieved using one or more external standards. In a typical analysis a 2.013-g sample of dried soil is extracted with 20.00 mL of methylene chloride. After filtering to remove the soil, a 1.00-mL portion of the extract is removed and diluted to 10.00 mL with acetonitrile. Injecting 5 μL of the diluted extract into an HPLC gives a signal of 0.217 (arbitrary units) for the PAH fluoranthene. When 5 μL of a 20.0-ppm fluoranthene standard is analyzed using the same conditions, a signal of 0.258 is measured. Report the parts per million of fluoranthene in the soil.
Solution
For a single-point external standard, the relationship between the signal, S, and the concentration, C, of fluoranthene is
\[S = kC \nonumber \]
Substituting in values for the standard’s signal and concentration gives the value of k as
\[k=\frac{S}{C}=\frac{0.258}{20.0 \text{ ppm}}=0.0129 \text{ ppm}^{-1} \nonumber \]
Using this value for k and the sample’s HPLC signal gives a fluoranthene concentration of
\[C=\frac{S}{k}=\frac{0.217}{0.0129 \text{ ppm}^{-1}}=16.8 \text{ ppm} \nonumber \]
for the extracted and diluted soil sample. The concentration of fluoranthene in the soil is
\[\frac{16.8 \text{ g} / \mathrm{mL} \times \frac{10.00 \text{ mL}}{1.00 \text{ mL}} \times 20.00 \text{ mL}}{2.013 \text{ g} \text { sample }}=1670 \text{ ppm} \text { fluoranthene } \nonumber \]
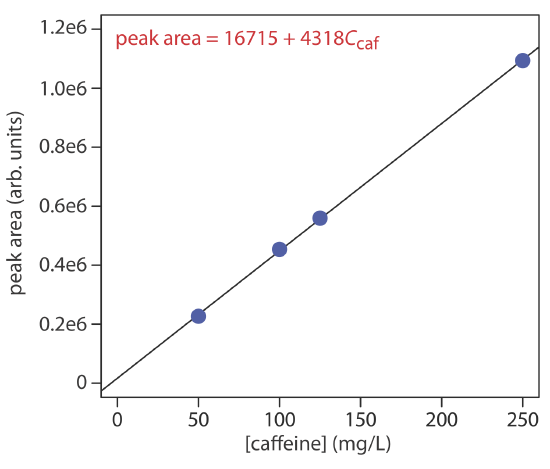
The concentration of caffeine in beverages is determined by a reversed-phase HPLC separation using a mobile phase of 20% acetonitrile and 80% water, and using a nonpolar C8 column. Results for a series of 10-μL injections of caffeine standards are in the following table.
| [caffeine] (mg/L) | peak area (arb. units) |
|---|---|
| 50.0 | 226724 |
| 100.0 | 453762 |
| 125.0 | 559443 |
| 250.0 | 1093637 |
What is the concentration of caffeine in a sample if a 10-μL injection gives a peak area of 424195? The data in this problem comes from Kusch, P.; Knupp, G. “Simultaneous Determination of Caffeine in Cola Drinks and Other Beverages by Reversed-Phase HPTLC and Reversed-Phase HPLC,” Chem. Educator, 2003, 8, 201–205.
- Answer
-
The figure below shows the calibration curve and calibration equation for the set of external standards. Substituting the sample’s peak area into the calibration equation gives the concentration of caffeine in the sample as 94.4 mg/L.