18.1: Theory of Raman Spectroscopy
- Page ID
- 386418

\( \newcommand{\vecs}[1]{\overset { \scriptstyle \rightharpoonup} {\mathbf{#1}} } \)
\( \newcommand{\vecd}[1]{\overset{-\!-\!\rightharpoonup}{\vphantom{a}\smash {#1}}} \)
\( \newcommand{\id}{\mathrm{id}}\) \( \newcommand{\Span}{\mathrm{span}}\)
( \newcommand{\kernel}{\mathrm{null}\,}\) \( \newcommand{\range}{\mathrm{range}\,}\)
\( \newcommand{\RealPart}{\mathrm{Re}}\) \( \newcommand{\ImaginaryPart}{\mathrm{Im}}\)
\( \newcommand{\Argument}{\mathrm{Arg}}\) \( \newcommand{\norm}[1]{\| #1 \|}\)
\( \newcommand{\inner}[2]{\langle #1, #2 \rangle}\)
\( \newcommand{\Span}{\mathrm{span}}\)
\( \newcommand{\id}{\mathrm{id}}\)
\( \newcommand{\Span}{\mathrm{span}}\)
\( \newcommand{\kernel}{\mathrm{null}\,}\)
\( \newcommand{\range}{\mathrm{range}\,}\)
\( \newcommand{\RealPart}{\mathrm{Re}}\)
\( \newcommand{\ImaginaryPart}{\mathrm{Im}}\)
\( \newcommand{\Argument}{\mathrm{Arg}}\)
\( \newcommand{\norm}[1]{\| #1 \|}\)
\( \newcommand{\inner}[2]{\langle #1, #2 \rangle}\)
\( \newcommand{\Span}{\mathrm{span}}\) \( \newcommand{\AA}{\unicode[.8,0]{x212B}}\)
\( \newcommand{\vectorA}[1]{\vec{#1}} % arrow\)
\( \newcommand{\vectorAt}[1]{\vec{\text{#1}}} % arrow\)
\( \newcommand{\vectorB}[1]{\overset { \scriptstyle \rightharpoonup} {\mathbf{#1}} } \)
\( \newcommand{\vectorC}[1]{\textbf{#1}} \)
\( \newcommand{\vectorD}[1]{\overrightarrow{#1}} \)
\( \newcommand{\vectorDt}[1]{\overrightarrow{\text{#1}}} \)
\( \newcommand{\vectE}[1]{\overset{-\!-\!\rightharpoonup}{\vphantom{a}\smash{\mathbf {#1}}}} \)
\( \newcommand{\vecs}[1]{\overset { \scriptstyle \rightharpoonup} {\mathbf{#1}} } \)
\( \newcommand{\vecd}[1]{\overset{-\!-\!\rightharpoonup}{\vphantom{a}\smash {#1}}} \)
\(\newcommand{\avec}{\mathbf a}\) \(\newcommand{\bvec}{\mathbf b}\) \(\newcommand{\cvec}{\mathbf c}\) \(\newcommand{\dvec}{\mathbf d}\) \(\newcommand{\dtil}{\widetilde{\mathbf d}}\) \(\newcommand{\evec}{\mathbf e}\) \(\newcommand{\fvec}{\mathbf f}\) \(\newcommand{\nvec}{\mathbf n}\) \(\newcommand{\pvec}{\mathbf p}\) \(\newcommand{\qvec}{\mathbf q}\) \(\newcommand{\svec}{\mathbf s}\) \(\newcommand{\tvec}{\mathbf t}\) \(\newcommand{\uvec}{\mathbf u}\) \(\newcommand{\vvec}{\mathbf v}\) \(\newcommand{\wvec}{\mathbf w}\) \(\newcommand{\xvec}{\mathbf x}\) \(\newcommand{\yvec}{\mathbf y}\) \(\newcommand{\zvec}{\mathbf z}\) \(\newcommand{\rvec}{\mathbf r}\) \(\newcommand{\mvec}{\mathbf m}\) \(\newcommand{\zerovec}{\mathbf 0}\) \(\newcommand{\onevec}{\mathbf 1}\) \(\newcommand{\real}{\mathbb R}\) \(\newcommand{\twovec}[2]{\left[\begin{array}{r}#1 \\ #2 \end{array}\right]}\) \(\newcommand{\ctwovec}[2]{\left[\begin{array}{c}#1 \\ #2 \end{array}\right]}\) \(\newcommand{\threevec}[3]{\left[\begin{array}{r}#1 \\ #2 \\ #3 \end{array}\right]}\) \(\newcommand{\cthreevec}[3]{\left[\begin{array}{c}#1 \\ #2 \\ #3 \end{array}\right]}\) \(\newcommand{\fourvec}[4]{\left[\begin{array}{r}#1 \\ #2 \\ #3 \\ #4 \end{array}\right]}\) \(\newcommand{\cfourvec}[4]{\left[\begin{array}{c}#1 \\ #2 \\ #3 \\ #4 \end{array}\right]}\) \(\newcommand{\fivevec}[5]{\left[\begin{array}{r}#1 \\ #2 \\ #3 \\ #4 \\ #5 \\ \end{array}\right]}\) \(\newcommand{\cfivevec}[5]{\left[\begin{array}{c}#1 \\ #2 \\ #3 \\ #4 \\ #5 \\ \end{array}\right]}\) \(\newcommand{\mattwo}[4]{\left[\begin{array}{rr}#1 \amp #2 \\ #3 \amp #4 \\ \end{array}\right]}\) \(\newcommand{\laspan}[1]{\text{Span}\{#1\}}\) \(\newcommand{\bcal}{\cal B}\) \(\newcommand{\ccal}{\cal C}\) \(\newcommand{\scal}{\cal S}\) \(\newcommand{\wcal}{\cal W}\) \(\newcommand{\ecal}{\cal E}\) \(\newcommand{\coords}[2]{\left\{#1\right\}_{#2}}\) \(\newcommand{\gray}[1]{\color{gray}{#1}}\) \(\newcommand{\lgray}[1]{\color{lightgray}{#1}}\) \(\newcommand{\rank}{\operatorname{rank}}\) \(\newcommand{\row}{\text{Row}}\) \(\newcommand{\col}{\text{Col}}\) \(\renewcommand{\row}{\text{Row}}\) \(\newcommand{\nul}{\text{Nul}}\) \(\newcommand{\var}{\text{Var}}\) \(\newcommand{\corr}{\text{corr}}\) \(\newcommand{\len}[1]{\left|#1\right|}\) \(\newcommand{\bbar}{\overline{\bvec}}\) \(\newcommand{\bhat}{\widehat{\bvec}}\) \(\newcommand{\bperp}{\bvec^\perp}\) \(\newcommand{\xhat}{\widehat{\xvec}}\) \(\newcommand{\vhat}{\widehat{\vvec}}\) \(\newcommand{\uhat}{\widehat{\uvec}}\) \(\newcommand{\what}{\widehat{\wvec}}\) \(\newcommand{\Sighat}{\widehat{\Sigma}}\) \(\newcommand{\lt}{<}\) \(\newcommand{\gt}{>}\) \(\newcommand{\amp}{&}\) \(\definecolor{fillinmathshade}{gray}{0.9}\)The blue color of the sky during the day and the red color of the sun at sunset are the result of the scattering of light by small particles of dust, by molecules of water vapor, and by other gases in the atmosphere. The efficiency of a photon's scattering depends on its wavelength. We see the sky as blue during the day because violet and blue light scatter to a greater extent than other, longer wavelengths of light. For the same reason, the sun appears red at sunset because red light scatters less efficiently and is more likely to pass through the atmosphere than other wavelengths of light. If we send a focused, monochromatic beam of radiation with a wavelength of \(\lambda\) through a medium of particles—whether solid particulates or individual molecules—that have dimensions \(<1.5 \lambda\), then the radiation scatters in all directions. For example, infrared light in the near-IR with a wavelength of 700 nm will scatter from any particle whose longest dimension is less than 1,300 nm. Even in an otherwise transparent sample, scattering from molecules occurs.
Raman Spectra
There are two general classes of scattering: elastic scattering and inelastic scattering. In elastic scattering, a photon is first absorbed by a particle and then emitted without a change in its energy (\(\Delta E = 0\)); this is called Rayleigh scattering. With inelastic scattering, a photon is first absorbed by a particle and then emitted with a change in its energy (\(\Delta E \ne 0\)); this is called Raman scattering. A plot that shows the intensity of scattered radiation as a function of the scattered photon's energy, expressed as a change in the wavenumber, \(\Delta \overline{\nu}\), is called a Raman spectrum and values of \(\Delta \overline{\nu}\) are called Raman shifts.
Figure \(\PageIndex{1}\) shows a portion of the Raman spectrum for carbon tetrachloride and illustrates several important features. First, Rayleigh scattering produces an intense peak at \(\Delta \overline{\nu} = 0\). Although the peak is intense, it carries no useful information as the absolute energy is just that for the source. Second, Raman scattering has two components—Stokes lines and the anti-Stokes lines—that have identical absolute shifts relative to the line for Rayleigh scattering, but that have different signs. The Stokes lines have positive values for \(\Delta\overline{\nu}\) and the anti-Stokes lines have negative values for \(\Delta \overline{\nu}\). Third, each of the Stokes lines is more intense than the corresponding anti-Stokes line. Fourth, because we measure the shift in a peak's wavenumber relative to the source radiation, the spectrum is independent of the source radiation.
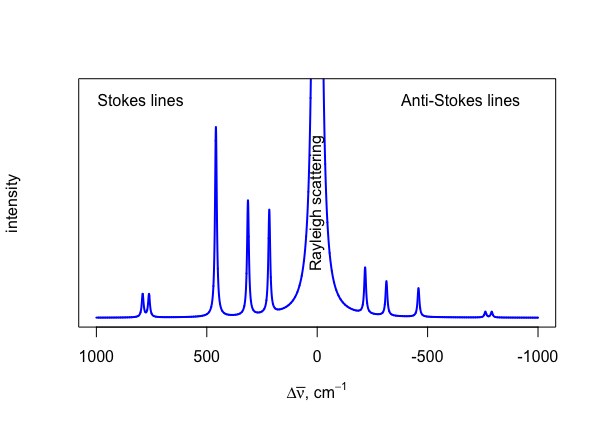
The energy—and, thus, the wavenumber—of a photon that experiences Stokes scattering is less than the energy—and, thus, the wavenumber—of the source radiation, which begs the question of why a Stokes shift is reported as a positive value instead of a negative value. Although you will find most Raman spectra with positive values for the Stokes shift, you also will find examples where Stokes shifts are reported with negative values. Because the Stokes lines are more intense than the anti-Stokes lines, and, therefore, more useful, and because their respective shifts result from the same changes in vibrational energy states that we find in IR spectroscopy, it is convenient to report the Stokes lines as positive values so that we can align a species's Raman and IR spectra. See the next two sections for additional details.
Mechanism of Raman and Rayleigh Scattering
In Chapter 6 we examined the mechanism by which absorption and emission occur. In subsequent chapters we explored atomic absorption and atomic emission spectrometry, ultraviolet and visible molecular absorption spectrometry, molecular luminescence spectrometry, and infrared molecular absorption spectrometry. In each case we began by considering an energy level diagram that explains the origin of absorption and emission. Figure \(\PageIndex{2}\) provides an energy diagram that we can use to explain the origin of the lines that make up a Raman spectrum, such as the spectrum for carbon tetrachloride in Figure \(\PageIndex{1}\).
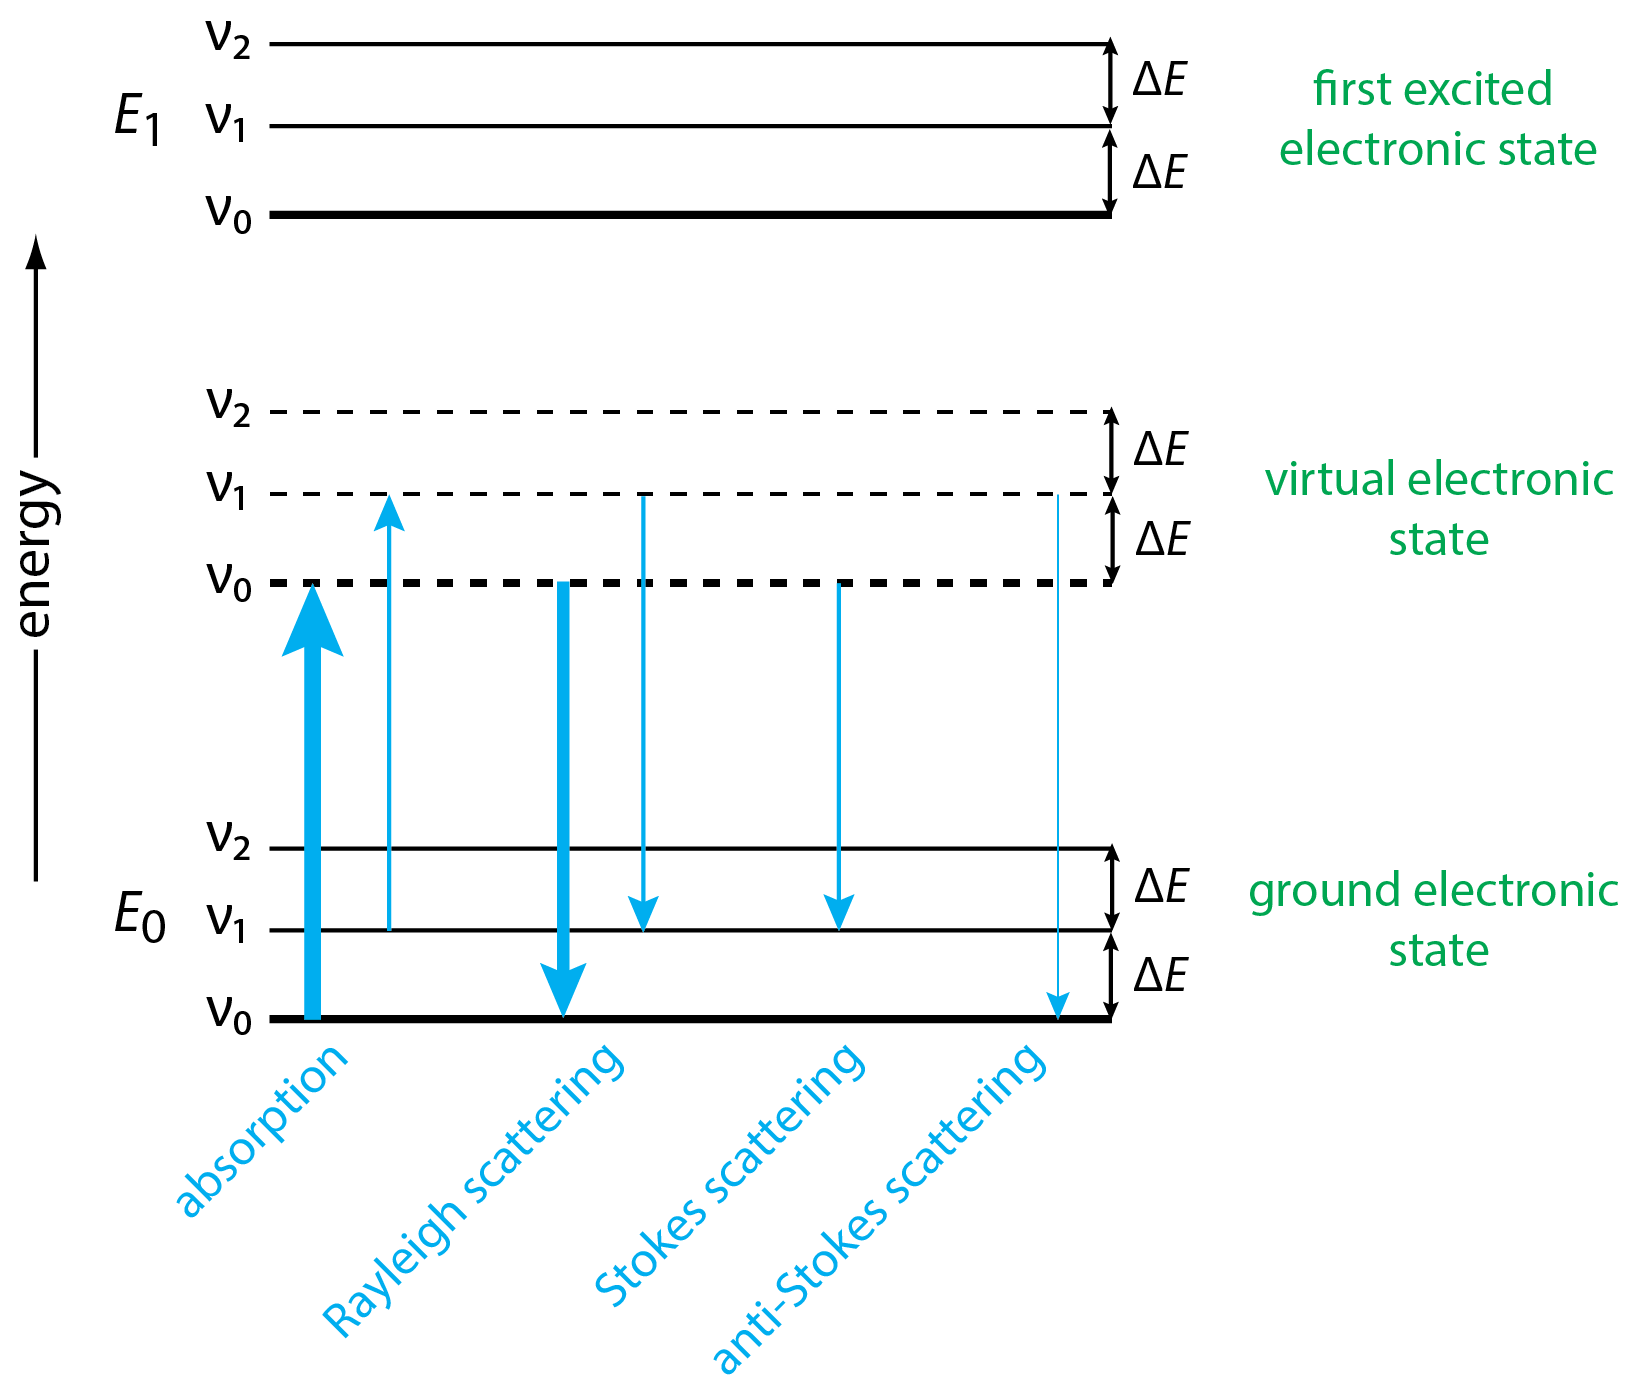
The first thing to note about the energy level diagram in Figure \(\PageIndex{2}\) is that, in addition to showing the ground electronic state and the first excited electronic state—each with three vibrational energy levels—it also shows a virtual electronic state, something we did not encounter with other methods (see, for example, the energy diagram for UV and IR molecular absorption spectrometry in Figure 6.4.2). The ground and the first excited electronic states are quantized, which means that absorption cannot happen if the source's energy does not match exactly the change in energy between the two electronic states. The energy of an emitted photon also is fixed by the difference in the energy of the two electronic states. A virtual electronic state, however, is not quantized and is determined by the energy of the source radiation. The source of radiation, therefore, does not need to match a particular change in energy.
Absorption of a photon of source radiation moves the analyte from the ground electronic state to a virtual electronic state without a change in vibrational energy state, as seen by the two arrows at the far left of the diagram. Because the ground vibrational energy state, \(\nu_0\), is more populated than the vibrational energy state, \(\nu_1\), more of the analyte ends up in a virtual electronic state's lowest vibrational energy than in a higher vibrational energy state, which is shown here by the relative thickness of the two arrows.
Once in a virtual electronic state, the analyte can return to the ground excited state in one of three ways. It can do so without a change in the vibrational energy level. In this case, the energy of absorption and the energy of emission are the same and \(\Delta E = 0\) and \(\Delta \overline{\nu} = 0\). This is Rayleigh scattering and, as suggested by the combined thickness of the two arrows in Figure \(\PageIndex{2}\), it is the most important mechanism of relaxation.
When relaxation includes a change in the vibrational energy level, the result is an absolute change in energy equivalent to the difference in energy, \(\Delta E\), between adjacent vibrational energy levels. For Stokes scattering, relaxation is to a higher vibrational energy level, such as \(\nu_0 \rightarrow \nu_1\) and, for anti-Stokes scattering, relaxation to a lower vibrational energy level, such as \(\nu_1 \rightarrow \nu_0\). As suggested by the thickness of the lines for Stokes and anti-Stokes scattering in Figure \(\PageIndex{2}\), the Stokes lines are more intense than the anti-Stokes lines because they begin in a more heavily populated excited state.
Relationship Between IR and Raman Spectra
One important feature of Figure \(\PageIndex{2}\) is that the transition that gives rise to a particular Stokes line or anti-Stokes line is the same transition that will give rise to a corresponding IR band. If the selection rules for these transitions are the same for a particular species, then we expect that its IR spectrum and its Raman spectrum will have peaks at the same (or similar) values of \(\overline{\nu}\) and \(\Delta \overline{\nu}\) for its fundamental vibrations; however, as we see in Table \(\PageIndex{1}\) for carbon tetrachloride, CCl4, there are five fundamental vibrations in its Raman spectrum, but just three in its IR spectrum.
| Infrared (\(\overline{\nu}\), cm–1) | Raman (\(\Delta \overline{\nu}\), cm–1) |
|---|---|
| — | 217.0 (l) |
| 309.9 (l) weak | 313.5 (l) |
| — | 458.7 (l) |
| 768 (g); very strong | 761.7 (l) |
| 789 (g); very strong | 790.4 (l) |
| The designations (g) and (l) indicate the sample's phase where (g) is gas phase and (l) is liquid phase. The designations of weak and very strong for the IR peaks indicates the relative extent of absorption: very strong means a relatively small %T (and a strong absorbance) and weak means a relatively large %T (and a weak absorbance). See Figure \(\PageIndex{1}\) for the relative amount of scattering in the Raman spectrum for CCl4. | |
In Chapter 16 we learned that in IR spectroscopy a compound's fundamental vibrational energy is active—that is, we see a peak in its IR spectrum—only if the corresponding stretch or bend results in a change in the compound's dipole moment. For Raman spectroscopy, a compound's fundamental vibrational energy is active only if the corresponding stretch or bend results in a change in the polarizability of its electrons. Polarizability essentially is a measure of how easy it is to distort a compound's electron cloud by applying an external electric field, such as when a photon from the source is absorbed; in general, polarizability increases when a stretching or bending motion increases the compound's volume as the electrons are then spread over a greater amount of space.
Figure \(\PageIndex{3}\) shows the four stretching and bending modes for CCl4. The stretching motion in (a), in which all four C–Cl bond lengths increase and decrease together, means the molecule's volume increases and decreases; thus, this vibrational mode is Raman active. The symmetry of the stretching motion, however, means there is no change in the molecule's dipole moment and the vibrational mode is IR inactive. The asymmetric stretch in (b), on the other hand, is both IR and Raman active. The bending motion in (c) results in the molecule becoming more or less compact in size, and is Raman active; the symmetry of the scissoring motions, however, means that the vibrational mode is IR inactive. The bending motions in (d) are both IR and Raman active.
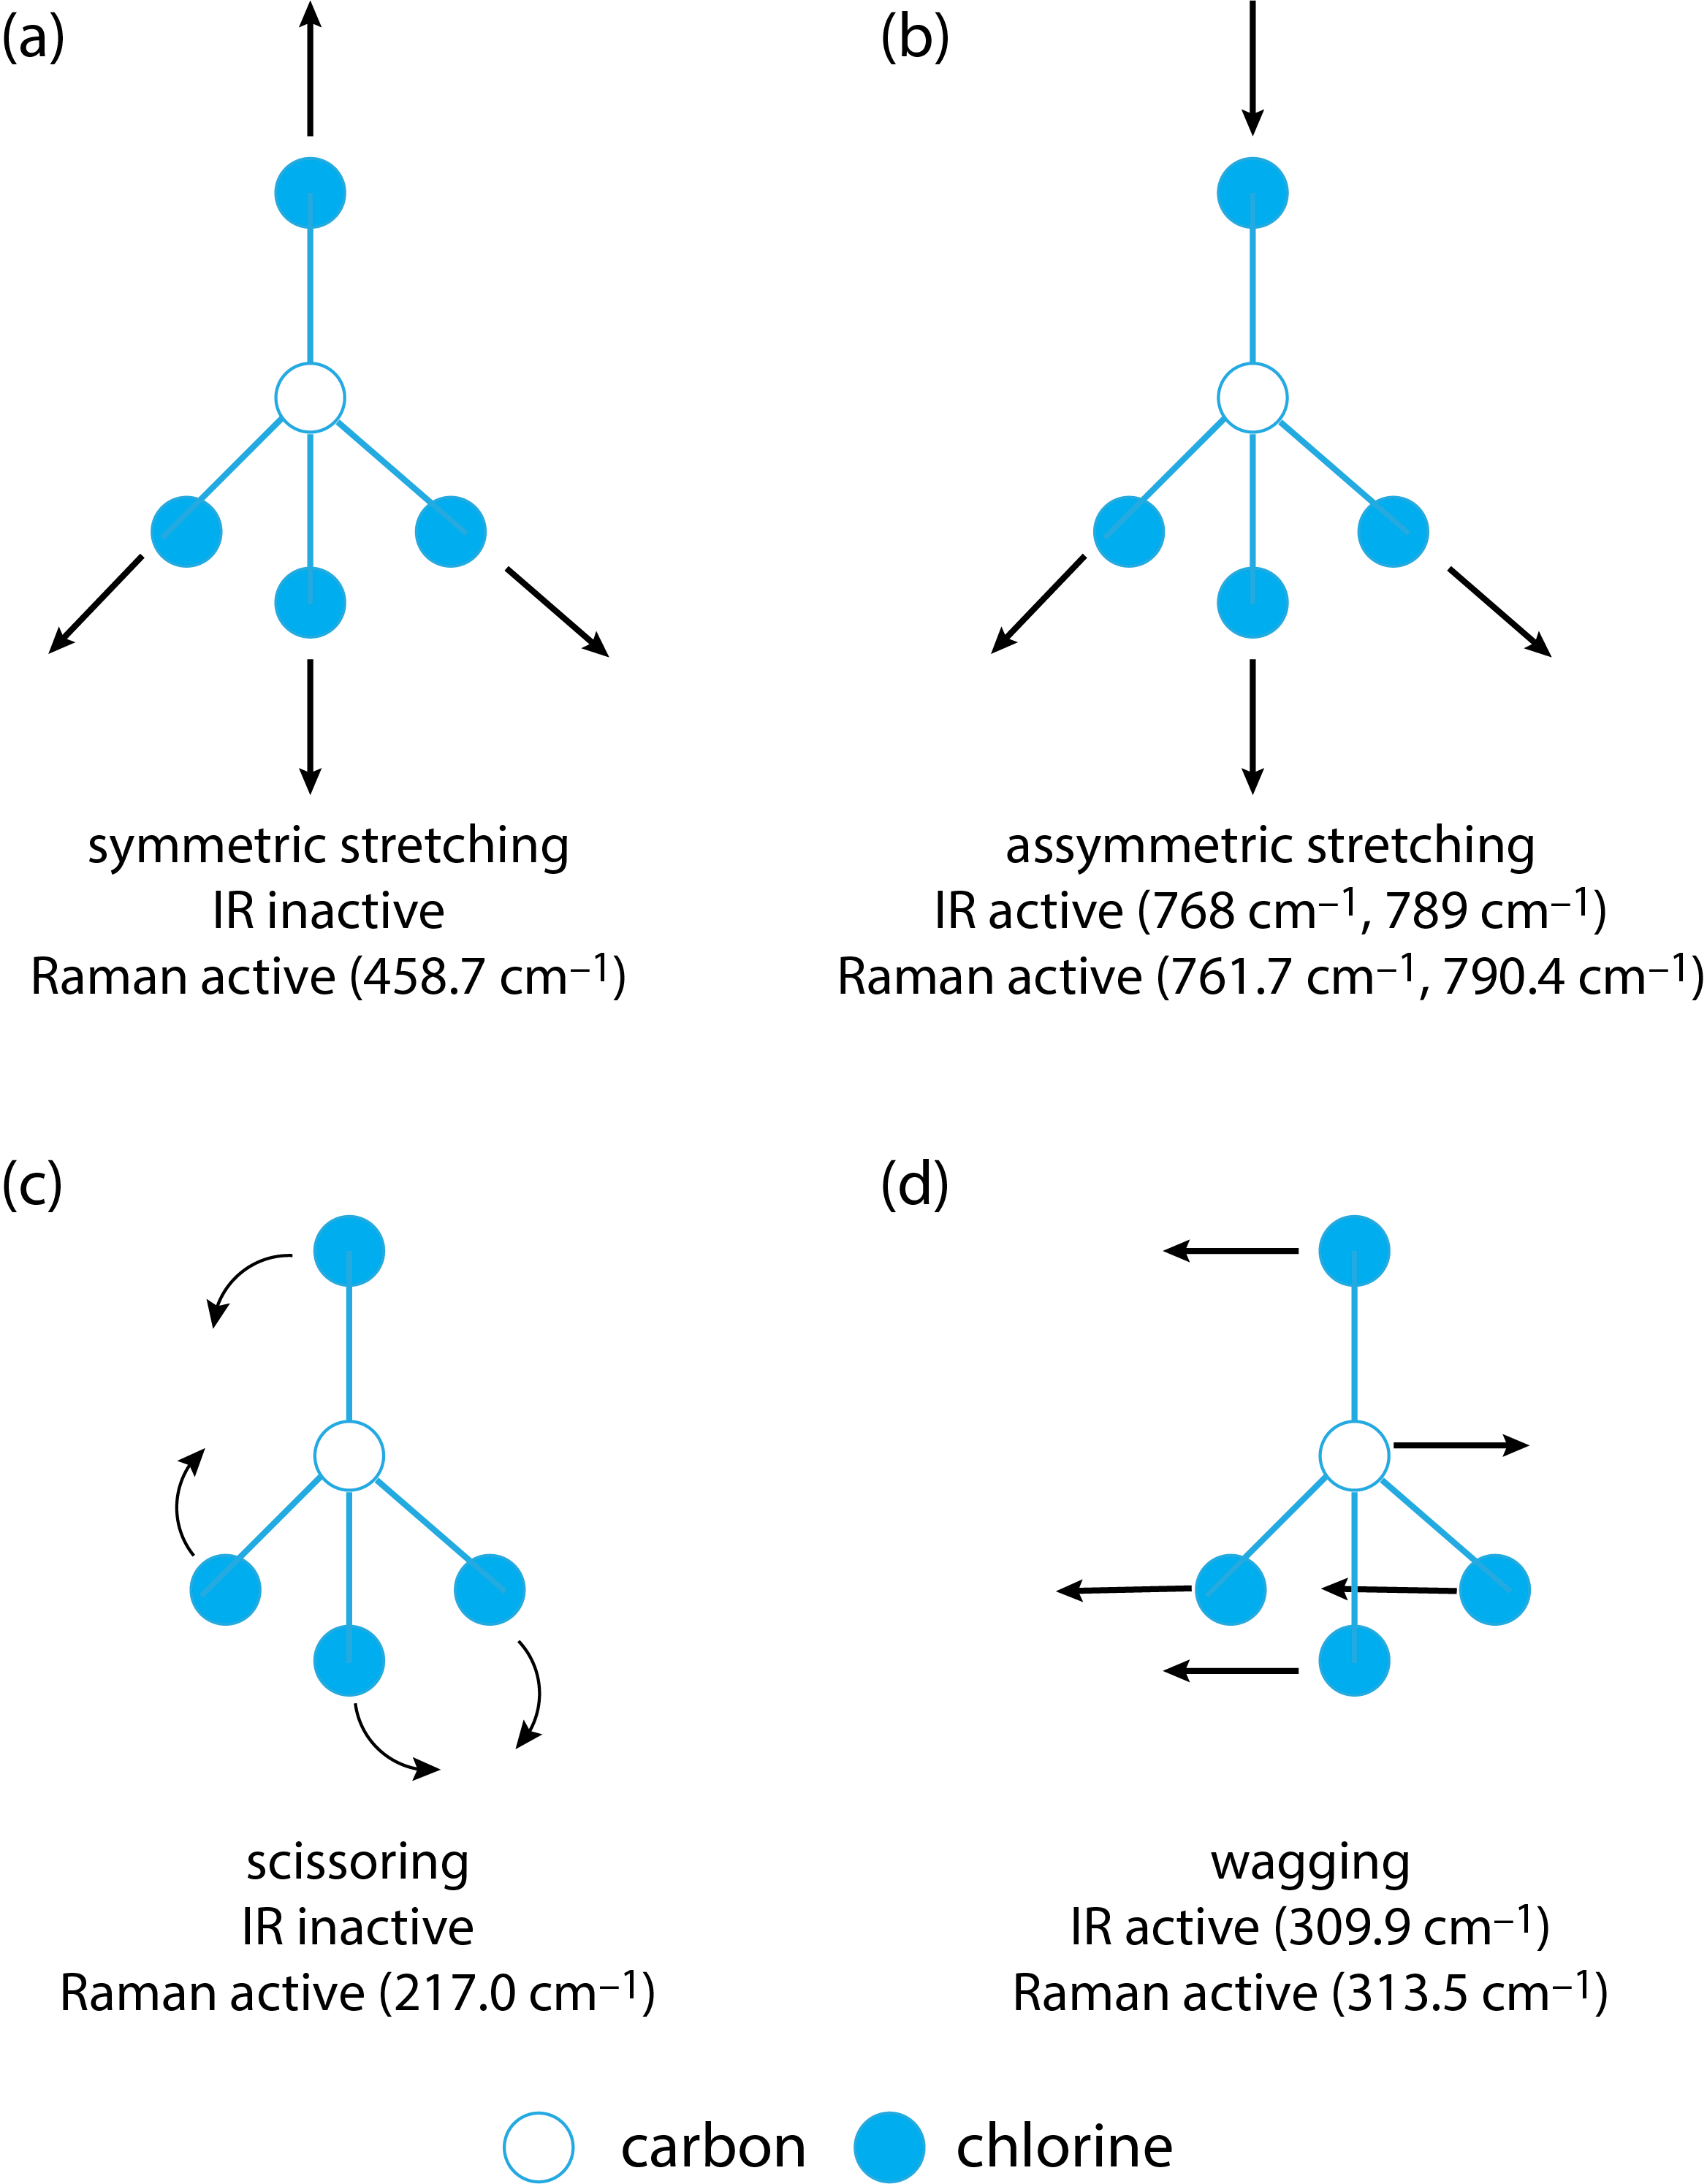
In general, symmetric stretching and bending modes result in relatively strong Raman scattering peaks, but no absorption in the IR, while symmetric stretching and bending modes result in both IR and Raman peaks. As a result, IR and Raman are complementary techniques.
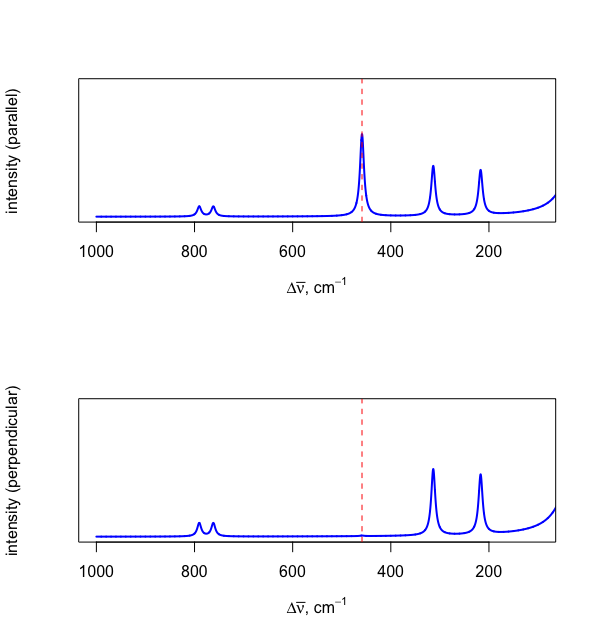
Raman Depolarization Ratios
If the source of electromagnetic radiation is plane-polarized, then it is possible to collect a Raman spectrum using light scattered in a plane that is parallel to the source and, separately, in a plane that is perpendicular to the source. The ratio of a line's intensity of scattering in the perpendicular spectrum, \(I_{\perp}\), to the intensity of scattering in the parallel spectrum, \(I_{||}\), is called the depolarization ratio, \(p\).
\[p = \frac{I_{\perp}}{I_{||} } \label{depolarization} \]
A Raman line that originates from a vibrational mode that does not change the molecules shape will result in a depolarization ratio close to zero and an absence of the line in the perpendicular spectrum. Figure \(\PageIndex{4}\) shows the Raman spectrum when collecting data parallel (top) and perpendicular (bottom) to the light source. The absence of the peak at 458.7 cm–1 in the perpendicular spectrum confirms that this is the symmetric stretch illustrated in Figure \(\PageIndex{3}a\).