6.4: Emission and Absorbance Spectra
- Page ID
- 365610

\( \newcommand{\vecs}[1]{\overset { \scriptstyle \rightharpoonup} {\mathbf{#1}} } \)
\( \newcommand{\vecd}[1]{\overset{-\!-\!\rightharpoonup}{\vphantom{a}\smash {#1}}} \)
\( \newcommand{\dsum}{\displaystyle\sum\limits} \)
\( \newcommand{\dint}{\displaystyle\int\limits} \)
\( \newcommand{\dlim}{\displaystyle\lim\limits} \)
\( \newcommand{\id}{\mathrm{id}}\) \( \newcommand{\Span}{\mathrm{span}}\)
( \newcommand{\kernel}{\mathrm{null}\,}\) \( \newcommand{\range}{\mathrm{range}\,}\)
\( \newcommand{\RealPart}{\mathrm{Re}}\) \( \newcommand{\ImaginaryPart}{\mathrm{Im}}\)
\( \newcommand{\Argument}{\mathrm{Arg}}\) \( \newcommand{\norm}[1]{\| #1 \|}\)
\( \newcommand{\inner}[2]{\langle #1, #2 \rangle}\)
\( \newcommand{\Span}{\mathrm{span}}\)
\( \newcommand{\id}{\mathrm{id}}\)
\( \newcommand{\Span}{\mathrm{span}}\)
\( \newcommand{\kernel}{\mathrm{null}\,}\)
\( \newcommand{\range}{\mathrm{range}\,}\)
\( \newcommand{\RealPart}{\mathrm{Re}}\)
\( \newcommand{\ImaginaryPart}{\mathrm{Im}}\)
\( \newcommand{\Argument}{\mathrm{Arg}}\)
\( \newcommand{\norm}[1]{\| #1 \|}\)
\( \newcommand{\inner}[2]{\langle #1, #2 \rangle}\)
\( \newcommand{\Span}{\mathrm{span}}\) \( \newcommand{\AA}{\unicode[.8,0]{x212B}}\)
\( \newcommand{\vectorA}[1]{\vec{#1}} % arrow\)
\( \newcommand{\vectorAt}[1]{\vec{\text{#1}}} % arrow\)
\( \newcommand{\vectorB}[1]{\overset { \scriptstyle \rightharpoonup} {\mathbf{#1}} } \)
\( \newcommand{\vectorC}[1]{\textbf{#1}} \)
\( \newcommand{\vectorD}[1]{\overrightarrow{#1}} \)
\( \newcommand{\vectorDt}[1]{\overrightarrow{\text{#1}}} \)
\( \newcommand{\vectE}[1]{\overset{-\!-\!\rightharpoonup}{\vphantom{a}\smash{\mathbf {#1}}}} \)
\( \newcommand{\vecs}[1]{\overset { \scriptstyle \rightharpoonup} {\mathbf{#1}} } \)
\(\newcommand{\longvect}{\overrightarrow}\)
\( \newcommand{\vecd}[1]{\overset{-\!-\!\rightharpoonup}{\vphantom{a}\smash {#1}}} \)
\(\newcommand{\avec}{\mathbf a}\) \(\newcommand{\bvec}{\mathbf b}\) \(\newcommand{\cvec}{\mathbf c}\) \(\newcommand{\dvec}{\mathbf d}\) \(\newcommand{\dtil}{\widetilde{\mathbf d}}\) \(\newcommand{\evec}{\mathbf e}\) \(\newcommand{\fvec}{\mathbf f}\) \(\newcommand{\nvec}{\mathbf n}\) \(\newcommand{\pvec}{\mathbf p}\) \(\newcommand{\qvec}{\mathbf q}\) \(\newcommand{\svec}{\mathbf s}\) \(\newcommand{\tvec}{\mathbf t}\) \(\newcommand{\uvec}{\mathbf u}\) \(\newcommand{\vvec}{\mathbf v}\) \(\newcommand{\wvec}{\mathbf w}\) \(\newcommand{\xvec}{\mathbf x}\) \(\newcommand{\yvec}{\mathbf y}\) \(\newcommand{\zvec}{\mathbf z}\) \(\newcommand{\rvec}{\mathbf r}\) \(\newcommand{\mvec}{\mathbf m}\) \(\newcommand{\zerovec}{\mathbf 0}\) \(\newcommand{\onevec}{\mathbf 1}\) \(\newcommand{\real}{\mathbb R}\) \(\newcommand{\twovec}[2]{\left[\begin{array}{r}#1 \\ #2 \end{array}\right]}\) \(\newcommand{\ctwovec}[2]{\left[\begin{array}{c}#1 \\ #2 \end{array}\right]}\) \(\newcommand{\threevec}[3]{\left[\begin{array}{r}#1 \\ #2 \\ #3 \end{array}\right]}\) \(\newcommand{\cthreevec}[3]{\left[\begin{array}{c}#1 \\ #2 \\ #3 \end{array}\right]}\) \(\newcommand{\fourvec}[4]{\left[\begin{array}{r}#1 \\ #2 \\ #3 \\ #4 \end{array}\right]}\) \(\newcommand{\cfourvec}[4]{\left[\begin{array}{c}#1 \\ #2 \\ #3 \\ #4 \end{array}\right]}\) \(\newcommand{\fivevec}[5]{\left[\begin{array}{r}#1 \\ #2 \\ #3 \\ #4 \\ #5 \\ \end{array}\right]}\) \(\newcommand{\cfivevec}[5]{\left[\begin{array}{c}#1 \\ #2 \\ #3 \\ #4 \\ #5 \\ \end{array}\right]}\) \(\newcommand{\mattwo}[4]{\left[\begin{array}{rr}#1 \amp #2 \\ #3 \amp #4 \\ \end{array}\right]}\) \(\newcommand{\laspan}[1]{\text{Span}\{#1\}}\) \(\newcommand{\bcal}{\cal B}\) \(\newcommand{\ccal}{\cal C}\) \(\newcommand{\scal}{\cal S}\) \(\newcommand{\wcal}{\cal W}\) \(\newcommand{\ecal}{\cal E}\) \(\newcommand{\coords}[2]{\left\{#1\right\}_{#2}}\) \(\newcommand{\gray}[1]{\color{gray}{#1}}\) \(\newcommand{\lgray}[1]{\color{lightgray}{#1}}\) \(\newcommand{\rank}{\operatorname{rank}}\) \(\newcommand{\row}{\text{Row}}\) \(\newcommand{\col}{\text{Col}}\) \(\renewcommand{\row}{\text{Row}}\) \(\newcommand{\nul}{\text{Nul}}\) \(\newcommand{\var}{\text{Var}}\) \(\newcommand{\corr}{\text{corr}}\) \(\newcommand{\len}[1]{\left|#1\right|}\) \(\newcommand{\bbar}{\overline{\bvec}}\) \(\newcommand{\bhat}{\widehat{\bvec}}\) \(\newcommand{\bperp}{\bvec^\perp}\) \(\newcommand{\xhat}{\widehat{\xvec}}\) \(\newcommand{\vhat}{\widehat{\vvec}}\) \(\newcommand{\uhat}{\widehat{\uvec}}\) \(\newcommand{\what}{\widehat{\wvec}}\) \(\newcommand{\Sighat}{\widehat{\Sigma}}\) \(\newcommand{\lt}{<}\) \(\newcommand{\gt}{>}\) \(\newcommand{\amp}{&}\) \(\definecolor{fillinmathshade}{gray}{0.9}\)In the last section we considered the source of emission and absorption. In this section we consider the types of emission and absorbance spectra that we will form the basis for many of the chapters that follow.
Emission Spectra
When an atom, ion, or molecule moves from a higher-energy state to a lower-energy state it emits photons with energies equal to the difference in energy between the two states. The result is an emission spectrum that shows the intensity of emission as a function of wavelength. The shapes of these emission spectra fall into two broad types: line spectra and band spectra.
Line Spectra
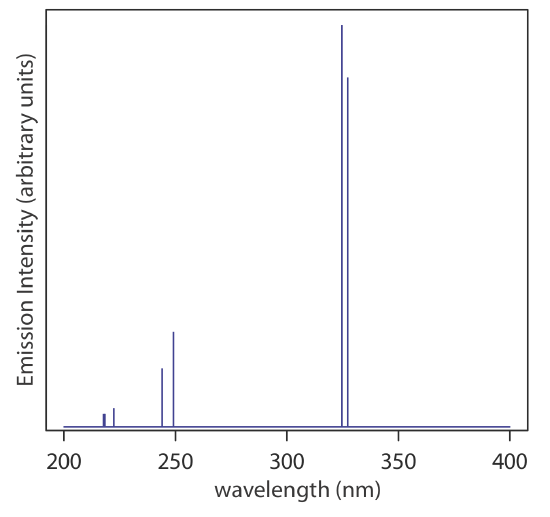
When the energy states are well separated from each other, and when there is just one type of transition between the energy states, the result is a line spectrum that consists of a small number of narrow bands. Figure \(\PageIndex{1}\), for example, shows the emission spectrum from gas phase Cu atoms, which consists of seven lines, two of which are too close to each other to resolve them from each other. The individual emissions lines are very narrow, as we might expect, because the atom's energy levels have precise values.
Band Spectra
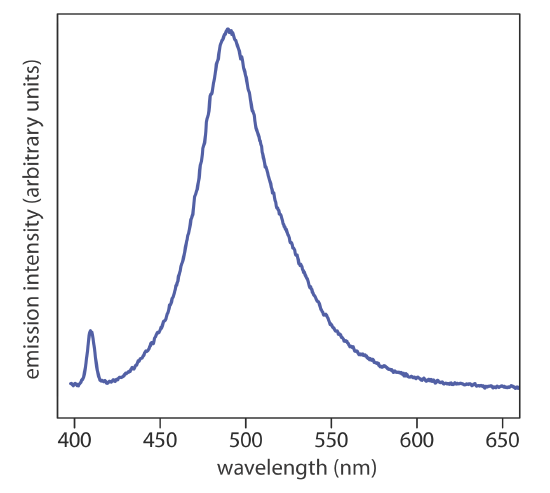
The emission spectrum for a gas phase atom is relatively simple because the number of possible transitions is small and because their individuals energies are well-separated from each other. When a molecule in a solvent emits light, the number of possible changes in energy levels can be quite large if the molecule undergoes transitions between electronic, vibrational, and rotational energy levels. The resulting spectrum has so many emission individual emission lines that we see a single broad peak, or band, that we call a band spectrum. Figure \(\PageIndex{2}\) shows the emission spectrum for the dye coumarin 343, which is incorporated in a reverse micelle and suspended in cyclohexanol.
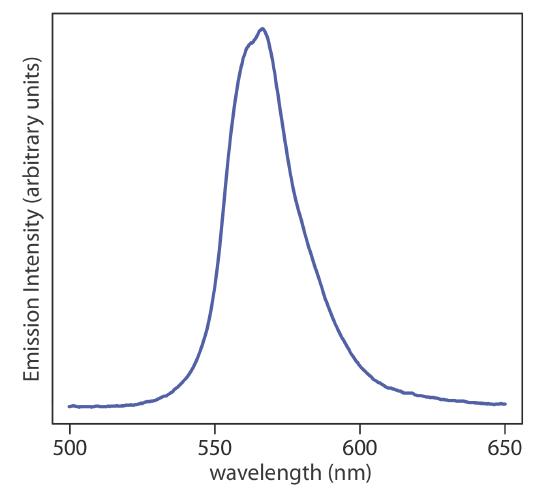
When considering sources of electromagnetic radiation for spectroscopic instruments, we usually describe them as line sources and continuous sources depending on on whether they emit discrete lines, as is the case for the hollow cathode lamp in Figure \(\PageIndex{1}\), or exhibit emission over a broad range of wavelengths without any gaps, as is the case for a green light-emitting diode (LED), whose spectrum is shown in Figure \(\PageIndex{3}\).
Absorbance Spectra
When an atom, ion, or molecule moves from a lower-energy state to a higher-energy state it absorbs photons with energies equal to the difference in energy between the two states. The result is an absorbance spectrum that shows the intensity of emission as a function of wavelength. As is the case for emission spectra, absorbance spectra range from narrow lines to broad bands. The atomic absorption spectrum for Na is shown in Figure \(\PageIndex{4}\), and is typical of that found for most atoms. The most obvious feature of this spectrum is that it consists of a small number of discrete absorption lines that correspond to transitions between the ground state (the 3s atomic orbital) and the 3p and the 4p atomic orbitals.
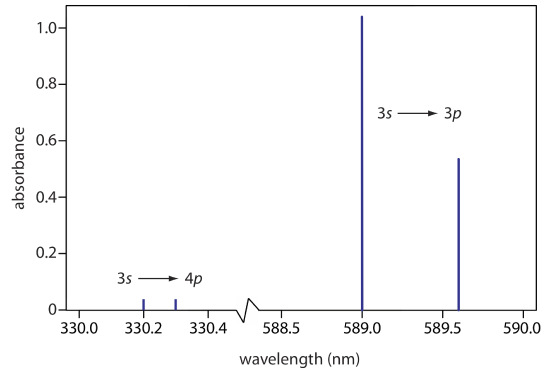
Another feature of the atomic absorption spectrum in Figure \(\PageIndex{4}\) is the narrow width of the absorption lines, which is a consequence of the fixed difference in energy between the ground state and the excited state, and the lack of vibrational and rotational energy levels. Natural line widths for atomic absorption, which are governed by the uncertainty principle, are approximately 10–5 nm. Other contributions to broadening increase this line width to approximately 10–3 nm.
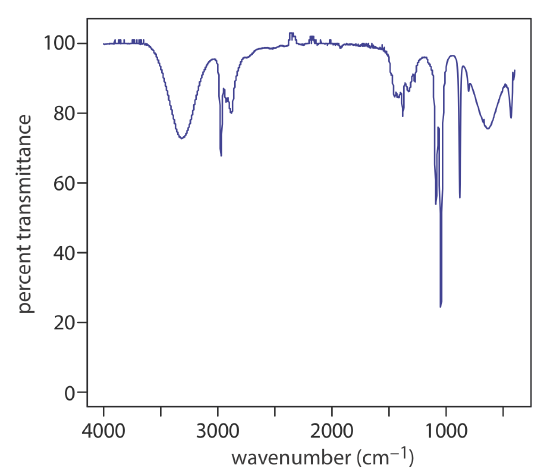
The absorbance spectra for molecules consists of broad bands for the same reasons discussed above for emission spectra. The UV/Vis spectrum for cranberry juice in Figure \(\PageIndex{5}\) shows a single broad band for the anthocyanin dyes that are responsible for its red color. The IR spectrum for ethanol in Figure \(\PageIndex{6}\) shows multiple absorption bands, some broader and some narrower. The narrow bands, however, are still much broader than the lines in the atomic absorption spectrum for Na.