
1.8: The Structural Model
- Page ID
- 352427

\( \newcommand{\vecs}[1]{\overset { \scriptstyle \rightharpoonup} {\mathbf{#1}} } \)
\( \newcommand{\vecd}[1]{\overset{-\!-\!\rightharpoonup}{\vphantom{a}\smash {#1}}} \)
\( \newcommand{\dsum}{\displaystyle\sum\limits} \)
\( \newcommand{\dint}{\displaystyle\int\limits} \)
\( \newcommand{\dlim}{\displaystyle\lim\limits} \)
\( \newcommand{\id}{\mathrm{id}}\) \( \newcommand{\Span}{\mathrm{span}}\)
( \newcommand{\kernel}{\mathrm{null}\,}\) \( \newcommand{\range}{\mathrm{range}\,}\)
\( \newcommand{\RealPart}{\mathrm{Re}}\) \( \newcommand{\ImaginaryPart}{\mathrm{Im}}\)
\( \newcommand{\Argument}{\mathrm{Arg}}\) \( \newcommand{\norm}[1]{\| #1 \|}\)
\( \newcommand{\inner}[2]{\langle #1, #2 \rangle}\)
\( \newcommand{\Span}{\mathrm{span}}\)
\( \newcommand{\id}{\mathrm{id}}\)
\( \newcommand{\Span}{\mathrm{span}}\)
\( \newcommand{\kernel}{\mathrm{null}\,}\)
\( \newcommand{\range}{\mathrm{range}\,}\)
\( \newcommand{\RealPart}{\mathrm{Re}}\)
\( \newcommand{\ImaginaryPart}{\mathrm{Im}}\)
\( \newcommand{\Argument}{\mathrm{Arg}}\)
\( \newcommand{\norm}[1]{\| #1 \|}\)
\( \newcommand{\inner}[2]{\langle #1, #2 \rangle}\)
\( \newcommand{\Span}{\mathrm{span}}\) \( \newcommand{\AA}{\unicode[.8,0]{x212B}}\)
\( \newcommand{\vectorA}[1]{\vec{#1}} % arrow\)
\( \newcommand{\vectorAt}[1]{\vec{\text{#1}}} % arrow\)
\( \newcommand{\vectorB}[1]{\overset { \scriptstyle \rightharpoonup} {\mathbf{#1}} } \)
\( \newcommand{\vectorC}[1]{\textbf{#1}} \)
\( \newcommand{\vectorD}[1]{\overrightarrow{#1}} \)
\( \newcommand{\vectorDt}[1]{\overrightarrow{\text{#1}}} \)
\( \newcommand{\vectE}[1]{\overset{-\!-\!\rightharpoonup}{\vphantom{a}\smash{\mathbf {#1}}}} \)
\( \newcommand{\vecs}[1]{\overset { \scriptstyle \rightharpoonup} {\mathbf{#1}} } \)
\(\newcommand{\longvect}{\overrightarrow}\)
\( \newcommand{\vecd}[1]{\overset{-\!-\!\rightharpoonup}{\vphantom{a}\smash {#1}}} \)
\(\newcommand{\avec}{\mathbf a}\) \(\newcommand{\bvec}{\mathbf b}\) \(\newcommand{\cvec}{\mathbf c}\) \(\newcommand{\dvec}{\mathbf d}\) \(\newcommand{\dtil}{\widetilde{\mathbf d}}\) \(\newcommand{\evec}{\mathbf e}\) \(\newcommand{\fvec}{\mathbf f}\) \(\newcommand{\nvec}{\mathbf n}\) \(\newcommand{\pvec}{\mathbf p}\) \(\newcommand{\qvec}{\mathbf q}\) \(\newcommand{\svec}{\mathbf s}\) \(\newcommand{\tvec}{\mathbf t}\) \(\newcommand{\uvec}{\mathbf u}\) \(\newcommand{\vvec}{\mathbf v}\) \(\newcommand{\wvec}{\mathbf w}\) \(\newcommand{\xvec}{\mathbf x}\) \(\newcommand{\yvec}{\mathbf y}\) \(\newcommand{\zvec}{\mathbf z}\) \(\newcommand{\rvec}{\mathbf r}\) \(\newcommand{\mvec}{\mathbf m}\) \(\newcommand{\zerovec}{\mathbf 0}\) \(\newcommand{\onevec}{\mathbf 1}\) \(\newcommand{\real}{\mathbb R}\) \(\newcommand{\twovec}[2]{\left[\begin{array}{r}#1 \\ #2 \end{array}\right]}\) \(\newcommand{\ctwovec}[2]{\left[\begin{array}{c}#1 \\ #2 \end{array}\right]}\) \(\newcommand{\threevec}[3]{\left[\begin{array}{r}#1 \\ #2 \\ #3 \end{array}\right]}\) \(\newcommand{\cthreevec}[3]{\left[\begin{array}{c}#1 \\ #2 \\ #3 \end{array}\right]}\) \(\newcommand{\fourvec}[4]{\left[\begin{array}{r}#1 \\ #2 \\ #3 \\ #4 \end{array}\right]}\) \(\newcommand{\cfourvec}[4]{\left[\begin{array}{c}#1 \\ #2 \\ #3 \\ #4 \end{array}\right]}\) \(\newcommand{\fivevec}[5]{\left[\begin{array}{r}#1 \\ #2 \\ #3 \\ #4 \\ #5 \\ \end{array}\right]}\) \(\newcommand{\cfivevec}[5]{\left[\begin{array}{c}#1 \\ #2 \\ #3 \\ #4 \\ #5 \\ \end{array}\right]}\) \(\newcommand{\mattwo}[4]{\left[\begin{array}{rr}#1 \amp #2 \\ #3 \amp #4 \\ \end{array}\right]}\) \(\newcommand{\laspan}[1]{\text{Span}\{#1\}}\) \(\newcommand{\bcal}{\cal B}\) \(\newcommand{\ccal}{\cal C}\) \(\newcommand{\scal}{\cal S}\) \(\newcommand{\wcal}{\cal W}\) \(\newcommand{\ecal}{\cal E}\) \(\newcommand{\coords}[2]{\left\{#1\right\}_{#2}}\) \(\newcommand{\gray}[1]{\color{gray}{#1}}\) \(\newcommand{\lgray}[1]{\color{lightgray}{#1}}\) \(\newcommand{\rank}{\operatorname{rank}}\) \(\newcommand{\row}{\text{Row}}\) \(\newcommand{\col}{\text{Col}}\) \(\renewcommand{\row}{\text{Row}}\) \(\newcommand{\nul}{\text{Nul}}\) \(\newcommand{\var}{\text{Var}}\) \(\newcommand{\corr}{\text{corr}}\) \(\newcommand{\len}[1]{\left|#1\right|}\) \(\newcommand{\bbar}{\overline{\bvec}}\) \(\newcommand{\bhat}{\widehat{\bvec}}\) \(\newcommand{\bperp}{\bvec^\perp}\) \(\newcommand{\xhat}{\widehat{\xvec}}\) \(\newcommand{\vhat}{\widehat{\vvec}}\) \(\newcommand{\uhat}{\widehat{\uvec}}\) \(\newcommand{\what}{\widehat{\wvec}}\) \(\newcommand{\Sighat}{\widehat{\Sigma}}\) \(\newcommand{\lt}{<}\) \(\newcommand{\gt}{>}\) \(\newcommand{\amp}{&}\) \(\definecolor{fillinmathshade}{gray}{0.9}\)The analysis and interpretation of the electron density function, ie the resolution of a crystal structure (molecular or non-molecular) leads to an initial distribution of atomic positions within the unit cell which can be represented by points or small spheres:

Once the structural model is completed, having stereochemical sense and including its crystal packing, it is necessary to make use of all the information we can extract from the experimental data, since the diffraction pattern generally contains much more data (intensities) than needed to locate the atoms at their 3-dimensional coordinates. For instance, for a medium sized structure, with 50 independent atoms in the asymmetric unit (in the structural unit which is repeated by the symmetry operations), the diffraction pattern usually contains around 2500 structure factors, which implies approximately 50 observations per atom (each atom needs 3 coordinates). However, for more complex structures, as in the case of macromolecules, the amount of experimental data available normally does not reach these limits.
REFINING THE FINAL MODEL
The basic parameters associated with a three-dimensional structure are, obviously, the three positional coordinates (x, y, z) for each atom, given in terms of unit cell fractions. But, in general, given the experimental overdetermination mentioned above, the atomic model can become more complex. For instance, associating each atom with an additional parameter reflecting its thermal vibrational state, in a first approach as an isotropic (spherical) thermal vibration around its position of equilibrium. This new parameter is normally shown in terms of different radius of the sphere representing the atom. Thus an isotropic structural model would be represented by 4 variables per atom: 3 positional + 1 thermal.
However, for small and medium-sized structures (up to several hundred of atoms), the diffraction experiment usually contains enough data to complete the thermal vibration model, associating a tensor (6 variables) to each atom which expresses the state of vibration in an anisotropic manner, ie distinguishing between different directions of vibration in the form of an ellipsoid (which resembles the shape of a baseball). Therefore, a crystallographic anisotropic model will require 9 variables per atom (3 positional + 6 vibrational).
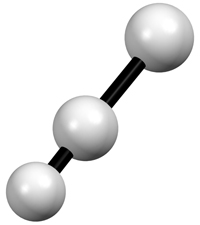
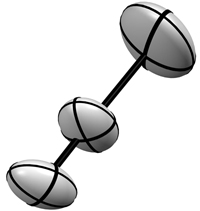
Left: Three bonded atoms represented with the isotropic thermal vibration model Right: The same three atoms shown on the left, but represented using the anisotropic thermal vibration model
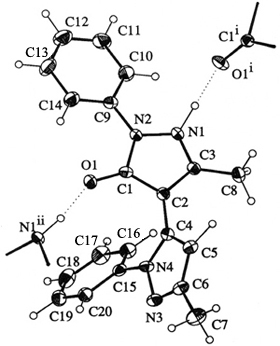

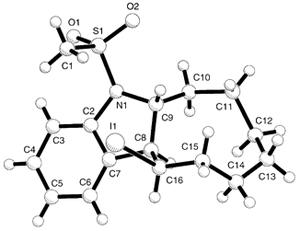
Left: Anisotropic model of the 3-dimensional structure of a molecule, showing some atoms from neighboring molecules.
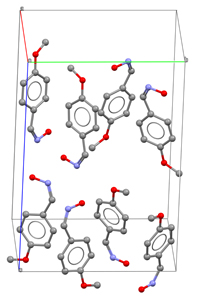
Right: Anisotropic model of the 3-dimensional structure of a molecule showing its crystal packing.
Regardless of the model type, isotropic or anisotropic, the above-mentioned overabundance of experimental data allows a description of the structural model in terms of very precise atomic parameters (positional and vibrational) which lead to very precise geometrical parameters of the whole structure (interatomic distances, bond angles, etc.).
This refined model is obtained by the analytical method of least-squares. Using this technique, atoms are allowed to "move" slightly from their previous positions and thermal factors are applied to each atom so that the diffraction pattern calculated with this model is essentially the same as the experimental one (observed), ie minimizing the differences between the calculated and observed structure factors. This process is carried out by minimizing the function:
\[\sum w | |F_o| - |F_c| |^2 → 0\]
Least-squares function used to refine the final model of a crystal structure
where \(w\) represents a "weight" factor assigned to each observation (intensity), weighting the effects of the less-precise observations vs. the more accurate ones and avoiding possible systematic errors in the experimental observations which could bias the model. Fo and Fc are de observed and calculated structure factors, respectively.
Although usually the mentioned experimental overdetermination ensures the success of this analytical process of refinement, it must always be controlled through the stereochemical aspects, ie, ensuring that the positional movements of the atoms are reasonable and which therefore generate distances within the expected values. Similarly, the thermal vibration factors (isotropic or anisotropic) associated with the atoms must always show reasonable values.
In addition to the aforementioned control of the model changes during the refinement process, it seems obvious that (if everything goes well), additionally the diffraction pattern calculated (Fc) with the refined model (coordinates + thermal vibration factors) will show increasing similarity to the observed pattern (Fo). The comparison between both patterns (observed vs. calculated) is done via the so-called \(R\) parameter, which defines the "disagreement" factor between the two patterns:
\[R = \dfrac{\sum [ | |F_o| - |F_c| | ]}{|F_o|}\]
Disagreement factor of a structural model, calculated in terms of differences between observed and calculated structure factors with the final model
The value of the disagreement factor (R) is estimated as a percentage (%), ie, multiplied by 100, so that "well" solved structures, with an appropriate degree of precision, will show an R factor below 0.10 (10% ), which implies that the calculated pattern differs from the observed one (experimental) less than 10%.
The diffraction patterns of macromolecules (enzymes, proteins, etc.) usually do not show such large overdetermination of experimental data and therefore it is difficult to reach an anisotropic final model. Moreover, in these cases the values of the R factor are greater than those for small and medium-sized molecules, so that values around or below 20% are usually acceptable. In addition, as a result of this relative scarcity of experimental data, the analytical procedure of refinement (least-squares) must be combined with an interactive stereochemical modeling process and by imposing certain "soft restraints" to the molecular geometry.
MODEL VALIDATION
The reliability of a structural model has to be assessed in terms of several tests, a procedure known as model validation. Thus, the structural model should be continuously checked and validated using consistent stereochemical criteria (for example, bond lengths and bond angles must be acceptable). For instance a C---O distance of 0.8 Angstrom would not be acceptable for a carbonyl group (C = O). Similarly, the bond angles must also be consistent with an acceptable geometry. These criteria are very restrictive for small or medium-sized structures, but even in the structures of macromolecules they must meet some minimum criteria.

Maximum dispersion values generally accepted for interatomic distances and bond angles in the structural model of a macromolecule
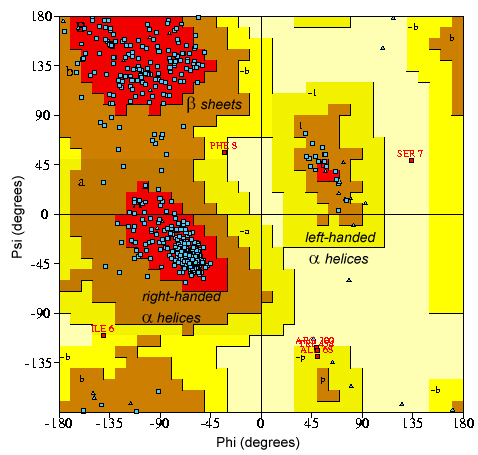
In the case of proteins, the peptide bond (the bond between two consecutive amino acids) must also satisfy some geometrical restrictions. The torsional angles of this bond should not deviate much from the acceptable values of the usual conformations shown by the amino acid chains, as is shown in the so-called Ramachandran plot:
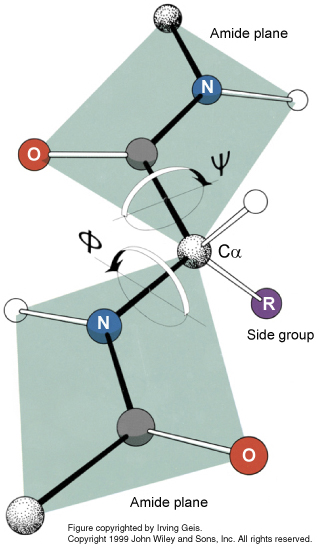
Left: Schematic representation of the peptide bond, showing the two torsional angles (Ψ and Φ) defining it.
Right: Ramachandran plot showing the different allowed (acceptable) areas for the torsional angles of the peptide bonds in a macromolecule. The different areas depend on the different structural arrangements (α-helices, β-sheets, etc.)
Similarly, the values of the thermal factors associated with each atom should show physically acceptable values. These parameters account for the thermal vibrational mobility of the different structural parts. Thus, in the structure of a macromolecule, these values should be consistent with the internal or external location of the chain, being generally lower for the internal parts, and higher for external parts near the solvent.
DEGREE OF RELIABILITY OF THE MODEL
A model that has been "validated" according to the criteria described above, that is, which demonstrates:
- a reasonable agreement between observed and calculated structure factors,
- bond distances, bond angles and torsional angles that meet stereochemical criteria, and
- physically reasonable thermal vibration factors,
is a reliable model. However, the concept of reliability is not a quantitative parameter which can be written in terms of a single number. Therefore, to interpret a structural model up to its logical consequences one has to bear in mind that it is just a simplified representation, extracted from an electron density function:
\[\rho(x y z)=\frac{1}{V} \sum_{\substack{h k l}}^{+\infty}|F(h k l)| \cdot e^{-2 \pi i[h x+k y+l z-\phi(h k l)]}\]
on which the atoms have been positioned and which is being affected by some conditions described in another section, which we invite you to read.
But, in any case, well-done crystallographic work always provides atomic parameters (positional and vibrational) along with their associated precision estimates. This means that any direct crystallographic parameter (atomic coordinates and vibration factors) or derived (distances, angles, etc.) is usually expressed by a number followed by its standard deviation (in parentheses) affecting the last figure. For example, an interatomic distance expressed as 1.541 (2) Angstroms means a distance of 1.541 and a standard deviation of 0.002.
THE ABSOLUTE CONFIGURATION (OR ABSOLUTE STEREOCHEMISTRY)
As stated in a previous chapter, all molecules or structures in which neither mirror planes nor centres of symmetry are present, have an absolute configuration, that is, that they are different from their mirror images (they cannot be superimposed).
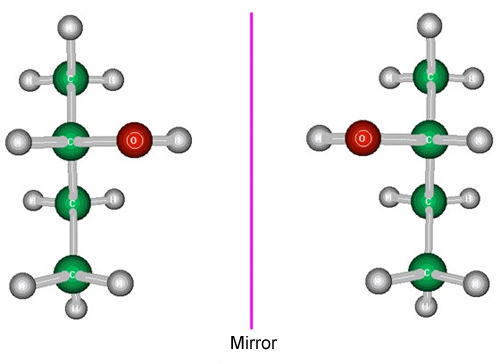
Structural models showing two enantiomers of a compound (the two molecules are mirror images)
These particular structural differences, very important as far as the molecular properties are concerned, can be unambiguously determined through the diffraction experiment (without using any external standard). This can be carried out using the so-called anomalous scattering effect which atoms show when appropriate X-ray wavelengths are used. This feature is also very succesfully used as a method to solve the phase problem for macromolecular crystals. It doesn't seem difficult to understand that the molecular enantiomers have different properties, as in the end they are different molecules, but regarding their biological activity (if any) the situation is particularly striking.

Enantiomeric molecules that are represented in the left figure were introduced in the market by a pharmaceutical company and, obviously, they showed different properties.
The properties of DARVON (Dextropropoxyphene Napsylate) are available through this link, while production of NOVRAD (Levopropoxyphene Napsylate) was discontinued.
The experimental diffraction signal that allows this structural differentiation is a consequence of the fact that the atomic scattering factor does not behave as a real number when the frequency of X-rays is similar to the natural frequency of the atomic absorption. See also the chapter dedicated to anomalous dispersion.
Under these conditions, Friedel's Law is no longer fulfilled and therefore structure factors such as |Fh,k,l | and |F-h,-k,-l | will be slightly different. These differences are evaluated in terms of the so-called Bijvoet estimators, which compare the ratios for observed structure factors for such reflection pairs with the corresponding ratios for the calculated structure factors using the two possible absolute models. Only one of these two comparisons will maintain the same type of bias:
\[\frac{|F(h k l)|_{o}}{|F(\bar{h} \bar{k} \bar{l})|_{o}} \text { vs. } \frac{|F(h k l)|_{c}}{|F(\bar{h} \bar{k} \bar{l})|_{c}}\]
Comparison of Bijvoet ratios - Johannes Martin Bijvoet (1892-1980)
Thus, if the quotient between the observed structure factors is <1, the same quotient for the calculated structure factors should also be <1. Or, on the contrary, both quotients should be >1. If this is true for a large number of reflection pairs it will indicate that the absolute model is the right one. If it is not so, the structural model has to be inverted.
The interested reader should also have a look into the web pages on anomalous scattering, prepared by Ethan A. Merritt.
THE FINAL RESULT
The information describing a final crystallographic model is composed of:
- Data from the diffraction experiment: wavelength and diffraction pattern (the intensity of thousands or even hundreds of thousands of diffracted waves with their hkl indices),
- Unit cell dimensions as derived from the diffraction pattern (from the reciprocal cell),
- The symmetry present in the crystal, derived from the reciprocal lattice (from the diffraction pattern), and
- Atomic positions (coordinates and thermal vibration factors) and, if needed, the so-called population factor, as indicated in the table below.
The atomic positions are usually given as fractional coordinates (fractions of the unit cell axes), but sometimes, especially for macromolecules where the information usually refers to the isolated molecule, they are given as absolute coordinates, ie, expressed in Angstrom and referred to a system of orthogonal axes independent of the crystallographic ones (see below).
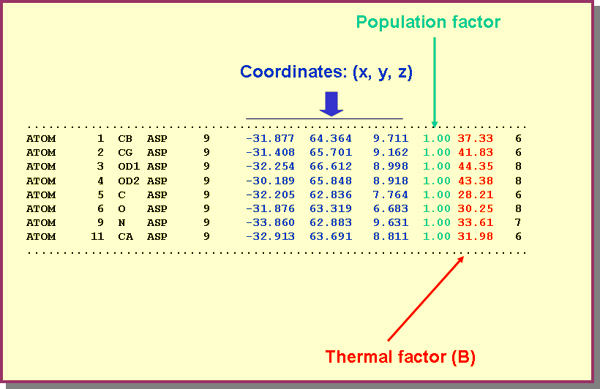
Information about several atoms of a protein structure using the so-called PDB format (Protein Data Bank), ie atomic coordinates in Angstrom on a system of orthogonal axes, different from the crystallographic ones. For clarity, the estimated standard deviations have been omitted.
The population factor is the fraction of atom located in a specific position, although this factor is usually 1. The meaning of this parameter requires an explanation for the beginner, since it could be understood that atoms could be divided in parts, which obviously has no physical meaning. Due to atomic vibrations, and to the fact that the diffraction experiment has a duration in time, it is possible that in some of the unit cells atoms are missing. Thus, instead of a complete occupancy (population factor = 1), the corresponding site, in an average unit cell, will contain only a fraction of the atom. In these cases it is said that the crystal lattice has defects and population factors smaller than 1 reflect a fraction of unit cells where a specific atomic position is occupied. Obviously, a fraction of unit cells where the same position is empty complements the population factor to unity. Therefore, the crystallographic model reflects the average structure of all unit cells during the experiment time.
The atomic coordinates and in general all information collected from a crystallographic study, is stored in accessible databases. There are different databases, depending of the type of compound or molecule, but this will be discussed in another chapter of these pages.
GRAPHICAL REPRESENTATIONS OF THE MODEL
The final structural model (atomic coordinates, thermal factors and, possibly, population factors) directly provide additional information which leads to a detailed knowledge of the structure itself, including bond lengths, bond angles, torsional angles, molecular planes, dipole momentum, etc., and any other structural detail that might be useful for understanding the functionality and/or properties of the material under study.

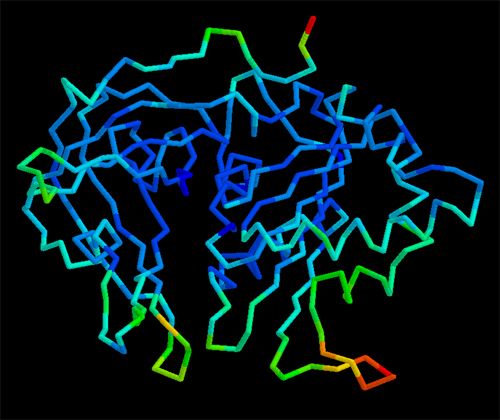
In the case of complex biological molecules, the use of high-quality graphic processors and relatively simple models, greatly facilitates the understanding of the relationship between structure and function, as shown in the figure on the left.
At present the available computational and graphic techniques allow us to obtain beautiful and very descriptive models which help to visualize and understand structures, as is shown in the examples below:
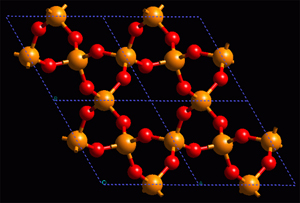
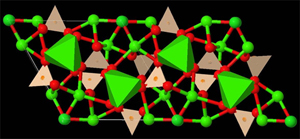
Left: Model of balls and sticks to represent the structure of a simple inorganic compound. Right: Representation of an inorganic compound, in which a partial polyhedral representation has been added
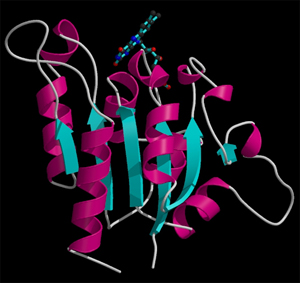
Left: Animated model of sitcks to represent the packing and molecular structure of a simple organic compound. Right: Given the complexity of biological molecules, the models which represent them are usually simple, showing the overall folding and the different structural motifs (α-helices, β-strands, loops, etc.) shown with the ribbon model. The example also shows a stick representation of a cofactor linked to the enzyme.
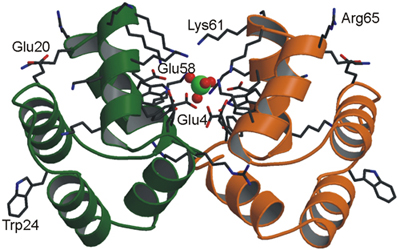
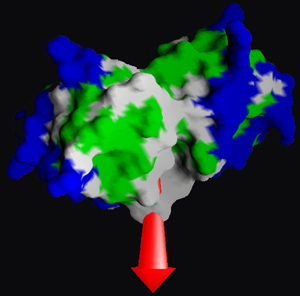
Left: Combined model of ribbons and sticks to represent the dimmeric structure of a protein which also shows a sulfate ion in the middle--represented with balls Right: Representation of the surface of a biological molecule where the colours represent different properties of hydrophobia. The arrow represents the dipolar momentum of the molecule.
Finally, using additional information from other techniques (such as cryo-electron microscopy), or combining two different crystal conformations of a molecule, other models are available as shown below. Moreover, using the ultrashort exposure times of X-rays produced by free electron lasers (European XFEL), crystallographers are able to collect diffraction data of macromolecules in different conformations, that is, during the course of performing their respective tasks. In this manner, using a huge number of X-ray snapshots we can produce like a film where we are able to follow the molecular modifications and therefore to understand their function.
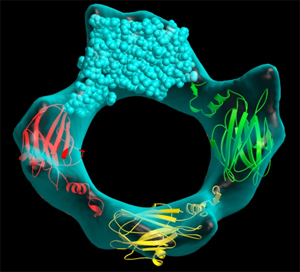
Left: Combined model of the molecular structure of a protein and an envelope (as obtained by high-resolution electron microscopy) showing a pore formed by the association of four protein molecules Right: Simplified animated model showing the backbone folding of an enzyme and the structural changes between two molecular states: active (open) and inactive (closed). The structures of both states were determined by crystallography