
Gas Chromatography
- Page ID
- 301
\( \newcommand{\vecs}[1]{\overset { \scriptstyle \rightharpoonup} {\mathbf{#1}} } \)
\( \newcommand{\vecd}[1]{\overset{-\!-\!\rightharpoonup}{\vphantom{a}\smash {#1}}} \)
\( \newcommand{\dsum}{\displaystyle\sum\limits} \)
\( \newcommand{\dint}{\displaystyle\int\limits} \)
\( \newcommand{\dlim}{\displaystyle\lim\limits} \)
\( \newcommand{\id}{\mathrm{id}}\) \( \newcommand{\Span}{\mathrm{span}}\)
( \newcommand{\kernel}{\mathrm{null}\,}\) \( \newcommand{\range}{\mathrm{range}\,}\)
\( \newcommand{\RealPart}{\mathrm{Re}}\) \( \newcommand{\ImaginaryPart}{\mathrm{Im}}\)
\( \newcommand{\Argument}{\mathrm{Arg}}\) \( \newcommand{\norm}[1]{\| #1 \|}\)
\( \newcommand{\inner}[2]{\langle #1, #2 \rangle}\)
\( \newcommand{\Span}{\mathrm{span}}\)
\( \newcommand{\id}{\mathrm{id}}\)
\( \newcommand{\Span}{\mathrm{span}}\)
\( \newcommand{\kernel}{\mathrm{null}\,}\)
\( \newcommand{\range}{\mathrm{range}\,}\)
\( \newcommand{\RealPart}{\mathrm{Re}}\)
\( \newcommand{\ImaginaryPart}{\mathrm{Im}}\)
\( \newcommand{\Argument}{\mathrm{Arg}}\)
\( \newcommand{\norm}[1]{\| #1 \|}\)
\( \newcommand{\inner}[2]{\langle #1, #2 \rangle}\)
\( \newcommand{\Span}{\mathrm{span}}\) \( \newcommand{\AA}{\unicode[.8,0]{x212B}}\)
\( \newcommand{\vectorA}[1]{\vec{#1}} % arrow\)
\( \newcommand{\vectorAt}[1]{\vec{\text{#1}}} % arrow\)
\( \newcommand{\vectorB}[1]{\overset { \scriptstyle \rightharpoonup} {\mathbf{#1}} } \)
\( \newcommand{\vectorC}[1]{\textbf{#1}} \)
\( \newcommand{\vectorD}[1]{\overrightarrow{#1}} \)
\( \newcommand{\vectorDt}[1]{\overrightarrow{\text{#1}}} \)
\( \newcommand{\vectE}[1]{\overset{-\!-\!\rightharpoonup}{\vphantom{a}\smash{\mathbf {#1}}}} \)
\( \newcommand{\vecs}[1]{\overset { \scriptstyle \rightharpoonup} {\mathbf{#1}} } \)
\(\newcommand{\longvect}{\overrightarrow}\)
\( \newcommand{\vecd}[1]{\overset{-\!-\!\rightharpoonup}{\vphantom{a}\smash {#1}}} \)
\(\newcommand{\avec}{\mathbf a}\) \(\newcommand{\bvec}{\mathbf b}\) \(\newcommand{\cvec}{\mathbf c}\) \(\newcommand{\dvec}{\mathbf d}\) \(\newcommand{\dtil}{\widetilde{\mathbf d}}\) \(\newcommand{\evec}{\mathbf e}\) \(\newcommand{\fvec}{\mathbf f}\) \(\newcommand{\nvec}{\mathbf n}\) \(\newcommand{\pvec}{\mathbf p}\) \(\newcommand{\qvec}{\mathbf q}\) \(\newcommand{\svec}{\mathbf s}\) \(\newcommand{\tvec}{\mathbf t}\) \(\newcommand{\uvec}{\mathbf u}\) \(\newcommand{\vvec}{\mathbf v}\) \(\newcommand{\wvec}{\mathbf w}\) \(\newcommand{\xvec}{\mathbf x}\) \(\newcommand{\yvec}{\mathbf y}\) \(\newcommand{\zvec}{\mathbf z}\) \(\newcommand{\rvec}{\mathbf r}\) \(\newcommand{\mvec}{\mathbf m}\) \(\newcommand{\zerovec}{\mathbf 0}\) \(\newcommand{\onevec}{\mathbf 1}\) \(\newcommand{\real}{\mathbb R}\) \(\newcommand{\twovec}[2]{\left[\begin{array}{r}#1 \\ #2 \end{array}\right]}\) \(\newcommand{\ctwovec}[2]{\left[\begin{array}{c}#1 \\ #2 \end{array}\right]}\) \(\newcommand{\threevec}[3]{\left[\begin{array}{r}#1 \\ #2 \\ #3 \end{array}\right]}\) \(\newcommand{\cthreevec}[3]{\left[\begin{array}{c}#1 \\ #2 \\ #3 \end{array}\right]}\) \(\newcommand{\fourvec}[4]{\left[\begin{array}{r}#1 \\ #2 \\ #3 \\ #4 \end{array}\right]}\) \(\newcommand{\cfourvec}[4]{\left[\begin{array}{c}#1 \\ #2 \\ #3 \\ #4 \end{array}\right]}\) \(\newcommand{\fivevec}[5]{\left[\begin{array}{r}#1 \\ #2 \\ #3 \\ #4 \\ #5 \\ \end{array}\right]}\) \(\newcommand{\cfivevec}[5]{\left[\begin{array}{c}#1 \\ #2 \\ #3 \\ #4 \\ #5 \\ \end{array}\right]}\) \(\newcommand{\mattwo}[4]{\left[\begin{array}{rr}#1 \amp #2 \\ #3 \amp #4 \\ \end{array}\right]}\) \(\newcommand{\laspan}[1]{\text{Span}\{#1\}}\) \(\newcommand{\bcal}{\cal B}\) \(\newcommand{\ccal}{\cal C}\) \(\newcommand{\scal}{\cal S}\) \(\newcommand{\wcal}{\cal W}\) \(\newcommand{\ecal}{\cal E}\) \(\newcommand{\coords}[2]{\left\{#1\right\}_{#2}}\) \(\newcommand{\gray}[1]{\color{gray}{#1}}\) \(\newcommand{\lgray}[1]{\color{lightgray}{#1}}\) \(\newcommand{\rank}{\operatorname{rank}}\) \(\newcommand{\row}{\text{Row}}\) \(\newcommand{\col}{\text{Col}}\) \(\renewcommand{\row}{\text{Row}}\) \(\newcommand{\nul}{\text{Nul}}\) \(\newcommand{\var}{\text{Var}}\) \(\newcommand{\corr}{\text{corr}}\) \(\newcommand{\len}[1]{\left|#1\right|}\) \(\newcommand{\bbar}{\overline{\bvec}}\) \(\newcommand{\bhat}{\widehat{\bvec}}\) \(\newcommand{\bperp}{\bvec^\perp}\) \(\newcommand{\xhat}{\widehat{\xvec}}\) \(\newcommand{\vhat}{\widehat{\vvec}}\) \(\newcommand{\uhat}{\widehat{\uvec}}\) \(\newcommand{\what}{\widehat{\wvec}}\) \(\newcommand{\Sighat}{\widehat{\Sigma}}\) \(\newcommand{\lt}{<}\) \(\newcommand{\gt}{>}\) \(\newcommand{\amp}{&}\) \(\definecolor{fillinmathshade}{gray}{0.9}\)Gas chromatography is a term used to describe the group of analytical separation techniques used to analyze volatile substances in the gas phase. In gas chromatography, the components of a sample are dissolved in a solvent and vaporized in order to separate the analytes by distributing the sample between two phases: a stationary phase and a mobile phase. The mobile phase is a chemically inert gas that serves to carry the molecules of the analyte through the heated column. Gas chromatography is one of the sole forms of chromatography that does not utilize the mobile phase for interacting with the analyte. The stationary phase is either a solid adsorbant, termed gas-solid chromatography (GSC), or a liquid on an inert support, termed gas-liquid chromatography (GLC).
Introduction
In early 1900s, Gas chromatography (GC) was discovered by Mikhail Semenovich Tsvett as a separation technique to separate compounds. In organic chemistry, liquid-solid column chromatography is often used to separate organic compounds in solution. Among the various types of gas chromatography, gas-liquid chromatography is the method most commonly used to separate organic compounds. The combination of gas chromatography and mass spectrometry is an invaluable tool in the identification of molecules. A typical gas chromatograph consists of an injection port, a column, carrier gas flow control equipment, ovens and heaters for maintaining temperatures of the injection port and the column, an integrator chart recorder and a detector.
To separate the compounds in gas-liquid chromatography, a solution sample that contains organic compounds of interest is injected into the sample port where it will be vaporized. The vaporized samples that are injected are then carried by an inert gas, which is often used by helium or nitrogen. This inert gas goes through a glass column packed with silica that is coated with a liquid. Materials that are less soluble in the liquid will increase the result faster than the material with greater solubility.The purpose of this module is to provide a better understanding on its separation and measurement techniques and its application.
In GLC, the liquid stationary phase is adsorbed onto a solid inert packing or immobilized on the capillary tubing walls. The column is considered packed if the glass or metal column tubing is packed with small spherical inert supports. The liquid phase adsorbs onto the surface of these beads in a thin layer. In a capillary column, the tubing walls are coated with the stationary phase or an adsorbant layer, which is capable of supporting the liquid phase. However, the method of GSC, has limited application in the laboratory and is rarely used due to severe peak tailing and the semi-permanent retention of polar compounds within the column. Therefore, the method of gas-liquid chromatography is simply shortened to gas chromatography and will be referred to as such here.The purpose of this module is to provide a better understanding on its separation and measurement techniques and its application.
Instrumentation
Sample Injection
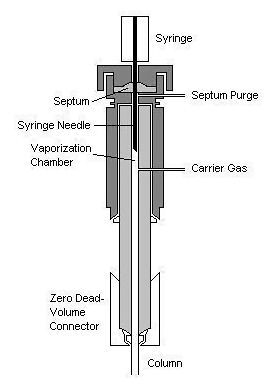
A sample port is necessary for introducing the sample at the head of the column. Modern injection techniques often employ the use of heated sample ports through which the sample can be injected and vaporized in a near simultaneous fashion. A calibrated microsyringe is used to deliver a sample volume in the range of a few microliters through a rubber septum and into the vaporization chamber. Most separations require only a small fraction of the initial sample volume and a sample splitter is used to direct excess sample to waste. Commercial gas chromatographs often allow for both split and splitless injections when alternating between packed columns and capillary columns. The vaporization chamber is typically heated 50 °C above the lowest boiling point of the sample and subsequently mixed with the carrier gas to transport the sample into the column.
Carrier Gas
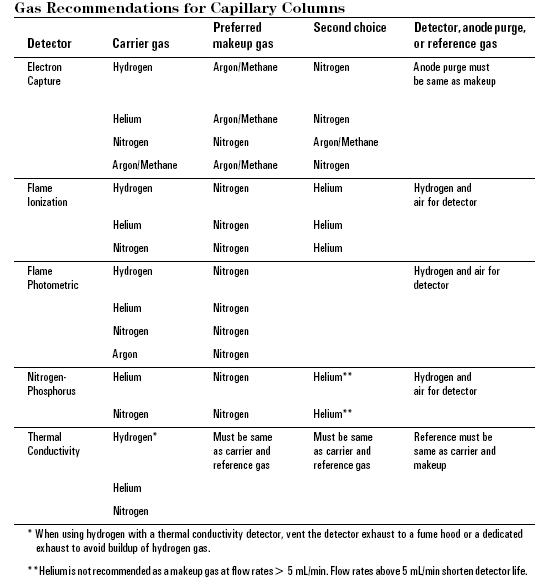
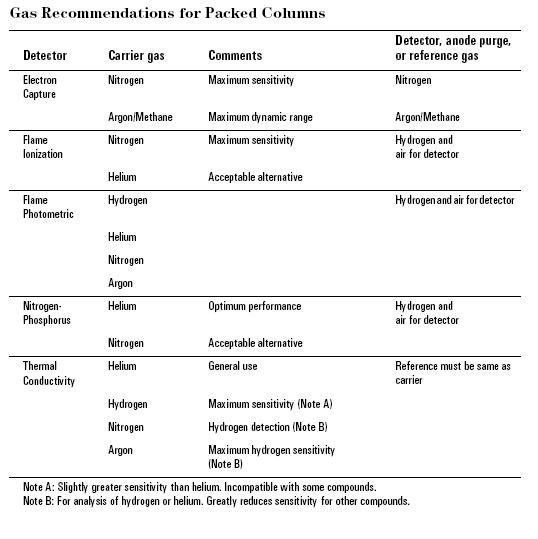
The carrier gas plays an important role, and varies in the GC used. Carrier gas must be dry, free of oxygen and chemically inert mobile-phase employed in gas chromatography. Helium is most commonly used because it is safer than, but comprable to hydrogen in efficiency, has a larger range of flow rates and is compatible with many detectors. Nitrogen, argon, and hydrogen are also used depending upon the desired performance and the detector being used. Both hydrogen and helium, which are commonly used on most traditional detectors such as Flame Ionization(FID), thermal conductivity (TCD) and Electron capture (ECD), provide a shorter analysis time and lower elution temperatures of the sample due to higher flow rates and low molecular weight. For instance, hydrogen or helium as the carrier gas gives the highest sensitivity with TCD because the difference in thermal conductivity between the organic vapor and hydrogen/helium is greater than other carrier gas. Other detectors such as mass spectroscopy, uses nitrogen or argon which has a much better advantage than hydrogen or helium due to their higher molecular weights, in which improve vacuum pump efficiency.
All carrier gasses are available in pressurized tanks and pressure regulators, gages and flow meters are used to meticulously control the flow rate of the gas. Most gas supplies used should fall between 99.995% - 99.9995% purity range and contain a low levels (< 0.5 ppm) of oxygen and total hydrocarbons in the tank. The carrier gas system contains a molecular sieve to remove water and other impurities. Traps are another option to keep the system pure and optimum sensitive and removal traces of water and other contaminants. A two stage pressure regulation is required to use to minimize the pressure surges and to monitor the flow rate of the gas. To monitor the flow rate of the gas a flow or pressure regulator was also require onto both tank and chromatograph gas inlet. This applies different gas type will use different type of regulator.The carrier gas is preheated and filtered with a molecular sieve to remove impurities and water prior to being introduced to the vaporization chamber. A carrier gas is typically required in GC system to flow through the injector and push the gaseous components of the sample onto the GC column, which leads to the detector ( see more detail in detector section).
Column Oven
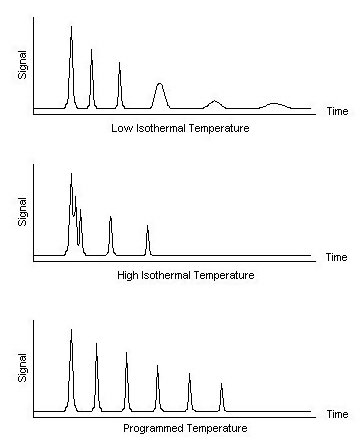
The thermostatted oven serves to control the temperature of the column within a few tenths of a degree to conduct precise work. The oven can be operated in two manners: isothermal programming or temperature programming. In isothermal programming, the temperature of the column is held constant throughout the entire separation. The optimum column temperature for isothermal operation is about the middle point of the boiling range of the sample. However, isothermal programming works best only if the boiling point range of the sample is narrow. If a low isothermal column temperature is used with a wide boiling point range, the low boiling fractions are well resolved but the high boiling fractions are slow to elute with extensive band broadening. If the temperature is increased closer to the boiling points of the higher boiling components, the higher boiling components elute as sharp peaks but the lower boiling components elute so quickly there is no separation.
In the temperature programming method, the column temperature is either increased continuously or in steps as the separation progresses. This method is well suited to separating a mixture with a broad boiling point range. The analysis begins at a low temperature to resolve the low boiling components and increases during the separation to resolve the less volatile, high boiling components of the sample. Rates of 5-7 °C/minute are typical for temperature programming separations.
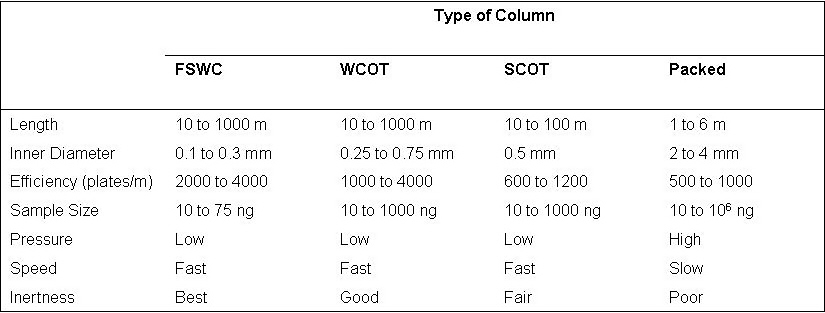
Open Tubular Columns and Packed Columns
Open tubular columns, which are also known as capillary columns, come in two basic forms. The first is a wall-coated open tubular (WCOT) column and the second type is a support-coated open tubular (SCOT) column. WCOT columns are capillary tubes that have a thin later of the stationary phase coated along the column walls. In SCOT columns, the column walls are first coated with a thin layer (about 30 micrometers thick) of adsorbant solid, such as diatomaceous earth, a material which consists of single-celled, sea-plant skeletons. The adsorbant solid is then treated with the liquid stationary phase. While SCOT columns are capable of holding a greater volume of stationary phase than a WCOT column due to its greater sample capacity, WCOT columns still have greater column efficiencies.
Most modern WCOT columns are made of glass, but T316 stainless steel, aluminum, copper and plastics have also been used. Each material has its own relative merits depending upon the application. Glass WCOT columns have the distinct advantage of chemical etching, which is usually achieved by gaseous or concentrated hydrochloric acid treatment. The etching process gives the glass a rough surface and allows the bonded stationary phase to adhere more tightly to the column surface.
One of the most popular types of capillary columns is a special WCOT column called the fused-silica wall-coated (FSWC) open tubular column. The walls of the fused-silica columns are drawn from purified silica containing minimal metal oxides. These columns are much thinner than glass columns, with diameters as small as 0.1 mm and lengths as long as 100 m. To protect the column, a polyimide coating is applied to the outside of the tubing and bent into coils to fit inside the thermostatted oven of the gas chromatography unit. The FSWC columns are commercially available and currently replacing older columns due to increased chemical inertness, greater column efficiency and smaller sampling size requirements. It is possible to achieve up to 400,000 theoretical plates with a 100 m WCOT column, yet the world record for the largest number of theoretical plates is over 2 million plates for 1.3 km section of column.
Packed columns are made of a glass or a metal tubing which is densely packed with a solid support like diatomaceous earth. Due to the difficulty of packing the tubing uniformly, these types of columns have a larger diameter than open tubular columns and have a limited range of length. As a result, packed columns can only achieve about 50% of the efficiency of a comparable WCOT column. Furthermore, the diatomaceous earth packing is deactivated over time due to the semi-permanent adsorption of impurities within the column. In contrast, FSWC open tubular columns are manufactured to be virtually free of these adsorption problems.
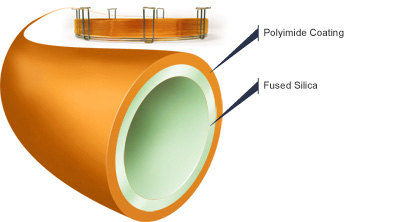
Different types of columns can be applied for different fields. Depending on the type of sample, some GC columns are better than the others. For example, the FSWC column shown in Figure 5 is designed specially for blood alcohol analysis. It produces fast run times with baseline resolution of key components in under 3 minutes. Moreover, it displays enhanced resolutions of ethanol and acetone peaks, which helps with determining the BAC levels. This particular column is known as Zebron-BAC and it made with polyimide coating on the outside and the inner layer is made of fused silica and the inner diameter ranges from .18 mm to .25 mm. There are also many other Zebron brand columns designed for other purposes.
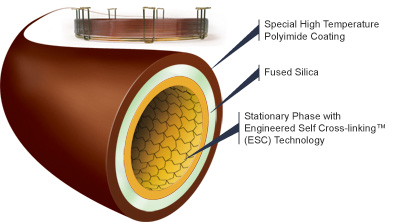
Another example of a Zebron GC column is known as the Zebron-inferno. Its outer layer is coated with a special type of polyimide that is designed to withstand high temperatures. As shown in figure 6, it contains an extra layer inside. It can withstand up to 430 °C to be exact and it is designed to provide true boiling point separation of hydrocarbons distillation methods. Moreover, it is also used for acidic and basic samples.
Detection Systems
The detector is the device located at the end of the column which provides a quantitative measurement of the components of the mixture as they elute in combination with the carrier gas. In theory, any property of the gaseous mixture that is different from the carrier gas can be used as a detection method. These detection properties fall into two categories: bulk properties and specific properties. Bulk properties, which are also known as general properties, are properties that both the carrier gas and analyte possess but to different degrees. Specific properties, such as detectors that measure nitrogen-phosphorous content, have limited applications but compensate for this by their increased sensitivity.
Each detector has two main parts that when used together they serve as transducers to convert the detected property changes into an electrical signal that is recorded as a chromatogram. The first part of the detector is the sensor which is placed as close the the column exit as possible in order to optimize detection. The second is the electronic equipment used to digitize the analog signal so that a computer may analyze the acquired chromatogram. The sooner the analog signal is converted into a digital signal, the greater the signal-to-noise ratio becomes, as analog signal are easily susceptible to many types of interferences.
An ideal GC detector is distinguished by several characteristics. The first requirement is adequate sensitivity to provide a high resolution signal for all components in the mixture. This is clearly an idealized statement as such a sample would approach zero volume and the detector would need infinite sensitivity to detect it. In modern instruments, the sensitivities of the detectors are in the range of 10-8 to 10-15 g of solute per second. Furthermore, the quantity of sample must be reproducible and many columns will distort peaks if enough sample is not injected. An ideal column will also be chemically inert and and should not alter the sample in any way. Optimized columns will be able to withstand temperatures in the range of -200 °C to at least 400 °C. In addition, such a column would have a short linear response time that is independent of flow rate and extends for several orders of magnitude. Moreover, the detector should be reliable, predictable and easy to operate.
Understandably, it is not possible for a detector meet all of these requirements. The next subsections will discuss some of the more common types of gas chromatography detectors and the relative advantages and/or disadvantages of each.
|
Type of Detector |
Applicable Samples |
Detection Limit |
|---|---|---|
|
Mass Spectrometer (MS) |
Tunable for any sample |
.25 to 100 pg |
|
Flame Ionization (FID) |
Hydrocarbons |
1 pg/s |
|
Thermal Conductivity (TCD) |
Universal |
500 pg/ml |
|
Electron-Capture (ECD) |
Halogenated hydrocarbons |
5 fg/s |
|
Atomic Emission (AED) |
Element-selective |
1 pg |
|
Chemiluminescence (CS) |
Oxidizing reagent |
Dark current of PMT |
|
Photoionization (PID) |
Vapor and gaseous Compounds |
.002 to .02 µg/L |
Mass Spectrometry Detectors
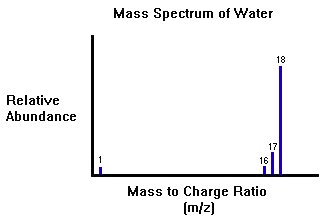
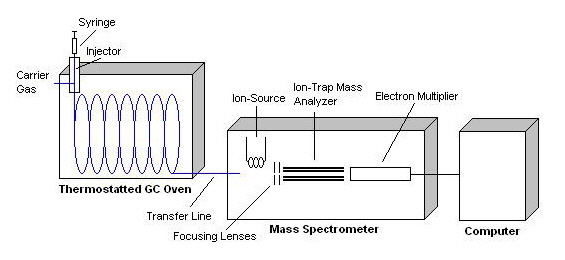
Mass Spectrometer (MS) detectors are most powerful of all gas chromatography detectors. In a GC/MS system, the mass spectrometer scans the masses continuously throughout the separation. When the sample exits the chromatography column, it is passed through a transfer line into the inlet of the mass spectrometer . The sample is then ionized and fragmented, typically by an electron-impact ion source. During this process, the sample is bombarded by energetic electrons which ionize the molecule by causing them to lose an electron due to electrostatic repulsion. Further bombardment causes the ions to fragment. The ions are then passed into a mass analyzer where the ions are sorted according to their m/z value, or mass-to-charge ratio. Most ions are only singly charged.
The Chromatogram will point out the retention times and the mass spectrometer will use the peaks to determine what kind of molecules are exist in the mixture. The figure below represents a typical mass spectrum of water with the absorption peaks at the appropriate m/z ratios.
Instrumentation
One of the most common types of mass analyzer in GC/MS is the quadrupole ion-trap analyzer, which allows gaseous anions or cations to be held for long periods of time by electric and magnetic fields. A simple quadrupole ion-trap consists of a hollow ring electrode with two grounded end-cap electrodes as seen in figure #. Ions are allowed into the cavity through a grid in the upper end cap. A variable radio-frequency is applied to the ring electrode and ions with an appropriate m/z value orbit around the cavity. As the radio-frequency is increased linearly, ions of a stable m/z value are ejected by mass-selective ejection in order of mass. Ions that are too heavy or too light are destabilized and their charge is neutralized upon collision with the ring electrode wall. Emitted ions then strike an electron multiplier which converts the detected ions into an electrical signal. This electrical signal is then picked up by the computer through various programs. As an end result, a chromatogram is produced representing the m/z ratio versus the abundance of the sample.
GC/MS units are advantageous because they allow for the immediate determination of the mass of the analyte and can be used to identify the components of incomplete separations. They are rugged, easy to use and can analyze the sample almost as quickly as it is eluted. The disadvantages of mass spectrometry detectors are the tendency for samples to thermally degrade before detection and the end result of obliterating all the sample by fragmentation.
Flame Ionization Detectors
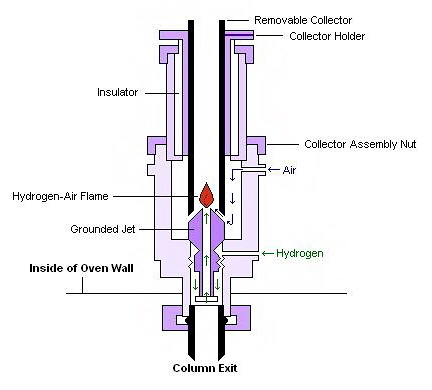
Flame ionization detectors (FID) are the most generally applicable and most widely used detectors. In a FID, the sample is directed at an air-hydrogen flame after exiting the column. At the high temperature of the air-hydrogen flame, the sample undergoes pyrolysis, or chemical decomposition through intense heating. Pyrolized hydrocarbons release ions and electrons that carry current. A high-impedance picoammeter measures this current to monitor the sample's elution.
It is advantageous to use FID because the detector is unaffected by flow rate, noncombustible gases and water. These properties allow FID high sensitivity and low noise. The unit is both reliable and relatively easy to use. However, this technique does require flammable gas and also destroys the sample.
.JPG?revision=1&size=bestfit&width=432&height=390)
Thermal Conductivity Detectors
Thermal conductivity detectors (TCD) were one the earliest detectors developed for use with gas chromatography. The TCD works by measuring the change in carrier gas thermal conductivity caused by the presence of the sample, which has a different thermal conductivity from that of the carrier gas. Their design is relatively simple, and consists of an electrically heated source that is maintained at constant power. The temperature of the source depends upon the thermal conductivities of the surrounding gases. The source is usually a thin wire made of platinum, gold or . The resistance within the wire depends upon temperature, which is dependent upon the thermal conductivity of the gas.
TCDs usually employ two detectors, one of which is used as the reference for the carrier gas and the other which monitors the thermal conductivity of the carrier gas and sample mixture. Carrier gases such as helium and hydrogen has very high thermal conductivities so the addition of even a small amount of sample is readily detected.
The advantages of TCDs are the ease and simplicity of use, the devices' broad application to inorganic and organic compounds, and the ability of the analyte to be collected after separation and detection. The greatest drawback of the TCD is the low sensitivity of the instrument in relation to other detection methods, in addition to flow rate and concentration dependency.
.JPG?revision=1)
Chromatogram
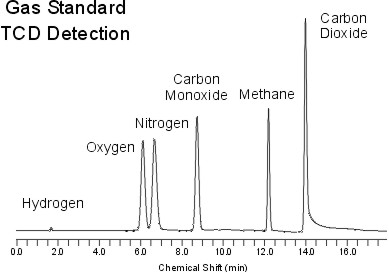
Figure 13 represents a standard chromatogram produced by a TCD detector. In a standard chromatogram regardless of the type detector, the x-axis is the time and the y-axis is the abundance or the absorbance. From these chromatograms, retention times and the peak heights are determined and used to further investigate the chemical properties or the abundance of the samples.
Electron-capture Detectors
Electron-capture detectors (ECD) are highly selective detectors commonly used for detecting environmental samples as the device selectively detects organic compounds with moieties such as halogens, peroxides, quinones and nitro groups and gives little to no response for all other compounds. Therefore, this method is best suited in applications where traces quantities of chemicals such as pesticides are to be detected and other chromatographic methods are unfeasible.
The simplest form of ECD involves gaseous electrons from a radioactive ? emitter in an electric field. As the analyte leaves the GC column, it is passed over this ? emitter, which typically consists of nickle-63 or tritium. The electrons from the ? emitter ionize the nitrogen carrier gas and cause it to release a burst of electrons. In the absence of organic compounds, a constant standing current is maintained between two electrodes. With the addition of organic compounds with electronegative functional groups, the current decreases significantly as the functional groups capture the electrons.
The advantages of ECDs are the high selectivity and sensitivity towards certain organic species with electronegative functional groups. However, the detector has a limited signal range and is potentially dangerous owing to its radioactivity. In addition, the signal-to-noise ratio is limited by radioactive decay and the presence of O2 within the detector.
.JPG?revision=1&size=bestfit&width=411&height=364)
Atomic Emission Detectors
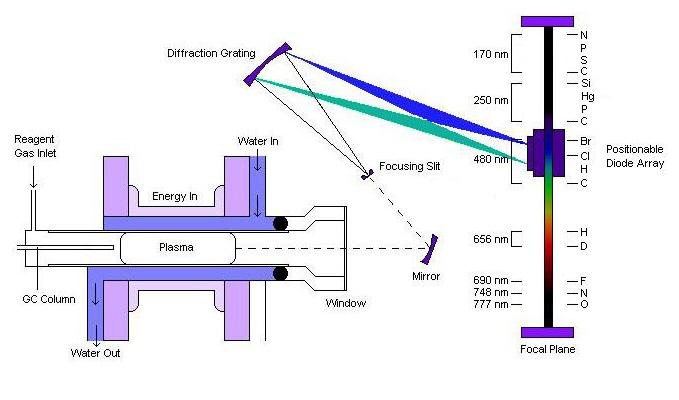
Atomic emission detectors (AED), one of the newest addition to the gas chromatographer's arsenal, are element-selective detectors that utilize plasma, which is a partially ionized gas, to atomize all of the elements of a sample and excite their characteristic atomic emission spectra. AED is an extremely powerful alternative that has a wider applicability due to its based on the detection of atomic emissions.There are three ways of generating plasma: microwave-induced plasma (MIP), inductively coupled plasma (ICP) or direct current plasma (DCP). MIP is the most commonly employed form and is used with a positionable diode array to simultaneously monitor the atomic emission spectra of several elements.
Instrumentation
The components of the Atomic emission detectors include 1) an interface for the incoming capillary GC column to induce plasma chamber,2) a microwave chamber, 3) a cooling system, 4) a diffration grating that associated optics, and 5) a position adjustable photodiode array interfaced to a computer.
GC Chemiluminescence Detectors
Chemiluminescence spectroscopy (CS) is a process in which both qualitative and quantitative properties can be be determined using the optical emission from excited chemical species. It is very similar to AES, but the difference is that it utilizes the light emitted from the energized molecules rather than just excited molecules. Moreover, chemiluminescence can occur in either the solution or gas phase whereas AES is designed for gaseous phases. The light source for chemiluminescence comes from the reactions of the chemicals such that it produces light energy as a product. This light band is used instead of a separate source of light such as a light beam.
Like other methods, CS also has its limitations and the major limitation to the detection limits of CS concerns with the use of a photomultiplier tube (PMT). A PMT requires a dark current in it to detect the light emitted from the analyte.
Photoionization Detectors
Another different kind of detector for GC is the photoionization detector which utilizes the properties of chemiluminescence spectroscopy. Photoionization detector (PID) is a portable vapor and gas detector that has selective determination of aromatic hydrocarbons, organo-heteroatom, inorganice species and other organic compounds. PID comprise of an ultrviolet lamp to emit photons that are absorbed by the compounds in an ionization chamber exiting from a GC column. Small fraction of the analyte molecules are actually ionized, nondestructive, allowing confirmation analytical results through other detectors. In addition, PIDs are available in portable hand-held models and in a number of lamp configurations. Results are almost immediate. PID is used commonly to detect VOCs in soil, sediment, air and water, which is often used to detect contaminants in ambient air and soil. The disavantage of PID is unable to detect certain hydrocarbon that has low molecular weight, such as methane and ethane.
Instrumentation
Limitations
- Not suitable for detecting semi-volatile compounds
- Only indicates if volatile organic compounds are presents.
- High concentration so methane are required for higher performance.
- Frequent calibration are required.
- Units of parts per million range
- Enviromental distraction, especially water vapor.
- Strong electrical fieldsRapid variation in temperature at the detector and naturally occurring compounds may affect instrumental signal.
Applications
Gas chromatography is a physical separation method in where volatile mixtures are separated. It can be used in many different fields such as pharmaceuticals, cosmetics and even environmental toxins. Since the samples have to be volatile, human breathe, blood, saliva and other secretions containing large amounts of organic volatiles can be easily analyzed using GC. Knowing the amount of which compound is in a given sample gives a huge advantage in studying the effects of human health and of the environment as well.
Air samples can be analyzed using GC. Most of the time, air quality control units use GC coupled with FID in order to determine the components of a given air sample. Although other detectors are useful as well, FID is the most appropriate because of its sensitivity and resolution and also because it can detect very small molecules as well.
GC/MS is also another useful method which can determine the components of a given mixture using the retention times and the abundance of the samples. This method be applied to many pharmaceutical applications such as identifying the amount of chemicals in drugs. Moreover, cosmetic manufacturers also use this method to effectively measure how much of each chemical is used for their products.
Equations
“Height equivalent to a theoretical plate” (HETP) use to calculate the flow rate by usingthe total number of theoretical plates (N) and column length (L). Some application, HETP concepts is used in industrial practice to convert number of theoretical plates to packing height. HETP can be calculate with the Van Deemter equation, which is given by
\[ HETP= A + \dfrac{B}{υ} + Cv \tag{1} \]
Where A and B and C are constants and v is the linear velocity (carrier flow rate).
- A is the "Eddy-Diffusion" term and causes the broadening of the solute band.
- B is the "Longitudinal diffusion" term whereby the concentration of the analyte, in which diffuses out from the center to the edges.This causes the broadering of the analyte band.
- C is the "Resistance to Mass Transfer " term and causes the band of the analyte broader.
L is the length of the column, where N is the number of theoretical plates, tR is the retention time, and ω is the width of the elution peak at its base.
In which, the more plates give a better resolution and more efficiency. Resolution can be determined by \[R= 2\left[ \dfrac{(tR)B – (tR)A}{ WA +WB}\right] \tag{4} \] A relationship between the plates and resolution is giving by, \[ R= (N)1/2 /4) ( \alpha -\dfrac{1}{\alpha}) ( 1+ \dfrac{K’B}{ K’B}) \tag{5} \] Where the selectivity, a, and k' is the capacity factors take places of the two solutes. The selectivity and capacity factors can be control by improving separation, such as changing mobile/ stationary phase composition, column temperature and use a special chemical effect.
References
- Skoog, D. A.; Holler, F. J.; Crouch, S. R. Principles of Instrumental Analysis. Sixth Edition, Thomson Brooks/Cole, USA, 2007.
- Krugers, J. Instrumentation in Gas Chromatography. Centrex Publishing Company-Eindhoven, Netherlands, 1968.
- Hubschmann, H. Handbook of GC/MS: Fundamentals and Applications. Wiley-VCH Verlag, Germany, 2001.
- Scott, R. P. W. Chromatographic Detectors: Design, Function, and Operation. Marcel Dekker, Inc., USA, 1996.
- J.N. Driscoll. REview of Photoionization Detection in Gas Chromatography: The first Decade. Journal of CHromatographic Science , Vol 23. November 1985. 488-492.
- Boer, H. , "Vapour phase Chromatography", ed. Desty, D. H., 169 (Butterworths Sci. Pub., London, 1957).
- Dimbat, M. , Porter, P. E. , and Stross, F. H. , Anal. Chem., 28, 290 (1956). | Article | ISI | ChemPort |
Contributors and Attributions
- Kyaw Thet (UC Davis), Nancy Woo (UC Davis)