
4.1: Spectroscopy- Basic Elements and Principles
- Page ID
- 398278

\( \newcommand{\vecs}[1]{\overset { \scriptstyle \rightharpoonup} {\mathbf{#1}} } \)
\( \newcommand{\vecd}[1]{\overset{-\!-\!\rightharpoonup}{\vphantom{a}\smash {#1}}} \)
\( \newcommand{\id}{\mathrm{id}}\) \( \newcommand{\Span}{\mathrm{span}}\)
( \newcommand{\kernel}{\mathrm{null}\,}\) \( \newcommand{\range}{\mathrm{range}\,}\)
\( \newcommand{\RealPart}{\mathrm{Re}}\) \( \newcommand{\ImaginaryPart}{\mathrm{Im}}\)
\( \newcommand{\Argument}{\mathrm{Arg}}\) \( \newcommand{\norm}[1]{\| #1 \|}\)
\( \newcommand{\inner}[2]{\langle #1, #2 \rangle}\)
\( \newcommand{\Span}{\mathrm{span}}\)
\( \newcommand{\id}{\mathrm{id}}\)
\( \newcommand{\Span}{\mathrm{span}}\)
\( \newcommand{\kernel}{\mathrm{null}\,}\)
\( \newcommand{\range}{\mathrm{range}\,}\)
\( \newcommand{\RealPart}{\mathrm{Re}}\)
\( \newcommand{\ImaginaryPart}{\mathrm{Im}}\)
\( \newcommand{\Argument}{\mathrm{Arg}}\)
\( \newcommand{\norm}[1]{\| #1 \|}\)
\( \newcommand{\inner}[2]{\langle #1, #2 \rangle}\)
\( \newcommand{\Span}{\mathrm{span}}\) \( \newcommand{\AA}{\unicode[.8,0]{x212B}}\)
\( \newcommand{\vectorA}[1]{\vec{#1}} % arrow\)
\( \newcommand{\vectorAt}[1]{\vec{\text{#1}}} % arrow\)
\( \newcommand{\vectorB}[1]{\overset { \scriptstyle \rightharpoonup} {\mathbf{#1}} } \)
\( \newcommand{\vectorC}[1]{\textbf{#1}} \)
\( \newcommand{\vectorD}[1]{\overrightarrow{#1}} \)
\( \newcommand{\vectorDt}[1]{\overrightarrow{\text{#1}}} \)
\( \newcommand{\vectE}[1]{\overset{-\!-\!\rightharpoonup}{\vphantom{a}\smash{\mathbf {#1}}}} \)
\( \newcommand{\vecs}[1]{\overset { \scriptstyle \rightharpoonup} {\mathbf{#1}} } \)
\( \newcommand{\vecd}[1]{\overset{-\!-\!\rightharpoonup}{\vphantom{a}\smash {#1}}} \)
\(\newcommand{\avec}{\mathbf a}\) \(\newcommand{\bvec}{\mathbf b}\) \(\newcommand{\cvec}{\mathbf c}\) \(\newcommand{\dvec}{\mathbf d}\) \(\newcommand{\dtil}{\widetilde{\mathbf d}}\) \(\newcommand{\evec}{\mathbf e}\) \(\newcommand{\fvec}{\mathbf f}\) \(\newcommand{\nvec}{\mathbf n}\) \(\newcommand{\pvec}{\mathbf p}\) \(\newcommand{\qvec}{\mathbf q}\) \(\newcommand{\svec}{\mathbf s}\) \(\newcommand{\tvec}{\mathbf t}\) \(\newcommand{\uvec}{\mathbf u}\) \(\newcommand{\vvec}{\mathbf v}\) \(\newcommand{\wvec}{\mathbf w}\) \(\newcommand{\xvec}{\mathbf x}\) \(\newcommand{\yvec}{\mathbf y}\) \(\newcommand{\zvec}{\mathbf z}\) \(\newcommand{\rvec}{\mathbf r}\) \(\newcommand{\mvec}{\mathbf m}\) \(\newcommand{\zerovec}{\mathbf 0}\) \(\newcommand{\onevec}{\mathbf 1}\) \(\newcommand{\real}{\mathbb R}\) \(\newcommand{\twovec}[2]{\left[\begin{array}{r}#1 \\ #2 \end{array}\right]}\) \(\newcommand{\ctwovec}[2]{\left[\begin{array}{c}#1 \\ #2 \end{array}\right]}\) \(\newcommand{\threevec}[3]{\left[\begin{array}{r}#1 \\ #2 \\ #3 \end{array}\right]}\) \(\newcommand{\cthreevec}[3]{\left[\begin{array}{c}#1 \\ #2 \\ #3 \end{array}\right]}\) \(\newcommand{\fourvec}[4]{\left[\begin{array}{r}#1 \\ #2 \\ #3 \\ #4 \end{array}\right]}\) \(\newcommand{\cfourvec}[4]{\left[\begin{array}{c}#1 \\ #2 \\ #3 \\ #4 \end{array}\right]}\) \(\newcommand{\fivevec}[5]{\left[\begin{array}{r}#1 \\ #2 \\ #3 \\ #4 \\ #5 \\ \end{array}\right]}\) \(\newcommand{\cfivevec}[5]{\left[\begin{array}{c}#1 \\ #2 \\ #3 \\ #4 \\ #5 \\ \end{array}\right]}\) \(\newcommand{\mattwo}[4]{\left[\begin{array}{rr}#1 \amp #2 \\ #3 \amp #4 \\ \end{array}\right]}\) \(\newcommand{\laspan}[1]{\text{Span}\{#1\}}\) \(\newcommand{\bcal}{\cal B}\) \(\newcommand{\ccal}{\cal C}\) \(\newcommand{\scal}{\cal S}\) \(\newcommand{\wcal}{\cal W}\) \(\newcommand{\ecal}{\cal E}\) \(\newcommand{\coords}[2]{\left\{#1\right\}_{#2}}\) \(\newcommand{\gray}[1]{\color{gray}{#1}}\) \(\newcommand{\lgray}[1]{\color{lightgray}{#1}}\) \(\newcommand{\rank}{\operatorname{rank}}\) \(\newcommand{\row}{\text{Row}}\) \(\newcommand{\col}{\text{Col}}\) \(\renewcommand{\row}{\text{Row}}\) \(\newcommand{\nul}{\text{Nul}}\) \(\newcommand{\var}{\text{Var}}\) \(\newcommand{\corr}{\text{corr}}\) \(\newcommand{\len}[1]{\left|#1\right|}\) \(\newcommand{\bbar}{\overline{\bvec}}\) \(\newcommand{\bhat}{\widehat{\bvec}}\) \(\newcommand{\bperp}{\bvec^\perp}\) \(\newcommand{\xhat}{\widehat{\xvec}}\) \(\newcommand{\vhat}{\widehat{\vvec}}\) \(\newcommand{\uhat}{\widehat{\uvec}}\) \(\newcommand{\what}{\widehat{\wvec}}\) \(\newcommand{\Sighat}{\widehat{\Sigma}}\) \(\newcommand{\lt}{<}\) \(\newcommand{\gt}{>}\) \(\newcommand{\amp}{&}\) \(\definecolor{fillinmathshade}{gray}{0.9}\)In this Chapter, we will introduce a general notion of spectroscopy as a method and of its most basic type of data, a spectrum. We will also introduce the most basic features of each spectroscopic signal (spectral line or resonance): position, intensity and width/lineshape. Lastly, we will take a look at a relationship between quantum chemistry features of a sample (energy levels of electrons and other quantized particles) and spectral properties a such a sample.
- Grasp the definition of spectroscopy and a spectrum as the most basic item reported by spectroscopic measurements.
- Distinguish between the three key features of a spectral line (aka signal or peak): position, intensity, line-width.
- Master the quantitative relationships between frequency, energy and wavelength.
- Get familiar with the concept of spectral width: frequency, energy or wavelength range covered by the spectrum.
Spectroscopy: definition and examples
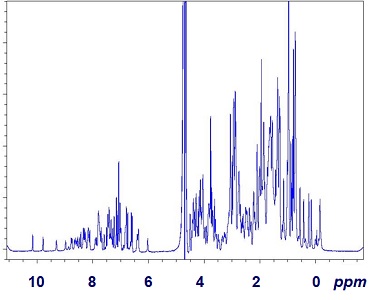
In general, the term “spectroscopy” can be applied to an experimental method, which reports a set of values (“intensities”) as function of certain “frequency” or related variables. In this sense, spectroscopy is very different from other types of measurements. For example, reporting mass of an object takes only one value, same for an object’s speed or concentration of solution, etc. Contrary to that, a spectrum inherently represents a function relating intensity (Y axis) to frequency (X axis). The X-axis may be represented by other variables related to frequency, e.g. energy, wavelength or some derivative of those. Figure IV.1.A shows an NMR spectrum of a protein sample with the X-axis labeled in ppm, a type of units representing frequency.
The spectrum has many tens if not hundreds of resonance lines (or peaks, signals). Some of these signals stand alone (are well-resolved) and thus are easy to be distinguished from others, e.g. peaks on the left at around 10 ppm. Most other peaks however strongly overlap, which may complicate their analysis.
Spectroscopy: basic parameters
For each spectral line (aka signal or peak), three foundational parameters provide its complete description:
- Position: the X-axis value of the maximum of the peak;
- Intensity: the Y-axis value of the maximum of the signal or the area under the curve of the peak
- Linewidth: the X-axis measure of how broad or narrow the spectral line is (for example reported as line width at half-height, LWHH).
These three parameters determined for every peak in the spectrum provide the complete description of the spectral data. In addition, many types of spectroscopy need to take into account the level of noise of the recording: the value of uncertainty along the Y-axis for every measured point of the spectrum. Usually, noise level is uniform throughout the sample but there can be some exceptions.
Two integrated parameters, sensitivity and resolution are often used to describe the quality or usefulness of a particular spectrum.
- Sensitivity Qualitative definition: the ability of a user to distinguish real signals from noise “blips” or background. Quantitative estimate: signal-to-noise ratio, value much greater than 1 represents a high-sensitivity spectrum). Higher (“stronger”) peaks and lower noise help to increase the sensitivity.
- Resolution Qualitative definition: the ability of a user to distinguish adjacent spectral signals from each other. Quantitative estimate: two peaks can be reliably “resolved” if the difference along the X-axis between their positions is much greater than the average of their respective line width values. Spectra with narrower (“sharper”) peaks have greater resolution.
Quantitatively, sensitivity can be estimated as the signal/noise ratio using the weakest peak's signal intensity. A resolution value can be quantified for any two signals (peaks) as a ratio of the inter-peak distance over the average peak linewidth, e.g. LWHH. Calculated in this way, sensitivity and resolution are both unitless quantities.
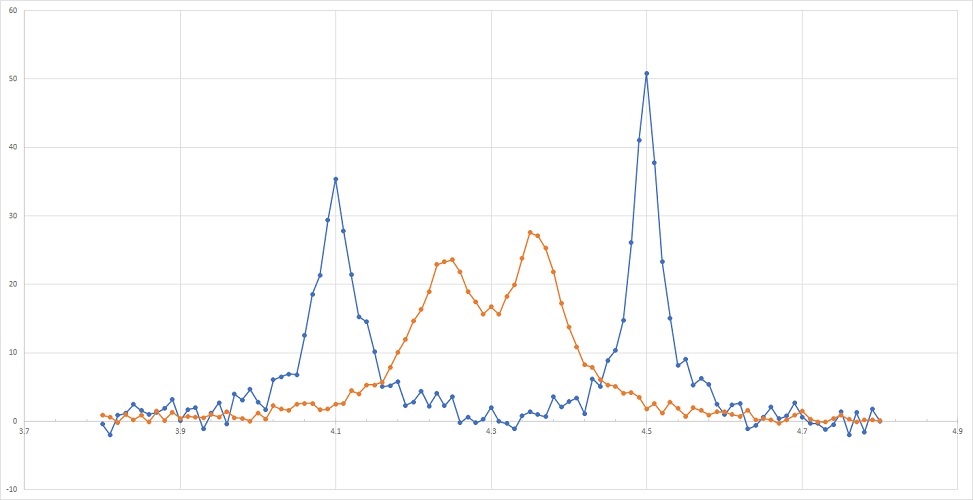
Solid resolution and sensitivity afford reliable determination of all the three fundamental signal parameters: signal position, intensity and line shape. Insufficient sensitivity may prevent correct quantification of the peak intensity and is some cases signal position. Likewise, poor spectral resolution could result in obscured peaks positions, distort ed line shape and misrepresented signal intensity (see Figure IV.1.B).
Big picture: Common types of spectroscopic techniques widely utilized in biochemistry and life sciences include the following varieties: fluorescent/phosphorescent, Nuclear Magnetic Resonance spectroscopy, ultraviolet (UV) and visual range (VIS) methods, circular dichroism, infrared (IR) spectroscopy and others.
Relationship between quantum particle energy, frequency and wavelength
In many spectroscopic applications, physics describes the fundamental properties of the target system, including the energy differences between the relevant states of the system. Depending on the process under study, the laws of either classical physics or quantum physics may be the most applicable. Applications of both of these types of physics to specific variants of spectroscopic methods will be discussed in the next sections of this Chapter as well as in the next Chapters.
In general quantum physics provides the following quantitative relationships between energy \(E\), frequency \(\nu\) and wavelength \(\lambda\) values of a wave-particle quantum:
Equation \ref{EQ:efw1}
\[\begin{eqnarray}E &=& h \cdot \nu \\[4pt] c &=& \lambda \cdot \nu\label{EQ:efw1}\end{eqnarray}\]
These relationships are parametrized via two universal constants, speed of light \(c\) and Plank’s constant \(h\). From these formulas, we see that quantum’s frequency and energy values are inversely proportional to its wavelength. Thus, in Table IV.1.I the frequency and energy values grow from left to right, whereas the wavelength values grow from right to left (and hence each wavelength range is bracketed from its largest to smallest values).

Examples (Quiz MC questions with a new Spectrum will be presented from the Examples here)
Let’s take a quick look at the spectrum in Figure IV.1.A above. Here are some comments on sensitivity and resolution with some peaks as study cases.
- General assessment: the spectrum allows reliable observation of some individual signals and shows some groups of signals which appear as collectives. Thus, the spectrum has some value but its sensitivity and resolution need to be analyzed critically.
- The sensitivity of this recording is overall strong as the noise level (wiggles of the baseline) is obviously lower than the intensity of most peaks and the signal-to-noise level is way greater than the value of 1.
- An example of well resolved peaks: two signals, one right below 10 ppm and one right above it are well-resolved. Another example of a well-resolved peak is the line at 6 ppm. For these peaks, the recording provides an excellent resolution.
- An example of poor/insufficient resolution: most peaks within 1-2 ppm and 8-9 ppm are not resolved from the adjacent spectral lines.
- The frequency (X-axis) of the spectrum is labeled in units of parts-per-million (ppm). The X-axis covers a range of values form -1.5 ppm (on the right) to 11.0 ppm (on the left). Thus the spectral width of the spectrum is 12.5 ppm (11.0 - (-1.5)).
Practice problems
Problems 1 – 3 below request your analysis of these spectra’s sensitivity and resolution. Problems 4 and 5 target the relationship between the wavelength, frequency and energy of UV light often used in spectroscopic measurements.
Practice problem 1. Which spectrum in Figure IV.1.B (orange or blue) has greater sensitivity? Provide both qualitative and quantitative justification.
Practice problem 2. What are the peak positions of the two peaks of the blues spectrum? What are the peak positions of the two peaks of the orange spectrum?
Practice problem 3. Which spectrum (orange or blue) has greater resolution? Provide quantitative justification.
Practice problem 4. The absorbance of nucleic acids in UV range peaks at about 260 nm. What is the energy value (in Joules) of a quantum of UV light at this wavelength? Is this energy higher or lower than the energy of a covalent carbon-carbon bond ?
Practice problem 5. The absorbance of nucleic acids in UV range peaks at about 260 nm. What is the energy value (in Joules) of a quantum of UV light at this wavelength? Is this energy higher or lower than the energy of a hydrogen bond ?