16.3: A Cubic Equation of State
- Page ID
- 57449
\( \newcommand{\vecs}[1]{\overset { \scriptstyle \rightharpoonup} {\mathbf{#1}} } \)
\( \newcommand{\vecd}[1]{\overset{-\!-\!\rightharpoonup}{\vphantom{a}\smash {#1}}} \)
\( \newcommand{\id}{\mathrm{id}}\) \( \newcommand{\Span}{\mathrm{span}}\)
( \newcommand{\kernel}{\mathrm{null}\,}\) \( \newcommand{\range}{\mathrm{range}\,}\)
\( \newcommand{\RealPart}{\mathrm{Re}}\) \( \newcommand{\ImaginaryPart}{\mathrm{Im}}\)
\( \newcommand{\Argument}{\mathrm{Arg}}\) \( \newcommand{\norm}[1]{\| #1 \|}\)
\( \newcommand{\inner}[2]{\langle #1, #2 \rangle}\)
\( \newcommand{\Span}{\mathrm{span}}\)
\( \newcommand{\id}{\mathrm{id}}\)
\( \newcommand{\Span}{\mathrm{span}}\)
\( \newcommand{\kernel}{\mathrm{null}\,}\)
\( \newcommand{\range}{\mathrm{range}\,}\)
\( \newcommand{\RealPart}{\mathrm{Re}}\)
\( \newcommand{\ImaginaryPart}{\mathrm{Im}}\)
\( \newcommand{\Argument}{\mathrm{Arg}}\)
\( \newcommand{\norm}[1]{\| #1 \|}\)
\( \newcommand{\inner}[2]{\langle #1, #2 \rangle}\)
\( \newcommand{\Span}{\mathrm{span}}\) \( \newcommand{\AA}{\unicode[.8,0]{x212B}}\)
\( \newcommand{\vectorA}[1]{\vec{#1}} % arrow\)
\( \newcommand{\vectorAt}[1]{\vec{\text{#1}}} % arrow\)
\( \newcommand{\vectorB}[1]{\overset { \scriptstyle \rightharpoonup} {\mathbf{#1}} } \)
\( \newcommand{\vectorC}[1]{\textbf{#1}} \)
\( \newcommand{\vectorD}[1]{\overrightarrow{#1}} \)
\( \newcommand{\vectorDt}[1]{\overrightarrow{\text{#1}}} \)
\( \newcommand{\vectE}[1]{\overset{-\!-\!\rightharpoonup}{\vphantom{a}\smash{\mathbf {#1}}}} \)
\( \newcommand{\vecs}[1]{\overset { \scriptstyle \rightharpoonup} {\mathbf{#1}} } \)
\( \newcommand{\vecd}[1]{\overset{-\!-\!\rightharpoonup}{\vphantom{a}\smash {#1}}} \)
\(\newcommand{\avec}{\mathbf a}\) \(\newcommand{\bvec}{\mathbf b}\) \(\newcommand{\cvec}{\mathbf c}\) \(\newcommand{\dvec}{\mathbf d}\) \(\newcommand{\dtil}{\widetilde{\mathbf d}}\) \(\newcommand{\evec}{\mathbf e}\) \(\newcommand{\fvec}{\mathbf f}\) \(\newcommand{\nvec}{\mathbf n}\) \(\newcommand{\pvec}{\mathbf p}\) \(\newcommand{\qvec}{\mathbf q}\) \(\newcommand{\svec}{\mathbf s}\) \(\newcommand{\tvec}{\mathbf t}\) \(\newcommand{\uvec}{\mathbf u}\) \(\newcommand{\vvec}{\mathbf v}\) \(\newcommand{\wvec}{\mathbf w}\) \(\newcommand{\xvec}{\mathbf x}\) \(\newcommand{\yvec}{\mathbf y}\) \(\newcommand{\zvec}{\mathbf z}\) \(\newcommand{\rvec}{\mathbf r}\) \(\newcommand{\mvec}{\mathbf m}\) \(\newcommand{\zerovec}{\mathbf 0}\) \(\newcommand{\onevec}{\mathbf 1}\) \(\newcommand{\real}{\mathbb R}\) \(\newcommand{\twovec}[2]{\left[\begin{array}{r}#1 \\ #2 \end{array}\right]}\) \(\newcommand{\ctwovec}[2]{\left[\begin{array}{c}#1 \\ #2 \end{array}\right]}\) \(\newcommand{\threevec}[3]{\left[\begin{array}{r}#1 \\ #2 \\ #3 \end{array}\right]}\) \(\newcommand{\cthreevec}[3]{\left[\begin{array}{c}#1 \\ #2 \\ #3 \end{array}\right]}\) \(\newcommand{\fourvec}[4]{\left[\begin{array}{r}#1 \\ #2 \\ #3 \\ #4 \end{array}\right]}\) \(\newcommand{\cfourvec}[4]{\left[\begin{array}{c}#1 \\ #2 \\ #3 \\ #4 \end{array}\right]}\) \(\newcommand{\fivevec}[5]{\left[\begin{array}{r}#1 \\ #2 \\ #3 \\ #4 \\ #5 \\ \end{array}\right]}\) \(\newcommand{\cfivevec}[5]{\left[\begin{array}{c}#1 \\ #2 \\ #3 \\ #4 \\ #5 \\ \end{array}\right]}\) \(\newcommand{\mattwo}[4]{\left[\begin{array}{rr}#1 \amp #2 \\ #3 \amp #4 \\ \end{array}\right]}\) \(\newcommand{\laspan}[1]{\text{Span}\{#1\}}\) \(\newcommand{\bcal}{\cal B}\) \(\newcommand{\ccal}{\cal C}\) \(\newcommand{\scal}{\cal S}\) \(\newcommand{\wcal}{\cal W}\) \(\newcommand{\ecal}{\cal E}\) \(\newcommand{\coords}[2]{\left\{#1\right\}_{#2}}\) \(\newcommand{\gray}[1]{\color{gray}{#1}}\) \(\newcommand{\lgray}[1]{\color{lightgray}{#1}}\) \(\newcommand{\rank}{\operatorname{rank}}\) \(\newcommand{\row}{\text{Row}}\) \(\newcommand{\col}{\text{Col}}\) \(\renewcommand{\row}{\text{Row}}\) \(\newcommand{\nul}{\text{Nul}}\) \(\newcommand{\var}{\text{Var}}\) \(\newcommand{\corr}{\text{corr}}\) \(\newcommand{\len}[1]{\left|#1\right|}\) \(\newcommand{\bbar}{\overline{\bvec}}\) \(\newcommand{\bhat}{\widehat{\bvec}}\) \(\newcommand{\bperp}{\bvec^\perp}\) \(\newcommand{\xhat}{\widehat{\xvec}}\) \(\newcommand{\vhat}{\widehat{\vvec}}\) \(\newcommand{\uhat}{\widehat{\uvec}}\) \(\newcommand{\what}{\widehat{\wvec}}\) \(\newcommand{\Sighat}{\widehat{\Sigma}}\) \(\newcommand{\lt}{<}\) \(\newcommand{\gt}{>}\) \(\newcommand{\amp}{&}\) \(\definecolor{fillinmathshade}{gray}{0.9}\)Isotherms
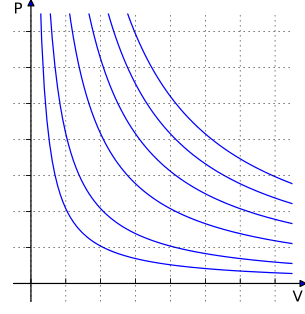
Isotherms are plots of the pressure of a gas as a function of volume at a fixed constant temperature. The isotherms for an ideal gas are hypberbolas:
\[P=\dfrac{RT}{\bar{V}} \nonumber \]
where \(\bar{V}\) is the molar volume \(V/n\). We know that at sufficiently low temperatures, any real gas, when compressed, must undergo a transition from gas to liquid. The signature of such a transition is a discontinuous change in the volume, signifying the condensation of the gas into a liquid that occupies a significantly lower volume.

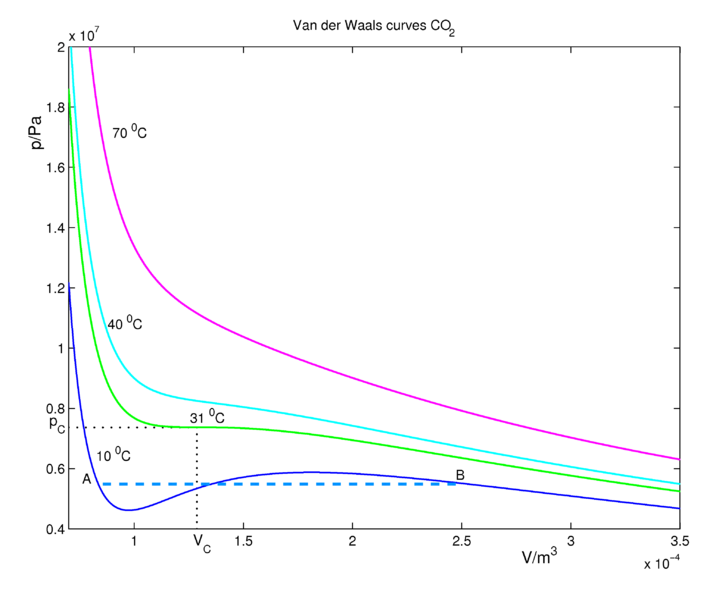
CO2 isotherms for the van der Waals Equation of state are shown in Figure 16.3.2 . At sufficiently high temperatures, the isotherms approach those of an ideal gas. At lower temperatures, the fluid obeys approximately the ideal gas law \(PV=nRT\) at large volumes when the pressures are low. If we decrease the volume (go to the left in the figure along an isotherm), the pressure rises. Consider the (blue) isotherm of 10 °C, which is below the critical temperature. Decrease the volume until we reach the point \(B\), where condensation (formation of liquid CO2) starts. At this point the van der Waals curve is no longer physical (excluding the possibility of the occurrence of an oversaturated, metastable gas) because \(P\) and \(V\) increase together. It should be clear that many approximations and assumptions go into the derivation of the van der Waals equation so that some of the important physics is missing from the model. Hence, we should not be surprised if the van der Waals equation has some unphysical behavior buried in it. In reality, the pressure stays constant between the region \(A\) and \(B\) and the real physical behavior is given by the dashed blue line, called the tie line. This lines represents the gas-liquid coexistence and the pressure is equal to the vapor pressure of the liquid.

The tie line must be added in ad hoc by drawing a horizontal line through the isotherm (Figure 16.3.2 ). The vertical position of the line is chosen so that the area above the line (between the line and the isotherm) and below the line (again between the line and the isotherm) is exactly the same. This is known as Maxwell's construction. In this way, we entirely remove the artifact of the unphysical increase of \(P\) with \(V\) when we compute the compressional work on the gas from \(\int P(V) \: dV\), to be discussed in our section on thermodynamics. Although the van der Waals curves have regions where they are not physical, the equation for these curves, derived by van der Waals in 1873, was a great scientific achievement.
Even today it is not possible to give a single equation that describes correctly the gas-liquid phase transition.
Critical Point
Looking to the left of point \(A\) on the 10 °C isotherm (blue curve), the system is in the liquid state. Increasing the volume to point \(A\) leads to a rapid drop in the pressure of the system because the compressibility of a liquid is considerable smaller than that of a gas. The system is still in the liquid state at point \(A\), but as we increase the volume further, we enter the gas-liquid coexistence line and the liquid begins to transition to gas. As we move along this line to the right, there is less liquid and more gas in the system until we reach point \(B\), at which point the system will be completely in the gas phase. The areas, bounded by the 10 °C isotherm (blue curve) below and above the coexistence line are equal. Any further increase in the volume will lead to an expansion of the gas.There is exactly one isotherm along which the van der Waals equation correctly predicts the gas-to-liquid phase transition. If one follows the 31 °C isotherm (green curve in Figure 16.3.2 ) of critical temperature, the volume discontinuity captured by the tie line is shrunken down to a single point (so that there is no possibility of an increase of \(P\) with \(V\)!). This point is called the critical point and it exists at only one temperature, called the critical temperature, denoted \(T_c\). The critical isotherm at the critical temperature corresponds to the highest possible temperature at which a gas-liquid transition can occur. Isotherms at higher temperatures have no liquid-gas phase transitions. Along those isotherms, the higher pressure fluid, called a supercritical fluid, resembles a liquid, while at lower pressures the fluid is more gas-like.
The critical point exists at an inflection where the first and second derivatives of \(P\) with respect to \(V\) are zero:
\[\left(\frac{\partial P}{\partial V}\right)_{T_c} = 0 \nonumber \]
\[\left(\frac{\partial^2 P}{\partial V^2}\right)_{T_c} = 0 \nonumber \]
Substituting the van der Waals equation into these two conditions, we find the following:
\[\begin{align*} -\dfrac{nRT_c}{\left( V_c - nb \right)^2} + \dfrac{2 an^2}{V_c^3} &= 0 \\ \dfrac{2nRT_c}{\left(V_c - nb \right)^3} - \dfrac{6an^2}{V_c^4} &= 0 \end{align*} \]
Hence, we have two equations in two unknowns \(V_c\) and \(T_c\) for the critical temperature and critical volume. Once these are determined, the van der Waals equation, itself, allows us to determine the critical pressure, \(P_c\). To solve the equations, first divide one by the other. This gives us a simple condition for the volume:
\[\begin{align*} \dfrac{V_c - nb}{2} &= \dfrac{V_c}{3} \\ 3V_c - 3nb &= 2V_c \\ V_c &= 3nb \end{align*} \]
This is the critical volume. Now use either of the two conditions to obtain the critical temperature, \(T_c\). If we use the first one, we find:
\[\begin{align*} \dfrac{nRT_c}{\left( V_c - nb \right)^2} &= \dfrac{2an^2}{V_c^3} \\ \dfrac{nRT_c}{\left( 3nb - nb \right)^2} &= \dfrac{2an^2}{\left( 3nb \right)^3} \\ \dfrac{nRT_c}{4n^2b^2} &= \dfrac{2an^2}{27n^3b^3} \\ RT_c &= \dfrac{8a}{27b} \end{align*} \]
Finally, plugging the critical temperature and volume into the van der Waals equation, we obtain the critical pressure:
\[\begin{align*} P_c &= \dfrac{nRT_c}{V_c - nb} - \dfrac{an^2}{V_c^2} \\ &= \dfrac{8an/27b}{3nb - nb} - \dfrac{an^2}{\left( 3nb \right)^2} \\ &= \dfrac{a}{27b^2} \end{align*} \]
It comes as no surprise that cubic equations of state like the van der Waals (and Redlich-Kwong) equations of state yield three different roots for volume and compressibility factor. This is simply because they are algebraic equations, and any nth order algebraic equation will always yield “n” roots. However, those “n” roots are not required to be distinct, and that is not all: they are not required be real numbers, either. A quadratic expression (n = 2) may have zero real roots (e.g., \(x^2 + 1 = 0\)); this is because those roots are complex numbers. In the case of cubic expressions (n = 3), we will either have one or three real roots; this is because complex roots always show up in pairs (i.e., once you have a complex root, its conjugate must also be a solution). In our case, and because we are dealing with physical quantities (densities, volumes, compressibility factors), only real roots are of interest. More specifically, we look for real, positive roots such that \(\bar{V} > b\) in the case of molar volume and \( Z > \frac{Pb}{RT}\) in the case of compressibility factor.
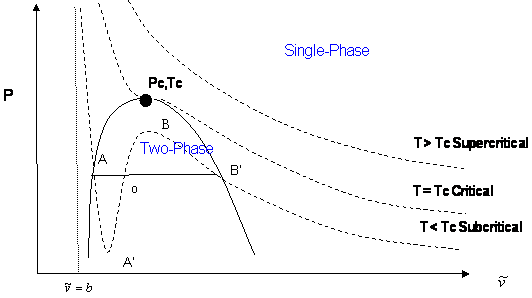
In a cubic equation of state, the possibility of three real roots is restricted to the case of sub-critical conditions (\(T < T_c\)), because the S-shaped behavior, which represents the vapor-liquid transition, takes place only at temperatures below critical. This restriction is mathematically imposed by the criticality conditions. Anywhere else, beyond the S-shaped curve, we will only get one real root of the type \(\bar{V} > b\). Figure 16.3.3 illustrates this point.

The shape of the critical isotherm at the critical point allows us to determine the exact temperature, pressure, and volume at which the phase transitions from gas to liquid will occur. If we draw a curve through the isotherms joining all points of these isotherms at which the tie lines begin, continue the curve up to the critical isotherm, and down the other side where the tie lines end, this curve reaches a maximum at the critical point. The region inside this curve is when the gas and liquid phases coexist.
Let us summarize the three cases presented in Figure 16.3.3 :
- Supercritical isotherms (\(T > T_c\): At temperatures beyond critical, the cubic equation will have only one real root (the other two are imaginary complex conjugates). In this case, there is no ambiguity in the assignment of the volume root since we have single-phase conditions. The occurrence of a unique real root remains valid at any pressure: any horizontal (isobaric) line cuts the supercritical isotherm just once in Figure 16.3.3 .
- Critical isotherm (\(T = T_c\)): At the critical point (\(P = P_c\)), vapor and liquid properties are the same. Consequently, the cubic equation predicts three real and equal roots at this special and particular point. However, for any other pressure along the critical isotherm (\(P < P_c\) or \(P > P_c\),) the cubic equation gives a unique real root with two complex conjugates.
- Subcritical isotherm (\(T < T_c\)): Predictions for pressures within the pressure range for metastability (\(P_A’ < P < P_B’\)) or for the saturation condition (\(P = P^{sat}\)) will always yield three real, different roots. In fact, this is the only region where an isobar cuts the same isotherm more than once. The smallest root is taken as the specific volume of the liquid phase; the largest is the specific volume of the vapor phase; the intermediate root is not computed as it is physically meaningless. However, do not get carried away. Subcritical conditions will not always yield three real roots of the type \(\bar{\nu} > b\). If the pressure is higher than the maximum of the S-shaped curve, \(P_B\), we will only have one (liquid) real root that satisfies \(\bar{\nu} > b\). By the same token, pressures between \(0 < P < P_A’\) yield only one (vapor) root. In the case of \(P_A’\) being a negative number, three real roots are to be found even for very low pressures when the ideal gas law applies. The largest root is always the correct choice for the gas phase molar volume of pure components.
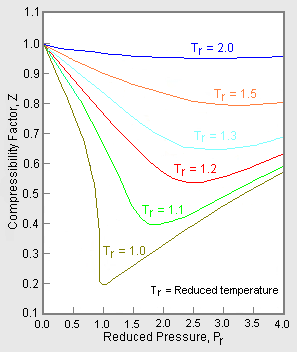
Most of these considerations apply to the cubic equation of state in \(Z\) (compressibility factor). The most common graphical representation of compressibility factor is the well-known chart of Standing and Katz, where compressibility, \(Z\), is plotted against pressure (Figure 16.3.4 ). Standing and Katz presented their chart for the compressibility factor of sweet natural gases in 1942. This chart was based on experimental data. Graphical determination of properties was widespread until the advent of computers, and thus the Standing and Katz Z-chart became very popular in the natural gas industry. Typical Standing and Katz charts are given for high temperature conditions (\(T > T_c\) or \(T_r > 1\)).


