
3.2B: Spectroscopy Lab
- Page ID
- 349173

\( \newcommand{\vecs}[1]{\overset { \scriptstyle \rightharpoonup} {\mathbf{#1}} } \)
\( \newcommand{\vecd}[1]{\overset{-\!-\!\rightharpoonup}{\vphantom{a}\smash {#1}}} \)
\( \newcommand{\id}{\mathrm{id}}\) \( \newcommand{\Span}{\mathrm{span}}\)
( \newcommand{\kernel}{\mathrm{null}\,}\) \( \newcommand{\range}{\mathrm{range}\,}\)
\( \newcommand{\RealPart}{\mathrm{Re}}\) \( \newcommand{\ImaginaryPart}{\mathrm{Im}}\)
\( \newcommand{\Argument}{\mathrm{Arg}}\) \( \newcommand{\norm}[1]{\| #1 \|}\)
\( \newcommand{\inner}[2]{\langle #1, #2 \rangle}\)
\( \newcommand{\Span}{\mathrm{span}}\)
\( \newcommand{\id}{\mathrm{id}}\)
\( \newcommand{\Span}{\mathrm{span}}\)
\( \newcommand{\kernel}{\mathrm{null}\,}\)
\( \newcommand{\range}{\mathrm{range}\,}\)
\( \newcommand{\RealPart}{\mathrm{Re}}\)
\( \newcommand{\ImaginaryPart}{\mathrm{Im}}\)
\( \newcommand{\Argument}{\mathrm{Arg}}\)
\( \newcommand{\norm}[1]{\| #1 \|}\)
\( \newcommand{\inner}[2]{\langle #1, #2 \rangle}\)
\( \newcommand{\Span}{\mathrm{span}}\) \( \newcommand{\AA}{\unicode[.8,0]{x212B}}\)
\( \newcommand{\vectorA}[1]{\vec{#1}} % arrow\)
\( \newcommand{\vectorAt}[1]{\vec{\text{#1}}} % arrow\)
\( \newcommand{\vectorB}[1]{\overset { \scriptstyle \rightharpoonup} {\mathbf{#1}} } \)
\( \newcommand{\vectorC}[1]{\textbf{#1}} \)
\( \newcommand{\vectorD}[1]{\overrightarrow{#1}} \)
\( \newcommand{\vectorDt}[1]{\overrightarrow{\text{#1}}} \)
\( \newcommand{\vectE}[1]{\overset{-\!-\!\rightharpoonup}{\vphantom{a}\smash{\mathbf {#1}}}} \)
\( \newcommand{\vecs}[1]{\overset { \scriptstyle \rightharpoonup} {\mathbf{#1}} } \)
\( \newcommand{\vecd}[1]{\overset{-\!-\!\rightharpoonup}{\vphantom{a}\smash {#1}}} \)
\(\newcommand{\avec}{\mathbf a}\) \(\newcommand{\bvec}{\mathbf b}\) \(\newcommand{\cvec}{\mathbf c}\) \(\newcommand{\dvec}{\mathbf d}\) \(\newcommand{\dtil}{\widetilde{\mathbf d}}\) \(\newcommand{\evec}{\mathbf e}\) \(\newcommand{\fvec}{\mathbf f}\) \(\newcommand{\nvec}{\mathbf n}\) \(\newcommand{\pvec}{\mathbf p}\) \(\newcommand{\qvec}{\mathbf q}\) \(\newcommand{\svec}{\mathbf s}\) \(\newcommand{\tvec}{\mathbf t}\) \(\newcommand{\uvec}{\mathbf u}\) \(\newcommand{\vvec}{\mathbf v}\) \(\newcommand{\wvec}{\mathbf w}\) \(\newcommand{\xvec}{\mathbf x}\) \(\newcommand{\yvec}{\mathbf y}\) \(\newcommand{\zvec}{\mathbf z}\) \(\newcommand{\rvec}{\mathbf r}\) \(\newcommand{\mvec}{\mathbf m}\) \(\newcommand{\zerovec}{\mathbf 0}\) \(\newcommand{\onevec}{\mathbf 1}\) \(\newcommand{\real}{\mathbb R}\) \(\newcommand{\twovec}[2]{\left[\begin{array}{r}#1 \\ #2 \end{array}\right]}\) \(\newcommand{\ctwovec}[2]{\left[\begin{array}{c}#1 \\ #2 \end{array}\right]}\) \(\newcommand{\threevec}[3]{\left[\begin{array}{r}#1 \\ #2 \\ #3 \end{array}\right]}\) \(\newcommand{\cthreevec}[3]{\left[\begin{array}{c}#1 \\ #2 \\ #3 \end{array}\right]}\) \(\newcommand{\fourvec}[4]{\left[\begin{array}{r}#1 \\ #2 \\ #3 \\ #4 \end{array}\right]}\) \(\newcommand{\cfourvec}[4]{\left[\begin{array}{c}#1 \\ #2 \\ #3 \\ #4 \end{array}\right]}\) \(\newcommand{\fivevec}[5]{\left[\begin{array}{r}#1 \\ #2 \\ #3 \\ #4 \\ #5 \\ \end{array}\right]}\) \(\newcommand{\cfivevec}[5]{\left[\begin{array}{c}#1 \\ #2 \\ #3 \\ #4 \\ #5 \\ \end{array}\right]}\) \(\newcommand{\mattwo}[4]{\left[\begin{array}{rr}#1 \amp #2 \\ #3 \amp #4 \\ \end{array}\right]}\) \(\newcommand{\laspan}[1]{\text{Span}\{#1\}}\) \(\newcommand{\bcal}{\cal B}\) \(\newcommand{\ccal}{\cal C}\) \(\newcommand{\scal}{\cal S}\) \(\newcommand{\wcal}{\cal W}\) \(\newcommand{\ecal}{\cal E}\) \(\newcommand{\coords}[2]{\left\{#1\right\}_{#2}}\) \(\newcommand{\gray}[1]{\color{gray}{#1}}\) \(\newcommand{\lgray}[1]{\color{lightgray}{#1}}\) \(\newcommand{\rank}{\operatorname{rank}}\) \(\newcommand{\row}{\text{Row}}\) \(\newcommand{\col}{\text{Col}}\) \(\renewcommand{\row}{\text{Row}}\) \(\newcommand{\nul}{\text{Nul}}\) \(\newcommand{\var}{\text{Var}}\) \(\newcommand{\corr}{\text{corr}}\) \(\newcommand{\len}[1]{\left|#1\right|}\) \(\newcommand{\bbar}{\overline{\bvec}}\) \(\newcommand{\bhat}{\widehat{\bvec}}\) \(\newcommand{\bperp}{\bvec^\perp}\) \(\newcommand{\xhat}{\widehat{\xvec}}\) \(\newcommand{\vhat}{\widehat{\vvec}}\) \(\newcommand{\uhat}{\widehat{\uvec}}\) \(\newcommand{\what}{\widehat{\wvec}}\) \(\newcommand{\Sighat}{\widehat{\Sigma}}\) \(\newcommand{\lt}{<}\) \(\newcommand{\gt}{>}\) \(\newcommand{\amp}{&}\) \(\definecolor{fillinmathshade}{gray}{0.9}\)Learning Objectives
Goals:
- Calculate the concentration of a dilute aqueous solute using absorbance spectroscopy.
- Learn how to properly use a pipet
- Learn how to properly use a volumetric flask
By the end of this lab, students should be able to:
- Properly use an analytical balance to measure mass.
- Create a standard Beer's Law plot and use it to calculate the concentration of an unknown..
Prior knowledge:
Additional Resources
- Use of Analytical Balance (section 0.1.2)
- Use of Pipettes (section 0.1.3)
- Absorbance Spectroscopy (section 0.4.3)
- SpectroVis (section 0.4.3.5)
- User Manual (Vernier download)
- SpectroVis (section 0.4.3.5)
- LoggerPro Software (section 0.4.5)
Safety
- Emergency Preparedness
- Eye protection is mandatory in this lab, and you should not wear shorts or open toed shoes.
- CuSO4 PubChem LCSS
- Minimize Risk
- Wear Googles.
- If you use a laptop
- Do not let it be near chemicals
- Due to COVID 19, only the owner of the laptop should touch the keyboard.
- Recognize Hazards
- All waste is placed in the labeled container in the hood and will be recycled when the lab is over. Contact your instructor if the waste container is full, or about full.
Equipment and materials needed
| VIS Spectrophotometer | 6 cuvettes | LabQuest or Laptop w/LoggerPro |
| CuSO4.5H2O(s) | 50 mL beaker | 2 unknown CuSO4 (aq) solutions |
| 50 ml Volumetric Flask | 25 mL pipette |
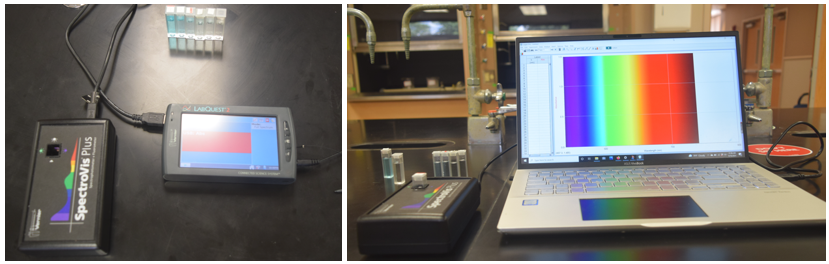
Figure \(\PageIndex{1}\): Vernier SpectroVis hooked up to a LabQuest (left) and laptop running LoggerPro (right). (Copyright; Poirot/Lisitsyna CC0)
Background
This experiment will introduce you to the use of spectrometers, and techniques for using them. Instructions for use of the spectrometer can be found in the instrumentation section of this lab manual. In this labs you will make two types of plots, an absorbance spectrum and a Beer's law plot. The former can be used for qualitative analysis and help identify the identity of an unknown, and the former can be used for quantitative analysis, and identify the concentration of an unknown.
Absorbance Spectroscopy
When UV and visible light interact with a molecules electrons absorb the energy of a photon (H\(\nu\)) jump from low energy states to high energy states where the energy gap between the orbitals is equal to the energy of light. So light of a specific frequency is absorbed
the absence of photochemical reactions spectroscopic analysis does not alter the identity of a compound during the measurement process, and the can be used to both identify unknown compounds (qualitative analysis) and determine solute concentrations (quantitative analysis). Just as line spectra could be used to identify isolated atoms (section 6.3) in gen chem 1, the spectrum of a molecule is like a fingerprint (figure \(\PageIndex{2}\)a), as light can only be absorbed if its energy (h\(\nu\) is equal to the energy gap between an occupied molecular orbital and an unoccupied higher energy orbital. So the spectra can be used to identify a molecule. For light of a specific frequency to be absorbed it must come into contact with a molecule that absorbs light of that frequency, and so the greater the concentration of the molecules in a solution the more the light is absorbed (a dilute solution absorbs less than a concentrated one), and so we can also use spectroscopy to determine the concentration of an unknown by comparing it to a known (figure \(\PageIndex{2}\)b).
There are two parts to this experiment.
-
Spectra – plot of absorbance (A) as a function of wavelength \(\lambda\) (left image in figure \(\PageIndex{2}\). Do not use a mathematical fit in making a spectra but connect the points with a smooth fit.
-
Beer’s Law Plot – plot of absorbance (A) as a function of solute concentration (c). Make all measurements at the same wavelength and do a linear fit forcing the line through the origin.
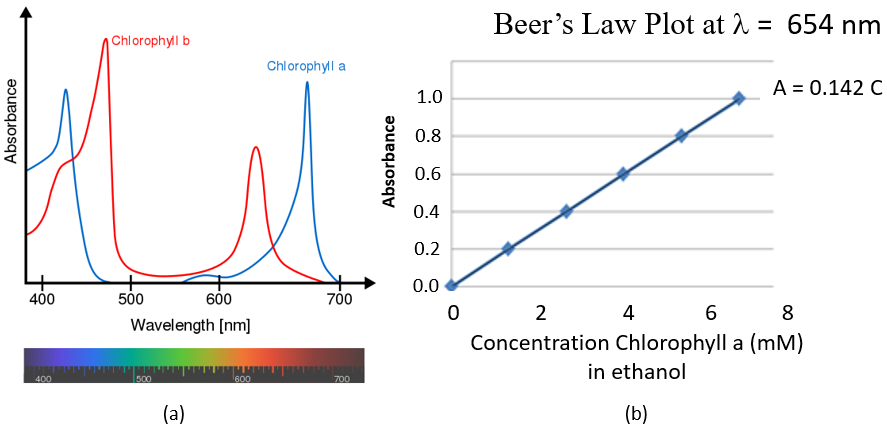 Figure \(\PageIndex{2}\): (a) Vis spectra of chlorophyll (Wikimedia Commons) and (b) Beer's Law plot of the absorbance of 654nm light as a function of the concentration of chlorophyl in ethanol (CC-BY: Belford)
IMPORTANT
Before Proceeding Read Section 0.4.3: Absorbance Spectroscopy of the General Information section of this LibreTexts. In this lab you are responsible for the material in that section. Your prelab questions, postlab quiz and lab activity require you to be familiar with that material. The instructions for running the spectrometer are in this section.
Experimental Design Considerations
Before proceeding read 0.4.3: Absorbance spectroscopy.
In a Beer's Law plot you make a plot the absorbance (A) as a function of the concentration, and then use that plot to determine the concentration of an unknown. The easiest way to do this is make a standard solution of known concentration, and then dilute that solution several times to make a series of solutions of known concentration that you can then measure the absorbance of.
Stock Solution
Competency \(\PageIndex{1}\): Standard Solution
In this experiment we are going to make 0.200M CuSO4(aq) from CUSO4\(\cdot\)5H2O. What is the name of the reagent, and what is its molar mass?
- Answer
-
Copper Sulfate pentahydrate, you include the water of hydration in its molar mass calculation and so it is 249.68 g/mol.
Competency \(\PageIndex{2}\): Standard Solution
How many grams copper sulfate pentahydrate would be required to dilute to volume in a 50 mL volumetric flask to make 0.200 M CuSO4(aq) solution?
- Answer
-
\[0.200 \frac{mol CuSO_4}{l}\left ( \frac{249.68g}{mol} \right )0.0500l= 2.4968g \nonumber\]
Competency \(\PageIndex{3}\): Standard Solution
Report to the correct number of significant digits the concentration of a solution made when a student weighed 2.4793 g Copper sulfate pentahydrate, transferred it to a 50 mL volumetric flask and diluted to volume
- Answer
-
\[\frac{2.4793g CuSO_4 \cdot pentahydrate}{0.05000L}\left ( \frac{mol}{249.68g} \right )= 0.1986M \nonumber\] Note, from section 0.1.2.3, a 50 mL volumetric flask has a precision of +/- 0.05mL and so we report it as 50.00 mL or 0.05000L.
Dilute Solutions
There are two approaches to making dilute solutions, to make multiple solutions or to successively dilute one solution. We will first look at making three multiple solutions from a single solution.
Competency\(\PageIndex{4}\): Dilutions
What are the final concentrations if a student uses a 5, 10 and 25 mL pipette to transfer a 2.000M stock solution of KMnO4(aq) to a 100 mL volumetric flask and dilutes to volume.
 Figure \(\PageIndex{3}\): Making 3 dilute solutions from one stock solutions. (Bob Belford CC0)
- Answer
-
Using the dilution equation (section 4.4.3) \[m_iV_i=M_fV_f \\ M_f=M_i\left ( \frac{V_i}{V_f} \right ) \nonumber\]
gives final concentrations of 0.100M, 0.2000M and 0.5000M for using 5ml, 10ml and 25 ml pipettes. Note the 5 mL pipette only has three sig figs (section 0.1.2.2)
Consideration \(\PageIndex{5}\): Dilutions
The above problem required you to use three different pipets and three different volumetric flasks. How could you make three dilutions using only one pipette and one volumetric flask? (The answer has a video that should be watched before doing the lab)
- Answer
-
The method of successive (serial) dilutions
Consideration \(\PageIndex{6}\): Dilutions
There was a mistake in the video of the answer to consideration \(\PageIndex{5}\) (above)? Although it is a very good animation, what was conceptual wrong with the animation?
- Answer
-
They were treating volumes as additive. That is 1 ml + 9 ml = 10ml. In reality, if two substances have stronger attractive forces for each other than for themselves, there is a contraction in the volume upon mixing. That is why you dilute to volume. What they should have done was transfer 1 mL of the stock solution to a 10 mL volumetric flask, and then diluted to volume. Of course the YouTube did a good job of showing the dilution factor, but solutions are not always additive upon mixing, and so we dilute to volume. (One plus nine may not equal 10, if you are describing the mixing of volumes of different substances.)
Beer's Law
Consideration \(\PageIndex{7}\): Beer's Law
At a given wavelength a student has a linear Beer's Law plot over the absorbance range of 0.05 to 1.0 and measures an unknown with an absorbance of 2.2. Think of three things the student can do. (Hint for answer 1-think of what you can do with a spectrometer. Hint for answers 2&3- think of Beer's Law and what you can change).
- Answer 1
-
Take a spectrum and see if there in another wavelength where the absorbance is in the range you can trust the instrument with.
- Answer 2
-
Look at Beer's Law A=\(\epsilon\)bC, the student could dilute the unknown until the Absorbance is within the range for which they trust the spectrometer. A good dilution factor is 10, as then you only move the decimal position for each dilutions. So if they took 10 ml of the unknown and diluted to to 100 ml in a volumetric flask, the solution would be 10th the concentration of the original. If it still had an absorbance greater than 1.0, they could dilute the diluted solution by a factor of 10, that is perform a serial dilutions, so it is now 1/100th the original. If they had to repeat the process 4 times, the could then read the concentration off the Beer's Law plot, and their unknown would be 10,000 times more concentrated.
This is one of the advantages of spectroscopy, as the extinction coefficient is often a very large number, meaning you can measure the concentration of dilute solutions, and any unknown can easily be diluted, by simply adding solvent.
- Answer 3
-
Look at Beer's Law A=\(\epsilon\)bC, the student could try a cuvette with a shorter path length (b). This is not always practical, but cuvettes do come in a variety of path lengths (you would typically use a small pathlength if the solute you are measuring is very expensive, as it allows you to test a smaller sample.
Consideration \(\PageIndex{8}\): Beer's Law
At a given wavelength a student has a linear Beer's Law plot over the absorbance range of 0.05 to 1.0 and measures an unknown with an absorbance of 0.02 at that wavelength. What could you do? (Hint for answer 1-think of what you can do with a spectrometer. Hint for answer 2- think of Beer's Law and what you can change).
- Answer 1
-
The solution is too dilute, they could take a spectra and see if there is a wavelength where the absorbance is greater.
- Answer 2
-
You do not really have the option of making it more concentrated, short of evaporating the solvent. You could try and use a spectrometer with a longer pathlength, although that may not be a realistic option.
Consideratgion \(\PageIndex{9}\): Beer's Law & Serial Dilutions
At \(\lambda\)=625 and \(\epsilon\)=42,300 M-1cm-1. Using a cuvette with a 1.00 cm pathlength, a student mesaured the Absorbance of an unknown and it was above 2.2, so using a 10 mL pipette and a 100 mL volumetric flask they did two serial dilutions. In the first dilution they diluted 10 mL of the unknown to 100 mL and the absorbance was 1.4. They further diluted 10 mL of the diluted solution to 100 mL and the absorbance dropped to 0.94. What is the concentration of the unknown?
- Answer
-
The diluted solution had a concentration of 22.2mM
\[A=\epsilon bc \;\; \therefore \;\; c=\frac{A}{\epsilon b} \\ c=\frac{0.94}{42,300M^{-1}cm^{-1}\left ( 1.00cm \right )}=22.2\mu M \nonumber\], so the original solution was 100 times more concentrated, or 2.22mM
Experimental Procedures
There are four parts to this experiment. First you will use the technique of serial dilutions to make a total of 5 solutions (stock plus 4 diluted solutions). Then you will take a spectrum of your stock and choose a wavelength for your Beer's Law plot. You will then record the absorbance of all 5 solutions and make a Beer's law plot that has 6 data points (when you calibrated the instrument you set A=0 for the pure solvent, the point 0,0 is a value on your graph). You will then measure the concentration of 2 unknowns and report their concentration in your lab report.
Serial Dilutions
- Make a stock solution of CuSO4(aq) with a concentration around 0.2M - record everything to the correct number of sig figs based on your equipment
- Calculate approximate mass of CuSO4.5H2O to make 50 mL of 0.2M CuSO4(aq).
- Weigh around that mass, quantitatively transfer to 50 mL volumetric flask, record exact mass in workbook
- Dilute to volume, this is your standard solution (remember to swirl and dissolve the solid while the flask is about 2/3rds to the mark)
- Fill cuvette 3/4ths full with standard solution and label cap with number 1
- Transfer remaining standard solution to clean and dry 100 ml beaker
- Clean the 50 mL volumetric flask with DI (DeIonized) water, you do not need to dry
- Using 25 mL pipette transfer 25 mL stock solution from the 100 mL beaker to the 50 mL volumetric flask. Do not blow out the last bit of solution.
- If the pipet is wet you should blow it out with a bulb before transferring 25 mL (do this over a waste container). If there is still some solution in it you you should suck in a small amount of the solution you transfer and wet the sides with that solution so that any fluid adhering to the walls is the solution you are transferring.
- Dilute the solution in the 50 mL volumetric flask to volume with water and this will become the second solution of your serial dilution
- Discard the remaining solution in the 100 mL beaker to a 600 mL waste container (be sure you placed some in the cuvette labeled 1)
- be sure you placed some of this solution in a cuvette and labeled it.
- Wash and dry beaker, you will reuse it
- Pour the solution in the 50 mL volumetric flask (step 6) into the dry 100 mL beaker and repeat steps 2-7 using a new cuvette and labeling each cuvette 2,3,4,5 for each of the successive half dilutions.
Obtain Spectrum
- Calibrate the spectrometer
- Warm spectrometer for 5 minutes
- Fill cuvette 3/4ths full of solvent (water), cap and label the cap 0 (zero)
- Place in cuvette in the cavity so the light path goes through the clear side
- From Experiment menu choose Spectrophotometer/calibrate
- Follow the instructions until the calibration is OK.
- Keep this "blank" solution in the cuvette until the experiment is over, as you may need to recalibrate the spectrometer
- Generate a spectrum
- After calibrating spectrometer place stock solution (cuvette #1) into cuvette cavity
- Click <Collect> and once the spectrum is displayed click <Stop>
- To store spectrum go to the experiment menu and choose "Store Latest Run"
- Save as csv to a flashdrive
- Choose a wavelength for Beer's Law plot where A=1 for the stock solution, write this down in your data sheet
Generate Beer's Law plot
- Calibrate the spectrometer if needed (you can read the absorbance of the blank (solvent), if it is zero at the wavelength you are measureing you do not need to recalibrate.
- Place each cuvette into the spectrometer and read the absorbance at the chosen wavelength (where A=1 for stock).
- Record values in data sheet
- You should have 6 values (5 for each of the solutions, and the blank, which should read 0)
- Each solutions absorbance should be around 1/2 of the value of the previous one that was diluted in half to make it
Measure absorbance of unknowns
- Measure the absorbance of 2 unknowns at the chosen wavelength
- Record values in data sheet
Data Analysis
Cover page tab
The first page is always the cover page.
 Figure \(\PageIndex{4}\): Cover page for lab report. (Copyright; Belford CC0)
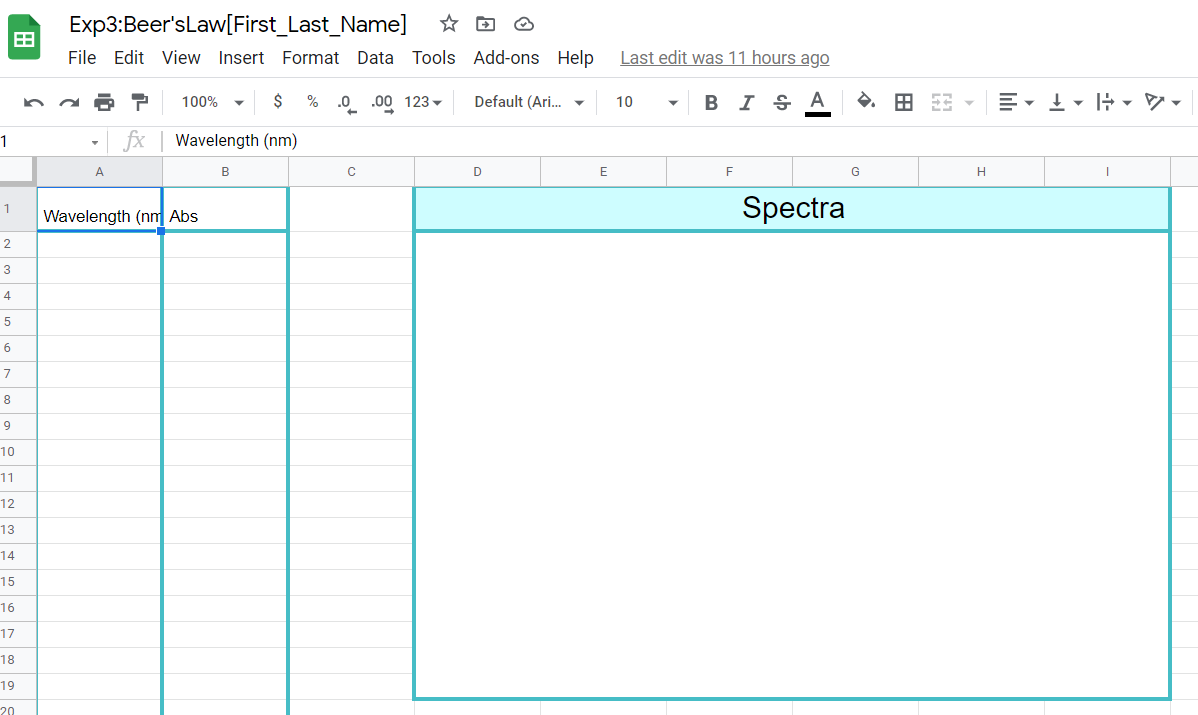
Spectra tab
The second tab will contain your spectra. Open the CSV (comma separated variable) text file of the spectrum that you saved to a flash drive on the labquest, and then copy and past the raw data into columns A & B of the second tab (keep the titles, so start on the second row). Use "smooth line chart"
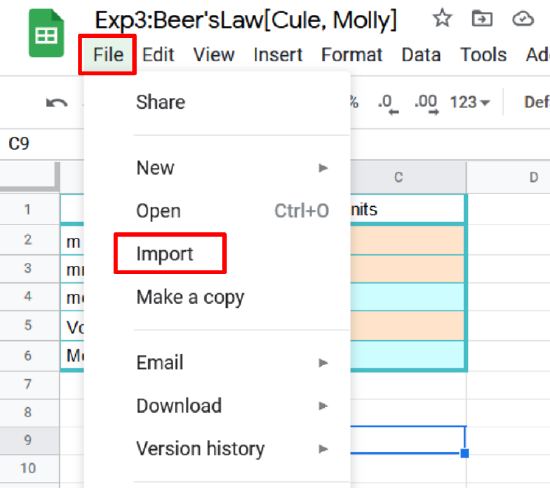
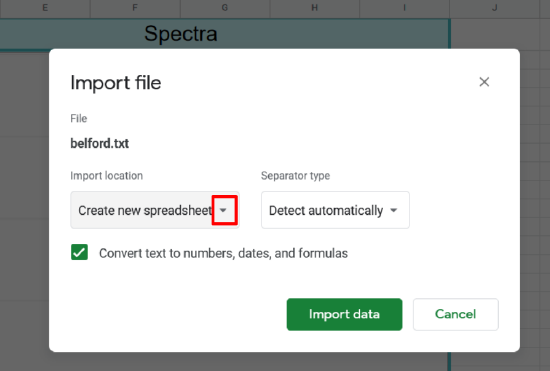
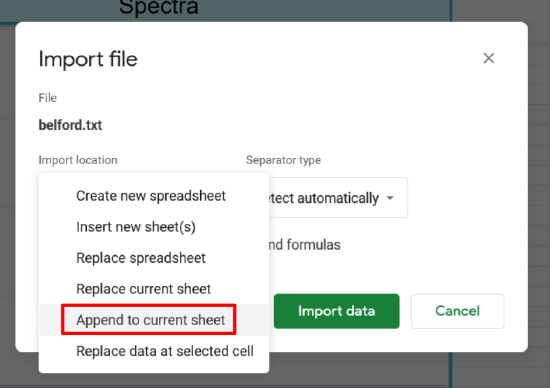
Importing Spectra csv
- On your google sheet open the spectra tab and click on cell 1A
- Click File>import
- Click upload and select the file you want to upload
- Click the drop down for import location
- Select Append to current sheet
- Then click import data
Making Spectra Chart
- Highlight columns A and B by clicking and dragging on column labels (where it says A and B) or click A then shift+click B. This should highlight the entire column
- (there is a lot of data and trying to scroll through the entire sheet will take a long time)
- Click Insert>Chart
- Open chart editor by clicking the three dots in the top right corner of the chart
- Check that your chart type is a smooth line chart
- Check your data range (google should ignore the Veneir information and skip to where your data starts)
- Make sure your chart has a Title, Axes labels for x and y axis, and units.
Dilution tab
In this tab you will calculate the concentration of the stock solution each dilution
 Figure \(\PageIndex{6}\): Data sheet for calculating solution concentrations. (Copyright; Belford CC0)
Beer's Law tab
Transfer the data from your data sheet to the brown cells and perform appropriate calculations in the blue cells. Do not rearrange these cells as they are connected to your instructor's workbook. If needed you can download a new template, but then must resubmit its URL through the google form and alert you instructor (as there will be two spreadsheets with your name).
If needed you can also make another tab and name it "scratch" to do other work, However only answers in the boxes on the template pages will be graded.
 Figure \(\PageIndex{7}\):Beer's Law worksheet. (Copyright; Belford CC0)