
2.5: Measured Numbers and Significant Digits
- Page ID
- 267151

\( \newcommand{\vecs}[1]{\overset { \scriptstyle \rightharpoonup} {\mathbf{#1}} } \)
\( \newcommand{\vecd}[1]{\overset{-\!-\!\rightharpoonup}{\vphantom{a}\smash {#1}}} \)
\( \newcommand{\id}{\mathrm{id}}\) \( \newcommand{\Span}{\mathrm{span}}\)
( \newcommand{\kernel}{\mathrm{null}\,}\) \( \newcommand{\range}{\mathrm{range}\,}\)
\( \newcommand{\RealPart}{\mathrm{Re}}\) \( \newcommand{\ImaginaryPart}{\mathrm{Im}}\)
\( \newcommand{\Argument}{\mathrm{Arg}}\) \( \newcommand{\norm}[1]{\| #1 \|}\)
\( \newcommand{\inner}[2]{\langle #1, #2 \rangle}\)
\( \newcommand{\Span}{\mathrm{span}}\)
\( \newcommand{\id}{\mathrm{id}}\)
\( \newcommand{\Span}{\mathrm{span}}\)
\( \newcommand{\kernel}{\mathrm{null}\,}\)
\( \newcommand{\range}{\mathrm{range}\,}\)
\( \newcommand{\RealPart}{\mathrm{Re}}\)
\( \newcommand{\ImaginaryPart}{\mathrm{Im}}\)
\( \newcommand{\Argument}{\mathrm{Arg}}\)
\( \newcommand{\norm}[1]{\| #1 \|}\)
\( \newcommand{\inner}[2]{\langle #1, #2 \rangle}\)
\( \newcommand{\Span}{\mathrm{span}}\) \( \newcommand{\AA}{\unicode[.8,0]{x212B}}\)
\( \newcommand{\vectorA}[1]{\vec{#1}} % arrow\)
\( \newcommand{\vectorAt}[1]{\vec{\text{#1}}} % arrow\)
\( \newcommand{\vectorB}[1]{\overset { \scriptstyle \rightharpoonup} {\mathbf{#1}} } \)
\( \newcommand{\vectorC}[1]{\textbf{#1}} \)
\( \newcommand{\vectorD}[1]{\overrightarrow{#1}} \)
\(\newcommand{\ket}[1]{\left| #1 \right>} \)
\( \newcommand{\bra}[1]{\left< #1 \right|} \)
\( \newcommand{\braket}[2]{\left< #1 \vphantom{#2} \right| \left. #2 \vphantom{#1} \right>} \)
\( \newcommand{\qmvec}[1]{\mathbf{\vec{#1}}} \)
\( \newcommand{\op}[1]{\hat{\mathbf{#1}}}\)
\( \newcommand{\expect}[1]{\langle #1 \rangle}\)
\( \newcommand{\vectorDt}[1]{\overrightarrow{\text{#1}}} \)
\( \newcommand{\vectE}[1]{\overset{-\!-\!\rightharpoonup}{\vphantom{a}\smash{\mathbf {#1}}}} \)
\( \newcommand{\vecs}[1]{\overset { \scriptstyle \rightharpoonup} {\mathbf{#1}} } \)
\( \newcommand{\vecd}[1]{\overset{-\!-\!\rightharpoonup}{\vphantom{a}\smash {#1}}} \)
\(\newcommand{\avec}{\mathbf a}\) \(\newcommand{\bvec}{\mathbf b}\) \(\newcommand{\cvec}{\mathbf c}\) \(\newcommand{\dvec}{\mathbf d}\) \(\newcommand{\dtil}{\widetilde{\mathbf d}}\) \(\newcommand{\evec}{\mathbf e}\) \(\newcommand{\fvec}{\mathbf f}\) \(\newcommand{\nvec}{\mathbf n}\) \(\newcommand{\pvec}{\mathbf p}\) \(\newcommand{\qvec}{\mathbf q}\) \(\newcommand{\svec}{\mathbf s}\) \(\newcommand{\tvec}{\mathbf t}\) \(\newcommand{\uvec}{\mathbf u}\) \(\newcommand{\vvec}{\mathbf v}\) \(\newcommand{\wvec}{\mathbf w}\) \(\newcommand{\xvec}{\mathbf x}\) \(\newcommand{\yvec}{\mathbf y}\) \(\newcommand{\zvec}{\mathbf z}\) \(\newcommand{\rvec}{\mathbf r}\) \(\newcommand{\mvec}{\mathbf m}\) \(\newcommand{\zerovec}{\mathbf 0}\) \(\newcommand{\onevec}{\mathbf 1}\) \(\newcommand{\real}{\mathbb R}\) \(\newcommand{\twovec}[2]{\left[\begin{array}{r}#1 \\ #2 \end{array}\right]}\) \(\newcommand{\ctwovec}[2]{\left[\begin{array}{c}#1 \\ #2 \end{array}\right]}\) \(\newcommand{\threevec}[3]{\left[\begin{array}{r}#1 \\ #2 \\ #3 \end{array}\right]}\) \(\newcommand{\cthreevec}[3]{\left[\begin{array}{c}#1 \\ #2 \\ #3 \end{array}\right]}\) \(\newcommand{\fourvec}[4]{\left[\begin{array}{r}#1 \\ #2 \\ #3 \\ #4 \end{array}\right]}\) \(\newcommand{\cfourvec}[4]{\left[\begin{array}{c}#1 \\ #2 \\ #3 \\ #4 \end{array}\right]}\) \(\newcommand{\fivevec}[5]{\left[\begin{array}{r}#1 \\ #2 \\ #3 \\ #4 \\ #5 \\ \end{array}\right]}\) \(\newcommand{\cfivevec}[5]{\left[\begin{array}{c}#1 \\ #2 \\ #3 \\ #4 \\ #5 \\ \end{array}\right]}\) \(\newcommand{\mattwo}[4]{\left[\begin{array}{rr}#1 \amp #2 \\ #3 \amp #4 \\ \end{array}\right]}\) \(\newcommand{\laspan}[1]{\text{Span}\{#1\}}\) \(\newcommand{\bcal}{\cal B}\) \(\newcommand{\ccal}{\cal C}\) \(\newcommand{\scal}{\cal S}\) \(\newcommand{\wcal}{\cal W}\) \(\newcommand{\ecal}{\cal E}\) \(\newcommand{\coords}[2]{\left\{#1\right\}_{#2}}\) \(\newcommand{\gray}[1]{\color{gray}{#1}}\) \(\newcommand{\lgray}[1]{\color{lightgray}{#1}}\) \(\newcommand{\rank}{\operatorname{rank}}\) \(\newcommand{\row}{\text{Row}}\) \(\newcommand{\col}{\text{Col}}\) \(\renewcommand{\row}{\text{Row}}\) \(\newcommand{\nul}{\text{Nul}}\) \(\newcommand{\var}{\text{Var}}\) \(\newcommand{\corr}{\text{corr}}\) \(\newcommand{\len}[1]{\left|#1\right|}\) \(\newcommand{\bbar}{\overline{\bvec}}\) \(\newcommand{\bhat}{\widehat{\bvec}}\) \(\newcommand{\bperp}{\bvec^\perp}\) \(\newcommand{\xhat}{\widehat{\xvec}}\) \(\newcommand{\vhat}{\widehat{\vvec}}\) \(\newcommand{\uhat}{\widehat{\uvec}}\) \(\newcommand{\what}{\widehat{\wvec}}\) \(\newcommand{\Sighat}{\widehat{\Sigma}}\) \(\newcommand{\lt}{<}\) \(\newcommand{\gt}{>}\) \(\newcommand{\amp}{&}\) \(\definecolor{fillinmathshade}{gray}{0.9}\)Uncertainty
Measured numbers have "uncertainty" in that one can not know the value of a measurement that is smaller than the smallest unit of the scale. Precision is a measure of how close successive measurements are to each other. Precision is influenced by the scale, and when reporting a measurement, you report all certain values, and the the first uncertain one (which you "guesstimate"). This is illustrated in Figure \(\PageIndex{1}\). The scale on the left is a cm scale because the smallest value you know is in cm, and marker (arrow) is clearly greater than 1 and less than 2 centimeters, and so would be reported as 1.6cm, or maybe 1.7cm (as you report all certain values, plus the first uncertain value). The scale on the right is a mm scale, and you know the marker is greater than 16 mm and less than 17mm, and you would report it as 1.67cm (which is the same as 16.7mm).
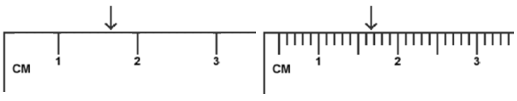
So if 100 people measure the same object, they will come up with different values, and the closeness of those values is dictated by the scale they use. The mm scale is more precise because everyone would come up with values between 1.6 and 1.7 cm, while with the cm scale, their values would be between 1 and 2 cm.Significant Digits
Significant Digits, Exact Numbers and Defined Numbers:
A counted number is an integer and thus is an exact number, for which there is no uncertainty. So it does not influence significant figures. If one looks on the web one often sees people saying that a counted number has an infinite number of significant figures, mathematically that may work, but it is incorrect, in that you do not need an infinite number of significant digits to exactly define a counted number. The fact is, there is no uncertainty in an exact number, 3 cows is 3 cows. Now defined number may or may not have significant digits. Twelve inches = 1 foot, there are no significant digits. But an irrational number like \(\pi\), which is also a defined number, would require an infinite number of significant digits to exactly define, and if you use pi in a calculation, you should use enough significant digits so that it does not determine the number of significant digits in your final answer. Simply speaking, significant digits are a way to indicate the precision of measured values, and the above rules enable you to preserve them in calculations. Exact and defined numbers do not involve measurements, and so they do not influence the number of significant digits in a calculations (unless you do not use enough digits for a defined value like \(\pi\)).
Significant Digits
It should be noted that we use the terms "significant digits" and "significant figures" synonymously. In making measurements we report all certain values and the first uncertain value and the number of digits in that number is the number of significant figures in the answer. First we will go over the rules for representing significant digits in a reported measured value and then the rules for determining them from a measurement. Then we will go over how to carry significant digits in a calculation and how to round up or down (truncate) calculated answers that have more digits than are significant.
Significant Digits Rules
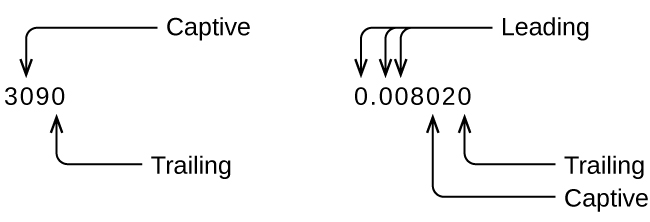
Whenever you make a measurement properly, all the digits in the result are significant. But what if you were analyzing a reported value and trying to determine what is significant and what is not? Well, for starters, all nonzero digits are significant, and it is only zeros that require some thought. We will use the terms “leading,” “trailing,” and “captive” for the zeros and will consider how to deal with them.
- Non Zeros are always significant
- Leading Zeros are never significant
- Captive Zeros are always significant
- Trailing Zeros are only significant if a number has a decimal point*
*Note: Some textbooks/instructors will state the number of significant digits is undetermined if you have trailing digits without a decimal point, so 200 could have one, two or three sig figs. In my class we will say 200 has one significant digit, and you can't express it two or three sig figs in floating decimal point notation, and that is why we sometimes need to use scientific notation.
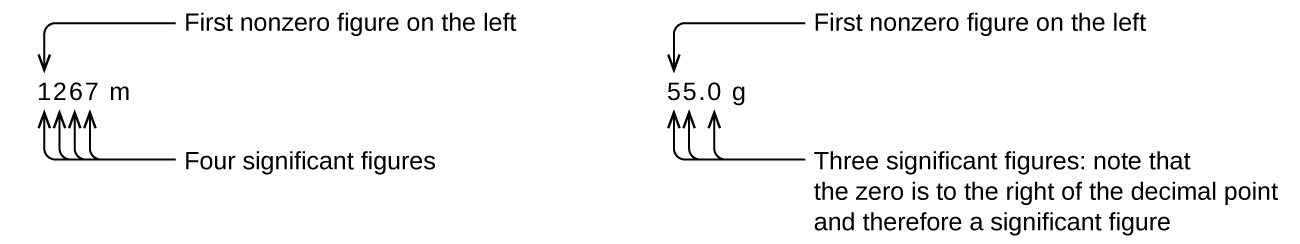
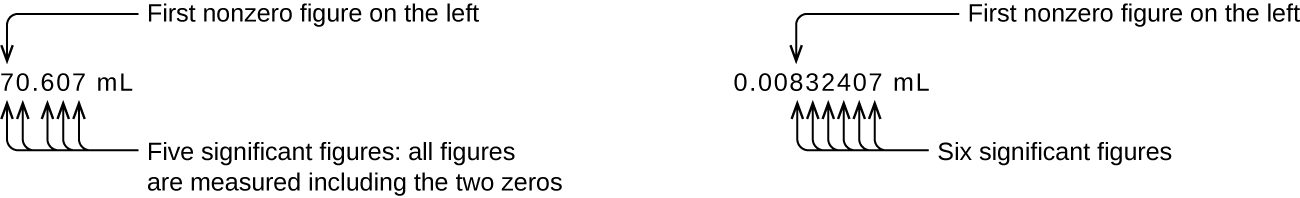
Starting with the first nonzero digit on the left, count this digit and all remaining digits to the right. This is the number of significant figures in the measurement unless the last digit is a trailing zero lying to the left of the decimal point.
Captive zeros result from measurement and are therefore always significant. Leading zeros, however, are never significant—they merely tell us where the decimal point is located.
The leading zeros in this example are not significant. We could use exponential notation (as described in Appendix B) and express the number as 8.32407 \(\times\) 10−3; then the number 8.32407 contains all of the significant figures, and 10−3 locates the decimal point.
Note
Remember, Significant Digits apply to measured numbers, not counted or exact numbers. 100 mushrooms does not have any significant digits, it is an exact number, but 100.0 g of mushrooms has 4 significant digits, as they were measured with a scale where 1 gram was the smallest increment. Some instructors say the have an infinite number of significant digits, which implies that they do not contribute to the number of significant digits in a calculation.
Reporting Significant Digits for Measured Numbers
Significant Digits (Figures) are a way of expressing the uncertainty in a reported value, where you indicate all certain and the first uncertain digit. The goal is to:
- Report all certain values
- Report first uncertain value
- Uncertain Value is a "guess" between smallest unit of scale
- Successive Measurements will vary by uncertain value
Classroom Activity
Go to the following Google Forms and Fill them out. Please do not do this if you are not in my class. You need to write down your answer on a sheet of paper, as we will use it in a Google Doc.
Exercises \(\PageIndex{2}\) through \(\PageIndex{5}\) are measurements of the same piece of paper using different scales.
Exercise \(\PageIndex{1}\)
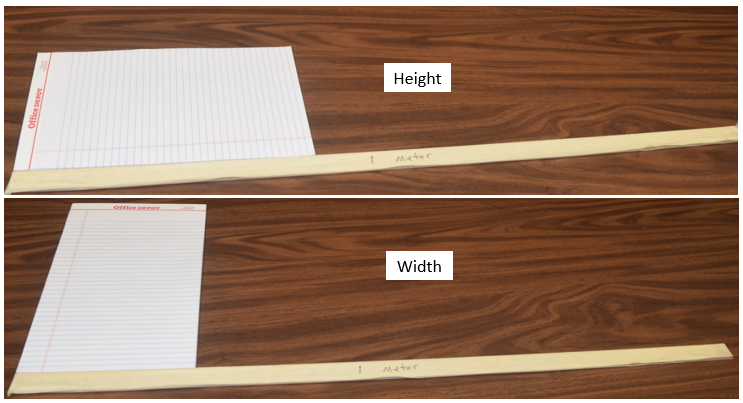
What is the height and width of the following piece of paper in units of meters?
- Answer
-
Height = 0.4 or maybe 0.5 or 0.3, width = 0.2, although maybe 0.1 or 0.3, depending on how you look at it.
Exercise \(\PageIndex{2}\)
What is the height and width of the following piece of paper in units of centimeters?
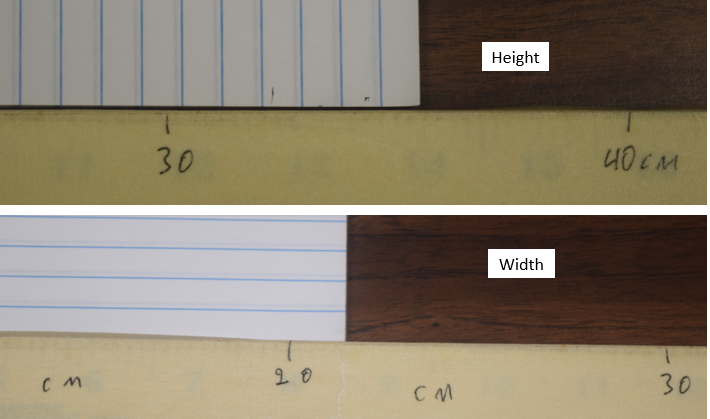 Figure \(\PageIndex{3}\): Sheet of paper measured with a centimeter scale (see section on SI Units. (Copyright; Bob Belford, LibreText)
- Answer
-
Height = 35 or maybe 36 or 37, width = 22, although maybe 21 or 23, depending on how you look at it.
Exercise \(\PageIndex{3}\)
What is the height and width of the following piece of paper in units of centimeters?
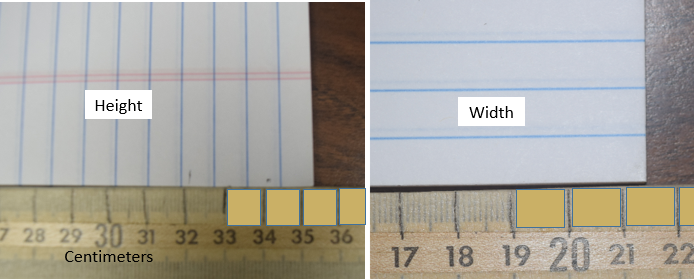 Figure \(\PageIndex{4}\): Sheet of paper measured with a centimeter scale (see section on SI Units. (Copyright; Bob Belford, LibreText)
- Answer
-
Height = 35.2 or maybe 35.1 or 35.3, width = 21.3, although maybe 21.4 or 21.5, depending on how you look at it.
Exercise \(\PageIndex{4}\)
What is the height and width of the following piece of paper in units of centimeters?
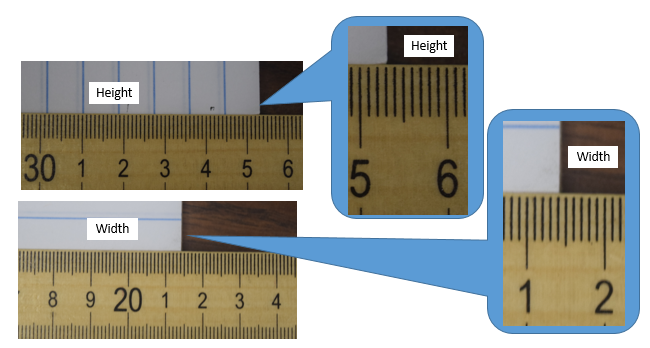 Figure \(\PageIndex{5}\): Sheet of paper measured with a centimeter scale (see section on SI Units. (Copyright; Bob Belford, LibreText)
- Answer
-
Height = 35.31 or maybe 35.32 or 35.30, Width = 21.40, although maybe 21.41, depending on how you look at it.
Significant Digits, Calculations and Rounding off Answers
It is important to be able to preserve the number of significant Figures in calculations based on the precision of the data used in those calculations, and there are two sets of rules, one for multiplication and division, and the other for addition and subtraction.
Multiplication and Division
The number of significant Figures in the product of multiplication or dividend of division is based on the valued used with the least number of significant digits.
Exercise \(\PageIndex{5}\)
How many significant Figures are in the answer to the following problem?
\[\frac{(3.42)(127)}{1.6}=? \nonumber\]
- Answer
-
Two, you do not even need to do the math to answer this question.
Why are Leading Zeros Not Significant?
Consider you weigh 1000 paper clips, accurately counted and the combined weight is 1 gram. This has one significant digit. If you then asked how much did each paperclip weight, you divide 1g by 1000 paper clips to get the mass of each paper clip
\[1000 \; paper\; clips = 1 g \\ \; \\ \frac{1000 \; paper \; clips}{1000 \; paper \; clips}=\frac{1g}{1000 paper \; clips} \\ \; \\ \frac{\color{blue}{\cancel{1000 \; paper \; clips}}}{\color{blue}{\cancel{1000 \; paper \; clips}}}=\frac{1g}{1000 paper \; clips} \\ \; \\1=0.001\frac{g}{paper \; clip} \\ \; \\ 1 \; paper \; clip = 0.001 g\]
Since 1000 paper clips is an exact number and does not have significant digits, and 1 gram has one significant digits, the answer would have one significant digits, and thus the convention that leading zeros are never significant. if we said 1000 paper clips = 1.00 grams, the one paper clip = 0.00100 g.
Addition and Subtraction
Here, the number of significant Figures is based on the least precise measured value. In this case you actually have to line the numbers up by the decimal point and do the math, and then limit the answer to the precision of the least precise value.
Consider:
Exercise \(\PageIndex{6}\)
How many significant Figures are in the answer for 99 + 1?.
- Answer
-
3, the answer is 100. or 1.00 x 10² because both numbers are known to the "ones" place.
Note: in the above exercise, a number with two sig. figs was added to a number with one sig fig., and the answer had three sig. figs. Unlike multiplication and division, you must do the math to determine the number of sig. figs for addition and subtraction.
Rounding Off Answers
When you have to truncate an answer by removing numbers you may round up or round down. Truncation is removing a digit from the number, and all digits smaller than that digit.
- If truncated digit is less than 5, round down (use value of preceding digit)
- if truncated value is greater than 5, round up (add one to preceding value).
- if truncated value equals 5, look at the next digit (Even Down Odd Up).
- if it is even or non existent (0,2,4,6,8), round down (treat the 5 as a 4)
- if it is odd (1,3,5,7,9), round up (treat the 5 as a 6)
Warning!
If the truncated value is 5 some instructors and textbooks say to always truncate up (0,1,2,3,4 round down, while 5,6,7,8,9 round up) so you should ask you instructor what they want you to do in their class, and do that! The problem with always rounding 5 up is the accumulation of round off error when rounded up numbers are used in subsequent calculations like averaging. Five is half way between 0 and 10 and so statistically it would be better to round up half the time and round down the other. Since there are five even numbers (0,2,4,6,8) and five odd numbers (1,3,5,7,9), we round the evens down and the odds up. If five is the last given number, look at the number that preceeds it and round down if even and up if odd, so the result is always rounded to an even number.
|
number to round / |
result | comment |
|---|---|---|
| round 34.216 to 3 sig figs | 34.2 | First non-significant digit (1) is less than 5, so number is simply truncated. |
| round 2.252 to 2 sig figs | 2.2 | First non-significant digit is 5, since the preceding digit is even, round down (treat the 5 as a 4) |
| round 2.353 to 2 sig figs | 2.4 | First non-significant digit is 5, since the preceding digit is odd, round up (treat the 5 as a 6) |
| round 2.25 to 2 sig figs | 2.2 | First non-significant digit is 5, since the preceding digit is even round down |
| round 39.99 to 3 sig figs | 40.0 | Crossing "decimal boundary", so all numbers change. |
| round 85,381 to 3 sig figs | 85,400 | The two zeros are just placeholders |
| round 0.04597 to 3 sig figs | 0.0460 | The two leading zeros are not significant digits. |
Exercise \(\PageIndex{7}\)
What is the length in centimeters of 3 sheets of paper aligned in a row ig the width of each sheet was obtained from the measurement and scale used in exercise \(\PageIndex{3}\) (width = 21.3 cm). Assume the three sheets are exactly touching with no overlap or space between them.
- Answer
-
\[3 \times 21.3cm=63.9cm\], the number has three significant digits because the three sheets of paper is an exact number and the 21.3cm has three significant digits.
Exercise \(\PageIndex{8}\)
What is the height in centimeters of 3 sheets of paper aligned in a column if height of each sheet was obtained from the measurment and scale used in exercise \(\PageIndex{3}\) (height = 35.2cm cm). Assume the three sheets are exactly touching with no overlap or space between them.
- Answer
-
A\[3 \times 35.2cm=105.6cm=106cm\], the number has three significant digits because the three sheets of paper is an exact number and the 35.2cm has three significant digits.
Compound Calculations
Use all digits during intermittent steps and only truncate the final answer. You have to manually determine the number of significant digits of intermediate addition or subtraction steps (but use all digits in subsequent calculations). Do not truncate (round off) intermediate steps
Example \(\PageIndex{3}\)
\[\frac{99.0g}{1g+99g}=?\]
Solution
0.990g because the rule of addition and subtraction give three significant digits for the denominator, thus both the denominator and numerator have three significant digits.
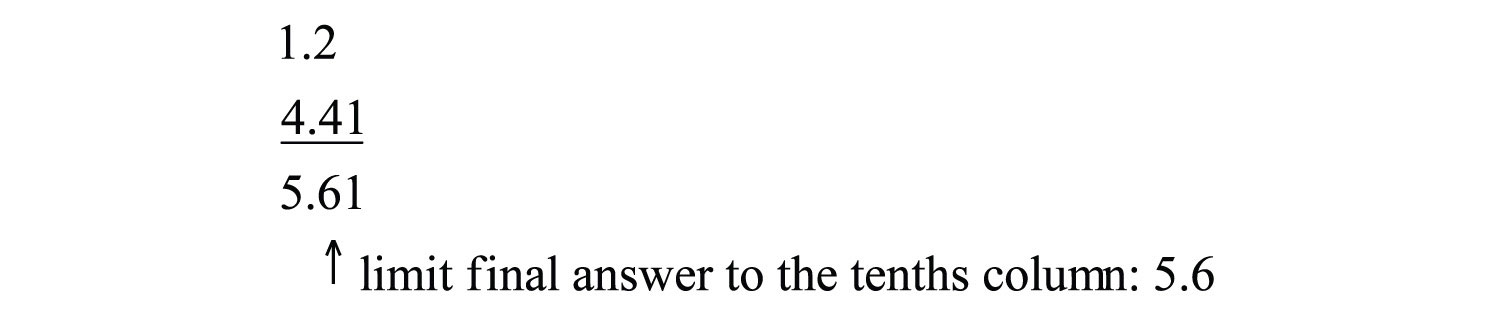
Perform addition in the parenthesis first. Note the following problem will give the wrong answer if you round off during intermediate calculations.
Example \(\PageIndex{4}\)
(1.89g + 1.55g + 1.0g) x 7.57g =
Solution
(1.89g + 1.55g + 1.0g)= 4.44
4.44 x 7.57=33.6108=34.
Note, if you truncated 4.44 to 4.4 you would have gotten the wrong answer!
(1.89g + 1.55g + 1.0g)= 4.44 = 4.4 (round down), if you then used that value for the subsequent step you would get the wrong answer
4.4x7.57=33.308=33 (wrong answer)
You only truncate in the last step.
Exercise \(\PageIndex{9}\)
What is the area of the rectangle formed by 9 sheets of paper forming 3 rows and 3 columns, where the rows are the width of the sheet of paper in exercise 7 (21.3 cm) and the height of the columns are made by three sheets with the height of exercise 8 (35.2 cm). Assume the three sheets are exactly touching with no overlap or space between them.
- Answer
-
\[63.9cm \times 105.6cm=6747.84cm^2 =6750cm^2\] Although we used four sig figs in the calculation for the height, both numbers really had 3 sig figs and so we round down to 3 sig. figs.(see Note below if you came up with 6770cm2)
Note
If in exercise \(\PageIndex{9}\) you had used the answers from exercises \(\PageIndex{7}\) and \(\PageIndex{8}\) you would have gotten the wrong answer as you rounded up during an intermediate calculations. Only round up or down on the final step. This may mean you need to make a note of the number of significant digits of numbers used in intermediate steps.
Contradictions of the Rules
Sometimes the rules break down and you need to be aware of it. For example, if you weight two nickels and each nickel weights 5.0 grams, what is the weight of both nickels? Well, multiplication is the repetition of addition and so you could multiply the weight of each nickel by two
\[2\, \text{nickels} \left ( \dfrac{5.0 \,\text{grams}}{\text{nickel}} \right )= 10. \; \text{grams}\]
or you could add the mass of the two nickels
\[5.0\,g +5.0\,g = 10.0\,g\]
So when you multiplied the answer would have two significant Figures because the number with the least was the measured mass (the 2 nickels was an exact counted number), but when you added, they were all known to the tenths position, and so your answer has 3 significant digits.
Experimental Error
There are two basic types of error, systematic and random error. Systematic error is often due to faulty equipment or techniques. For example, if a meter stick was worn down on the end that reads zero, it would give values that are higher than the true value. concepts we need to understand in experimental error, accuracy and precision. Accuracy is how close your value or measurement is to the correct (true) value, and precision is how close repeated measurements are to each other. If the targets below represent attempts to hit the bulls eyes in an archery contest, they represent two types of error. The ones in the left image represents systematic error as all hits are to the left of the bulls eye. This kind of error would occur if you use an old ruler to measure length, but the ruler was worn down over time so it was no longer twelve inches. If you average all measurements that contain systematic error, you still miss the true value. On the right the holes are scattered around the bulls eye in relatively equal directions, so the error is random. If you average the random error, you actually get a good estimate of where the bulls eye is. So to compensate for systematic error you need to recognize it, and adjust for it. You can compensate for random error by making multiple measurements and averaging them.
Accuracy
The accuracy of a measurement is how close it is to the real value. If error is random, we can improve the accuracy by taking several measurements and using the average value. Thus, the average value of all the measurements on the right target of Figure \(\PageIndex{6}\) is very close to the center, but the average on the left side is not. We often use percent error to describe the accuracy of a measurement.
Percent Error
\[Percent \; Error=\frac{|Experimental \; Value-Theoretical \;Value|}{Theoretical \;Value}(100)\]
Where the theoretical value is the true value and the experimental value is the measured value. Note, some texts omit the absolute value sign, which means some measurements would have a positive percent error and others would have a negative. The problem with that is if one wanted to know the average percent error for a series of random measurements, the positive and negative values would cancel and indicate a lower average value than is real. Note, that is a different question than what is the percent error of the average value, in which case you would calculate the average value, and base the error on that. The advantage of omitting the absolute value sign is a positive value means your reading is too high, and negative means it is too low. If you make multiple measurements, it is best to use the absolute value sign, and if only one, it does not really matter. It would probably be best to ask your instructor if you are in a lab class.
Precision
Precision is a measure of how close successive measurements are to each other. Precision is influenced by the scale, and when reporting a measurement, you report all certain values, and the the first uncertain one (which you "guesstimate"). Precision is how close successive measurements are and is often described by the Standard Deviation of a lot of measurements. This class will not do standard deviation counts, but you should quickly skim the chem 1402 section 1B2.121 Standard Deviation.
Note
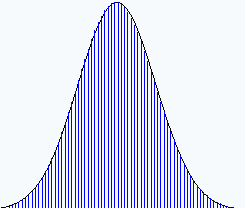
For Random error you can average many values and get a pretty accurate reading of the true value, but for systematic error the average is off because all measurements had the same systematic error. Random error often results in the symmetric bell curve distribution where the frequency of over estimated values the same as the frequency of underestimated values. Thus scientists often make a large number of measurements and use the average value, which only works for random error.
Contributors and Attributions
Robert E. Belford (University of Arkansas Little Rock; Department of Chemistry). The breadth, depth and veracity of this work is the responsibility of Robert E. Belford, rebelford@ualr.edu. You should contact him if you have any concerns. This material has both original contributions, and content built upon prior contributions of the LibreTexts Community and other resources, including but not limited to:
- Stephen Lower (Simon Fraser University)
- Paul Flowers, Klaus Theopold & Richard Langley et al, General Chemistry at OpenStax CNX
- Vincent Belford (H5P interactive modules)