
6: How to Search PubChem for Chemical Information (Part 2)
- Page ID
- 83732

\( \newcommand{\vecs}[1]{\overset { \scriptstyle \rightharpoonup} {\mathbf{#1}} } \)
\( \newcommand{\vecd}[1]{\overset{-\!-\!\rightharpoonup}{\vphantom{a}\smash {#1}}} \)
\( \newcommand{\dsum}{\displaystyle\sum\limits} \)
\( \newcommand{\dint}{\displaystyle\int\limits} \)
\( \newcommand{\dlim}{\displaystyle\lim\limits} \)
\( \newcommand{\id}{\mathrm{id}}\) \( \newcommand{\Span}{\mathrm{span}}\)
( \newcommand{\kernel}{\mathrm{null}\,}\) \( \newcommand{\range}{\mathrm{range}\,}\)
\( \newcommand{\RealPart}{\mathrm{Re}}\) \( \newcommand{\ImaginaryPart}{\mathrm{Im}}\)
\( \newcommand{\Argument}{\mathrm{Arg}}\) \( \newcommand{\norm}[1]{\| #1 \|}\)
\( \newcommand{\inner}[2]{\langle #1, #2 \rangle}\)
\( \newcommand{\Span}{\mathrm{span}}\)
\( \newcommand{\id}{\mathrm{id}}\)
\( \newcommand{\Span}{\mathrm{span}}\)
\( \newcommand{\kernel}{\mathrm{null}\,}\)
\( \newcommand{\range}{\mathrm{range}\,}\)
\( \newcommand{\RealPart}{\mathrm{Re}}\)
\( \newcommand{\ImaginaryPart}{\mathrm{Im}}\)
\( \newcommand{\Argument}{\mathrm{Arg}}\)
\( \newcommand{\norm}[1]{\| #1 \|}\)
\( \newcommand{\inner}[2]{\langle #1, #2 \rangle}\)
\( \newcommand{\Span}{\mathrm{span}}\) \( \newcommand{\AA}{\unicode[.8,0]{x212B}}\)
\( \newcommand{\vectorA}[1]{\vec{#1}} % arrow\)
\( \newcommand{\vectorAt}[1]{\vec{\text{#1}}} % arrow\)
\( \newcommand{\vectorB}[1]{\overset { \scriptstyle \rightharpoonup} {\mathbf{#1}} } \)
\( \newcommand{\vectorC}[1]{\textbf{#1}} \)
\( \newcommand{\vectorD}[1]{\overrightarrow{#1}} \)
\( \newcommand{\vectorDt}[1]{\overrightarrow{\text{#1}}} \)
\( \newcommand{\vectE}[1]{\overset{-\!-\!\rightharpoonup}{\vphantom{a}\smash{\mathbf {#1}}}} \)
\( \newcommand{\vecs}[1]{\overset { \scriptstyle \rightharpoonup} {\mathbf{#1}} } \)
\(\newcommand{\longvect}{\overrightarrow}\)
\( \newcommand{\vecd}[1]{\overset{-\!-\!\rightharpoonup}{\vphantom{a}\smash {#1}}} \)
\(\newcommand{\avec}{\mathbf a}\) \(\newcommand{\bvec}{\mathbf b}\) \(\newcommand{\cvec}{\mathbf c}\) \(\newcommand{\dvec}{\mathbf d}\) \(\newcommand{\dtil}{\widetilde{\mathbf d}}\) \(\newcommand{\evec}{\mathbf e}\) \(\newcommand{\fvec}{\mathbf f}\) \(\newcommand{\nvec}{\mathbf n}\) \(\newcommand{\pvec}{\mathbf p}\) \(\newcommand{\qvec}{\mathbf q}\) \(\newcommand{\svec}{\mathbf s}\) \(\newcommand{\tvec}{\mathbf t}\) \(\newcommand{\uvec}{\mathbf u}\) \(\newcommand{\vvec}{\mathbf v}\) \(\newcommand{\wvec}{\mathbf w}\) \(\newcommand{\xvec}{\mathbf x}\) \(\newcommand{\yvec}{\mathbf y}\) \(\newcommand{\zvec}{\mathbf z}\) \(\newcommand{\rvec}{\mathbf r}\) \(\newcommand{\mvec}{\mathbf m}\) \(\newcommand{\zerovec}{\mathbf 0}\) \(\newcommand{\onevec}{\mathbf 1}\) \(\newcommand{\real}{\mathbb R}\) \(\newcommand{\twovec}[2]{\left[\begin{array}{r}#1 \\ #2 \end{array}\right]}\) \(\newcommand{\ctwovec}[2]{\left[\begin{array}{c}#1 \\ #2 \end{array}\right]}\) \(\newcommand{\threevec}[3]{\left[\begin{array}{r}#1 \\ #2 \\ #3 \end{array}\right]}\) \(\newcommand{\cthreevec}[3]{\left[\begin{array}{c}#1 \\ #2 \\ #3 \end{array}\right]}\) \(\newcommand{\fourvec}[4]{\left[\begin{array}{r}#1 \\ #2 \\ #3 \\ #4 \end{array}\right]}\) \(\newcommand{\cfourvec}[4]{\left[\begin{array}{c}#1 \\ #2 \\ #3 \\ #4 \end{array}\right]}\) \(\newcommand{\fivevec}[5]{\left[\begin{array}{r}#1 \\ #2 \\ #3 \\ #4 \\ #5 \\ \end{array}\right]}\) \(\newcommand{\cfivevec}[5]{\left[\begin{array}{c}#1 \\ #2 \\ #3 \\ #4 \\ #5 \\ \end{array}\right]}\) \(\newcommand{\mattwo}[4]{\left[\begin{array}{rr}#1 \amp #2 \\ #3 \amp #4 \\ \end{array}\right]}\) \(\newcommand{\laspan}[1]{\text{Span}\{#1\}}\) \(\newcommand{\bcal}{\cal B}\) \(\newcommand{\ccal}{\cal C}\) \(\newcommand{\scal}{\cal S}\) \(\newcommand{\wcal}{\cal W}\) \(\newcommand{\ecal}{\cal E}\) \(\newcommand{\coords}[2]{\left\{#1\right\}_{#2}}\) \(\newcommand{\gray}[1]{\color{gray}{#1}}\) \(\newcommand{\lgray}[1]{\color{lightgray}{#1}}\) \(\newcommand{\rank}{\operatorname{rank}}\) \(\newcommand{\row}{\text{Row}}\) \(\newcommand{\col}{\text{Col}}\) \(\renewcommand{\row}{\text{Row}}\) \(\newcommand{\nul}{\text{Nul}}\) \(\newcommand{\var}{\text{Var}}\) \(\newcommand{\corr}{\text{corr}}\) \(\newcommand{\len}[1]{\left|#1\right|}\) \(\newcommand{\bbar}{\overline{\bvec}}\) \(\newcommand{\bhat}{\widehat{\bvec}}\) \(\newcommand{\bperp}{\bvec^\perp}\) \(\newcommand{\xhat}{\widehat{\xvec}}\) \(\newcommand{\vhat}{\widehat{\vvec}}\) \(\newcommand{\uhat}{\widehat{\uvec}}\) \(\newcommand{\what}{\widehat{\wvec}}\) \(\newcommand{\Sighat}{\widehat{\Sigma}}\) \(\newcommand{\lt}{<}\) \(\newcommand{\gt}{>}\) \(\newcommand{\amp}{&}\) \(\definecolor{fillinmathshade}{gray}{0.9}\)
 |
UALR 4399/5399: ChemInformatics |
 |
Learning Objectives:
- Review identity search, substructure/superstructure search, and similarity search.
- Review basic knowledge of molecular similarity methods.
- Learn how to retrieve bioactivity data from PubChem.
- Learn how to use PubChem’s Structure Clustering and Structure-Activity Relationship (SAR) Analysis tools.
- Learn how to analyze bioactivity data using PubChem’s web-based interfaces.
1. SEARCHING PUBCHEM USING A NON-TEXTUAL QUERY
This section describes various searches that can be performed in PubChem.1-3 Currently PubChem has three different search interfaces:
- PubChem homepage (http://pubchem.ncbi.nlm.nih.gov)
- PubChem Chemical Structure Search (https://pubchem.ncbi.nlm.nih.gov/search/search.cgi)
- PubChem Search (https://pubchem.ncbi.nlm.nih.gov/search/).
As explained in Module 5, the PubChem homepage provides a search interface for all three primary databases (e.g., Substance, Compound, and BioAssay). However, the search box on the PubChem homepage can accepts textual keywords only, and it is difficult to input non-textual queries (such as chemical structures). The PubChem Chemical Structure Search allows users to perform various searches using both textual and non-textual queries. This search interface is integrated with PubChem Sketcher,4 which enables users to provide the 2-D structure of a molecule as a query for chemical structure search. While the PubChem Chemical Structure Search is limited to search for chemical structures, the PubChem Search allows users to search for bioassays, bioactivities, patents, and targets as well as chemical structures, but it is still in beta testing. In this module, we use the Chemical Structure Search for chemical structure search.
1.1. Molecular formula search
Molecular formula search allows one to find molecules that contain a certain number and type of elements. Typically, molecular formula search returns by default molecules that exactly match the queried stoichiometry. For example, a query of “C6H6” will return all structures containing six carbon atoms, six hydrogen atoms and nothing else. However, molecular formula search implemented in some databases, including PubChem Chemical Structure Search, has an option to allow other elements in returned hits (e.g., C6H6O or C6H6N2O for the “C6H6” query).
1.2. Identity search
Identity search is to locate a particular chemical structure that is “identical” to the query chemical structure. Although identity search seems conceptually straightforward, one should keep in mind that the word “identical” can have different notions. For example, if a molecule exists as multiple tautomeric forms in equilibrium, do you want to consider all these tautomers identical and search the database for all of them? If your query molecule has a chiral stereo center, should you consider both R- and S-forms in your search? In your identity search, do you want to include isotopically substituted species of the provided query molecule as well as the query itself? Depending on how to deal with these nuances of chemical structures, identical search will return different results. The identity search in the PubChem Chemical Structure Search allows users to choose a desired degree of “sameness” from several predefined options. To see these options, one need to expand the options section by clicking the “plus” button next to the “option” section heading.
1.3. Substructure and superstructure search
When a chemical structure occurs as a part of a bigger chemical structure, the former is called a substructure and the latter is referred to as a superstructure. For example, ethanol is a substructure of acetic acid, and acetic acid is a superstructure of ethanol.
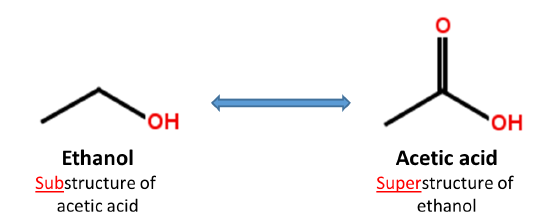
In substructure search, one provides an input substructure as a query to find molecules that contain the query substructure (that is, superstructures that contain the query substructure). On the contrary, superstructure search returns molecules that comprise or make up the provided chemical structure query (that is, substructures that is contained in the query superstructure). It should be noted that substructure search does not give you substructures of the query and that superstructure search does not return superstructures of the query.
It is possible to include explicit hydrogen atoms as part of the pattern being searched. For example, if you choose to do so, the SMILES queries [CH2][CH2][OH] and [CH3][CH][OH] will return molecules whose formula are R-CH2-CH2-OH and CH3-CH(R)-OH, respectively. Substructure/superstructure searches implemented in some databases remove by default explicit hydrogens from the query molecule prior to search, the two SMILES queries [CH2][CH2][OH] and [CH3][CH][OH] may give you the same result as what the SMILES query CCO does, unless you specify that explicit hydrogens should be included in pattern matching.
In addition to explicit hydrogen atoms, there are additional factors that may affect results of substructure/superstructure searches, for example, whether to ignore stereochemistry, isotopism, tautomerism, formal charge, and so on.
1.4. Similarity search
Molecular similarity (also called chemical similarity or chemical structure similarity) is a fundamental concept in cheminformatics, playing an important role in computational methods for predicting properties of chemical compounds as well as designing chemicals with desired properties. The underlying assumption in these computational methods is that structurally similar molecules are likely to have similar biological and physicochemical properties (commonly called the similarity principle).5 Molecular similarity is a straightforward and easy-to-understand concept, but there is no absolute, mathematical definition of molecular similarity that everyone agrees on. As a result, there are a virtually infinite number of molecular similarity methods, which quantify molecular similarity. Similarity search uses a molecular similarity method to find molecules similar to the query structure.
1.4.1. Two-dimensional (2-D) similarity methods
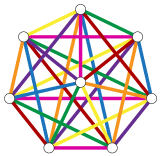
Molecular similarity methods can be broadly classified into two-dimensional (2-D) and three-dimensional (3-D) similarity methods. Typically, 2-D similarity methods use so-called molecular fingerprints. The most common types of molecular fingerprints are structural keys, which encode structural information of a molecule into a binary string (that is, a string of 0’s and 1’s). The position of each number in this string corresponds to a particular fragment. If the molecule has a particular fragment, the corresponding bit position is set to 1, and otherwise to 0. Note that there are many different ways to design molecular fingerprints, depending on what fragments are included in the fingerprint definition. PubChem uses its own fingerprint called PubChem subgraph fingerprints.
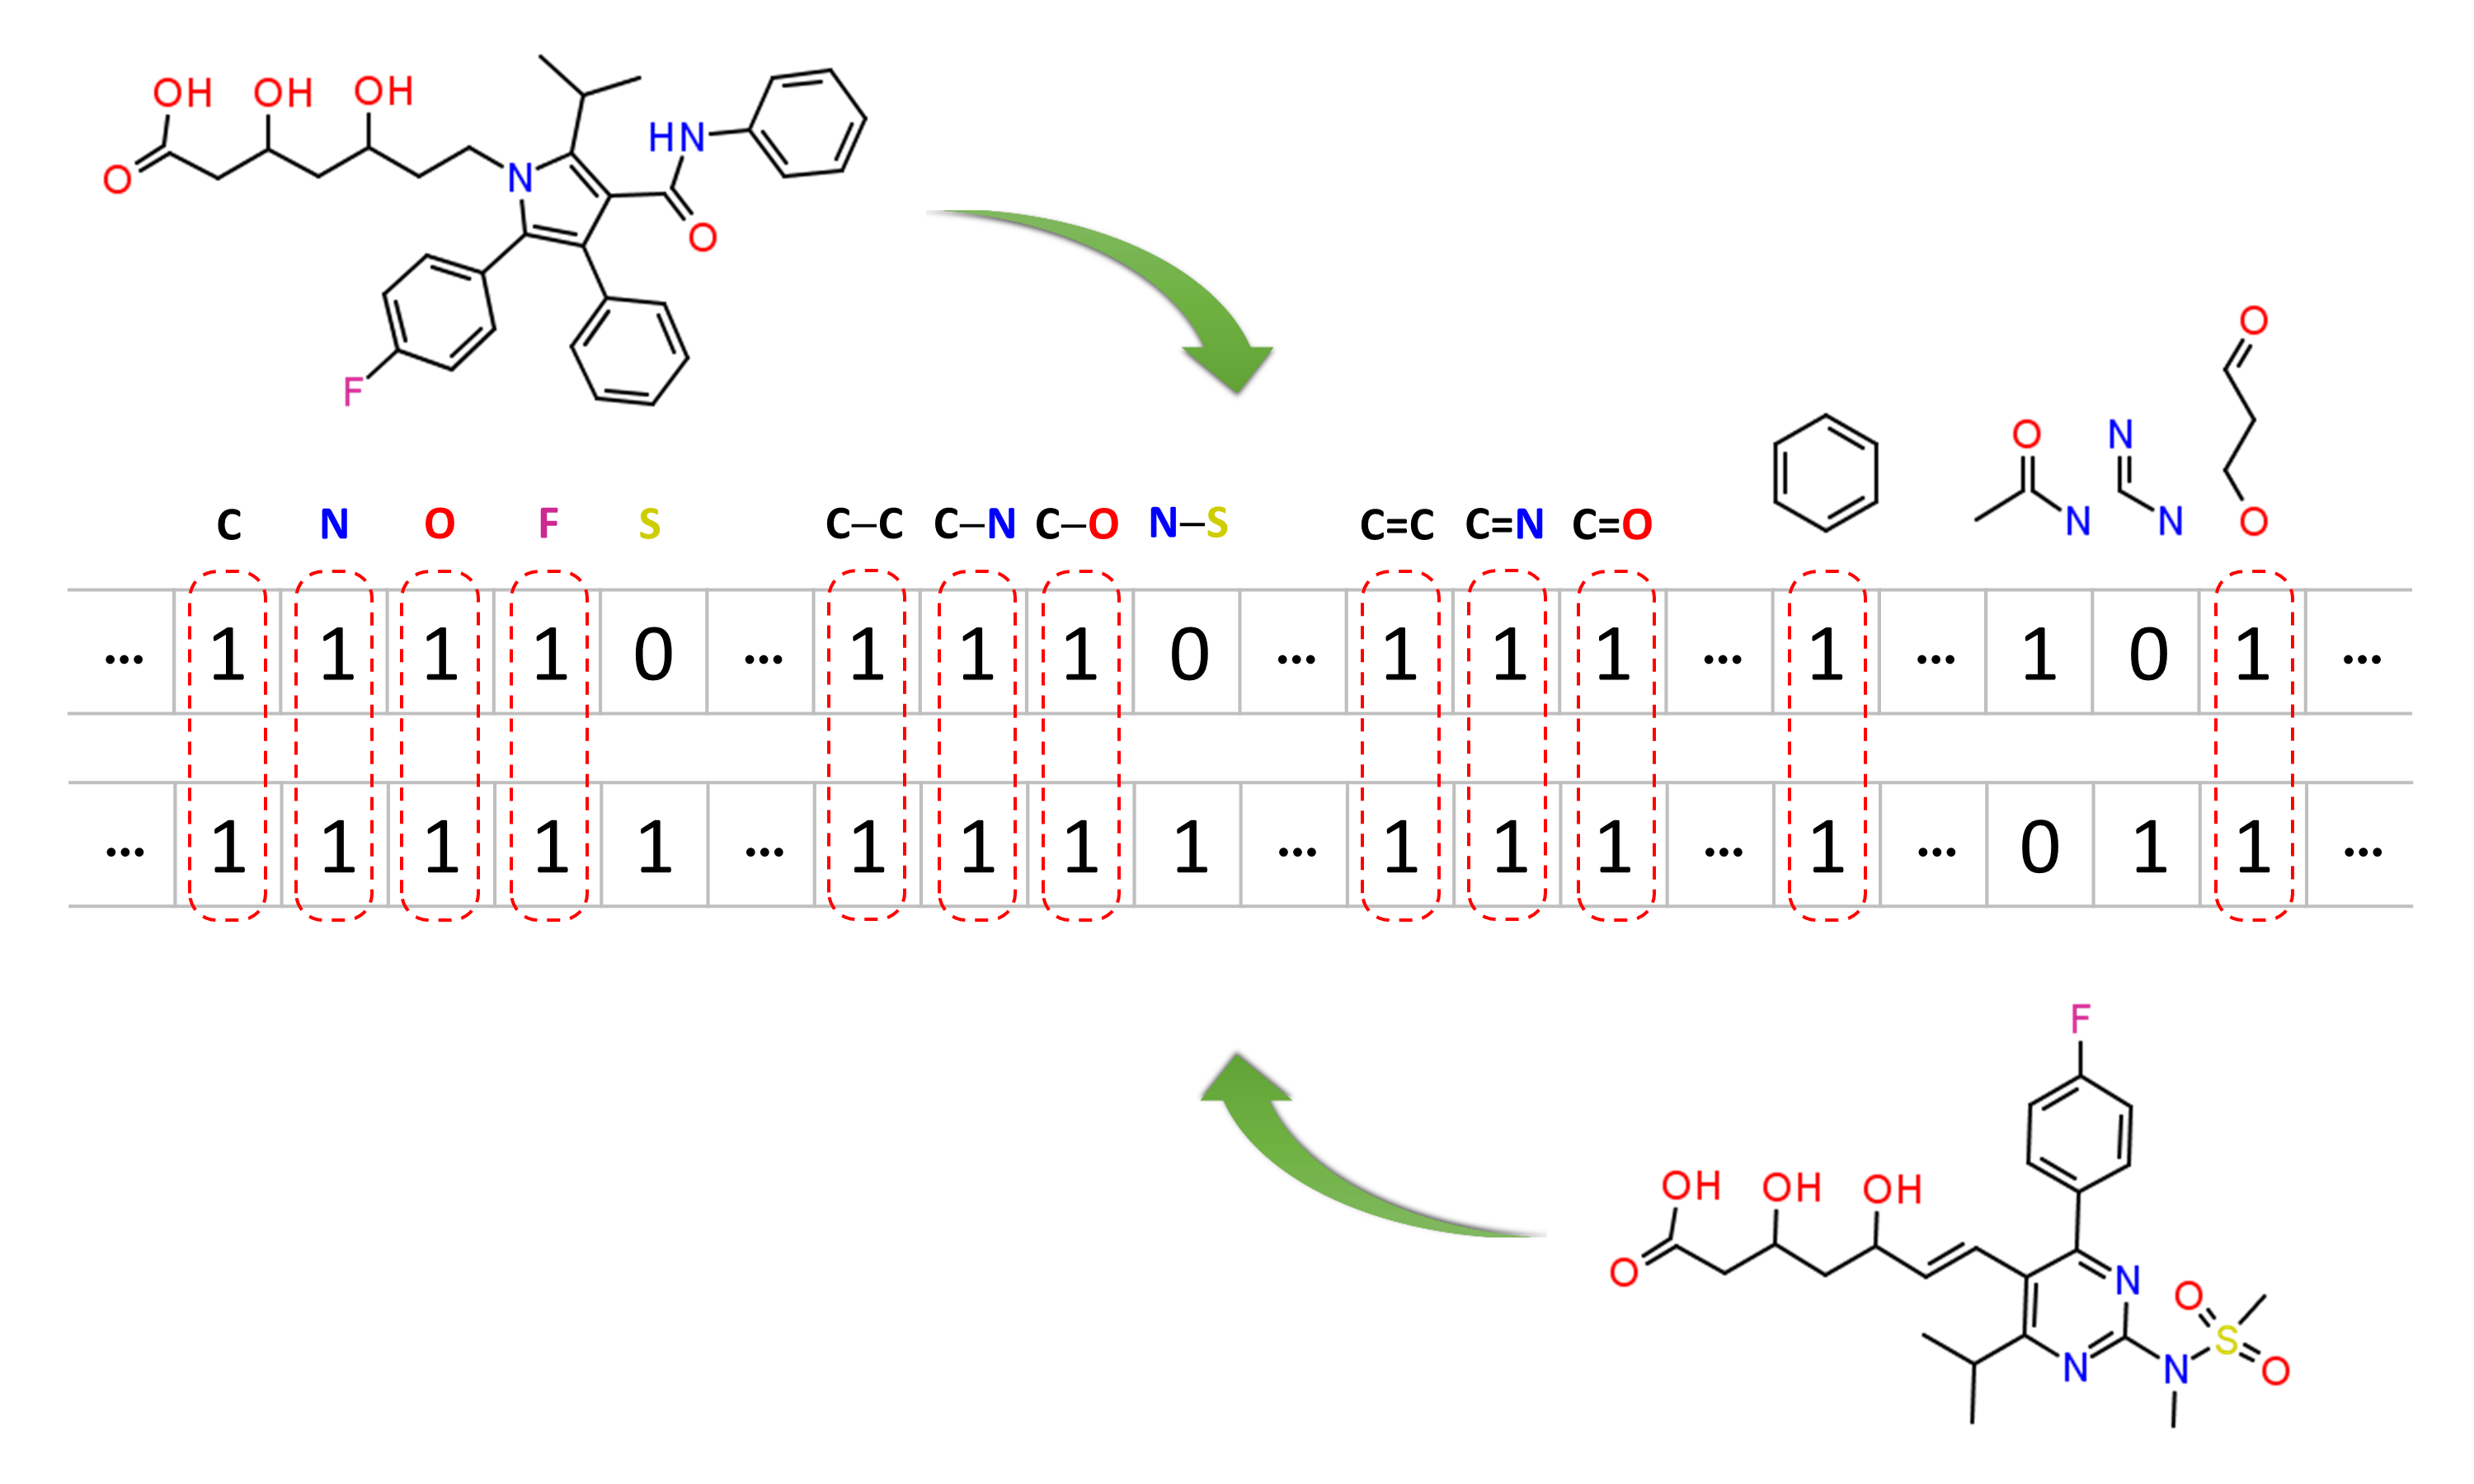
In 2-D similarity methods, structural similarity between two molecules is estimated by comparing their molecular fingerprints. Their similarity is quantified as a so-called similarity score or similarity coefficient. While several different methods can be used for computation of a similarity score, the underlying ideas are the same as each other: if the two fingerprints have 1’s at the same position, it means that both compounds have the same fragment, and if the molecules share more common fragments, they are considered to be more similar. In conjunction with the PubChem subgraph fingerprints, PubChem 2-D similarity method use the Tanimoto coefficient6-8
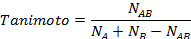
where NA and NB are the number of bits set in the fingerprints for molecules A and B, respectively, and NAB is the number of bits set in both fingerprints. The Tanimoto score ranges from 0 (for no similarity) to 1 (for identical molecules). 2-D Similarity search returns molecules whose similarity scores with the query molecule are greater than or equal to a given Tanimoto cut-off value.
1.4.2. PubChem 3-D similarity method
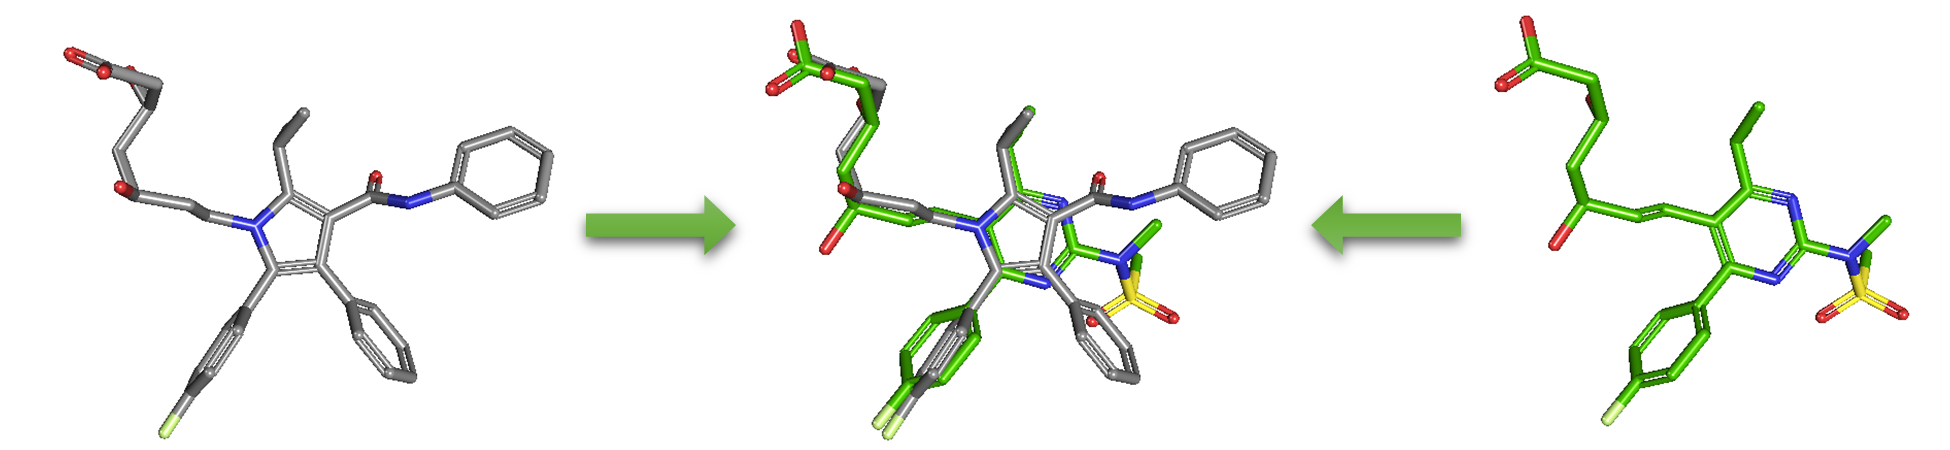
As an alternative to 2-D similarity search, 3-D similarity search can also be performed using the “3D conformer” tab in PubChem Chemical Structure Search. 3-D similarity methods use the 3-D structures (that is, conformations) of molecules. PubChem’s 3-D similarity method is based on the atom-centered Gaussian-shape comparison method by Grant and coworkers,9-12 implemented in the Rapid Overlay of Chemical Structures (ROCS).13,14 While the underlying mathematics of this approach is beyond the scope of this module, what this method essentially does is to find the “best” alignment of the 3-D structures of two molecules, which gives the maximized overlap between them. The 3-D similarity method quantifies the 3-D molecular similarity using three metrics.
- Shape-Tanimoto (ST): quantifies steric shape similarity between two conformers.
- Color-Tanimoto (CT): quantifies the overlap of functional groups between two conformers, such as hydrogen bond donors and acceptors, cations, anions, rings, and hydrophobes.
- Combo-Tanimoto (ComboT): the sum of ST and CT scores between two conformers. It takes into account the shape similarity (ST) and functional group similarity (CT) simultaneously.
Because both the ST and CT scores range from 0 (for no similarity) to 1 (for identical molecules), the ComboT score may have a value from 0 to 2 (without normalization to unity). Note that the ST, CT and ComboT scores between two molecules can be evaluated in two different molecular superpositions: (1) in the ST- or shape-optimized superpositions, and (2) in the CT- or feature-optimization superpositions. In the ST-optimization approach, the shape overlap between the molecules (that is, the ST score) are maximized and the single-point CT score is evaluated at that superposition. On the contrary, the CT-optimization considers both ST and CT scores to find the best superposition between molecules, and the single-point ST score is computed at that superposition.
The 3-D similarity method used in PubChem requires the 3-D structures of molecules. PubChem generates a conformer ensemble containing up to 500 conformers for each compound that satisfy the following conditions15-17:
- Not too big or too flexible (with £ 50 non-hydrogen atoms and ≤ 15 rotatable bonds).
- Have only a single covalent unit (i.e., not a salt or a mixture).
- Consist of only supported elements (H, C, N, O, F, Si, P, S, Cl, Br, and I).
- Contain only atom types recognized by the MMFF94s force field.
- Fewer than six undefined atom or bond stereo centers.
About 90% of compounds in PubChem have computationally generated conformer models. Although each compound has up to 500 conformers (depending on the molecular size and flexibility), many PubChem tools and services support up to 10 conformers per compound. It should be emphasized that these conformers are not energy-minimized but sampled from the conformational space of a given molecule in such a way that the sampled conformers represent the overall diversity of shape and feature of the molecule.15-17 These conformer models aim to generate bioactive conformers, which would be found in protein-ligand complexes. For this reason, these conformers are often very different from their experimental structures determined in the gas phase.
2. PUBCHEM TOOL FOR STRUCTURE ANALYSIS
Cluster analysis or clustering18 divides a set of objects into groups (called clusters) so that the objects within a cluster are more similar to each other than to those in other clusters. While cluster analysis is widely used in many areas, its most common application in Cheminformatics is to grouping compounds according to their similarity in structures, molecular properties, biological activities or combinations of these. Because the similarity between molecules can be quantified in many different ways (as mentioned in the previous section), the result of clustering a set of compounds also depends upon how similarity among them are quantified. PubChem provides two web-based tools that allow users to perform a cluster analysis of PubChem data: the Structure Clustering tool and Structure-Activity Relationship (SAR) Analysis tool.
2.1. The Structure Clustering tool
PubChem’s structure clustering tool is available at this URL:
https://pubchem.ncbi.nlm.nih.gov/assay/assay.cgi?p=clustering
This tool allows users to cluster compounds based on PubChem 2-D or 3-D similarity and visualize the clusters in a dendrogram.19 The input compound list may be provided using a string, a text file, or Entrez history. The Structure Clustering tool computes similarity scores among the input compounds, which are subsequently used to cluster them through the single-linkage clustering algorithm20. These similarity scores can be downloaded in the .csv (comma-separated values) format, which may be open in a spreadsheet program (such as MS Excel or GoogleSheet). The thumbnail images of the compounds may be displayed next to the dendrogram, which help users visually inspect the structural similarity among them. The clustering threshold may be adjusted by clicking an appropriate position on the similarity score axis (the horizontal line above/below the dendrogram).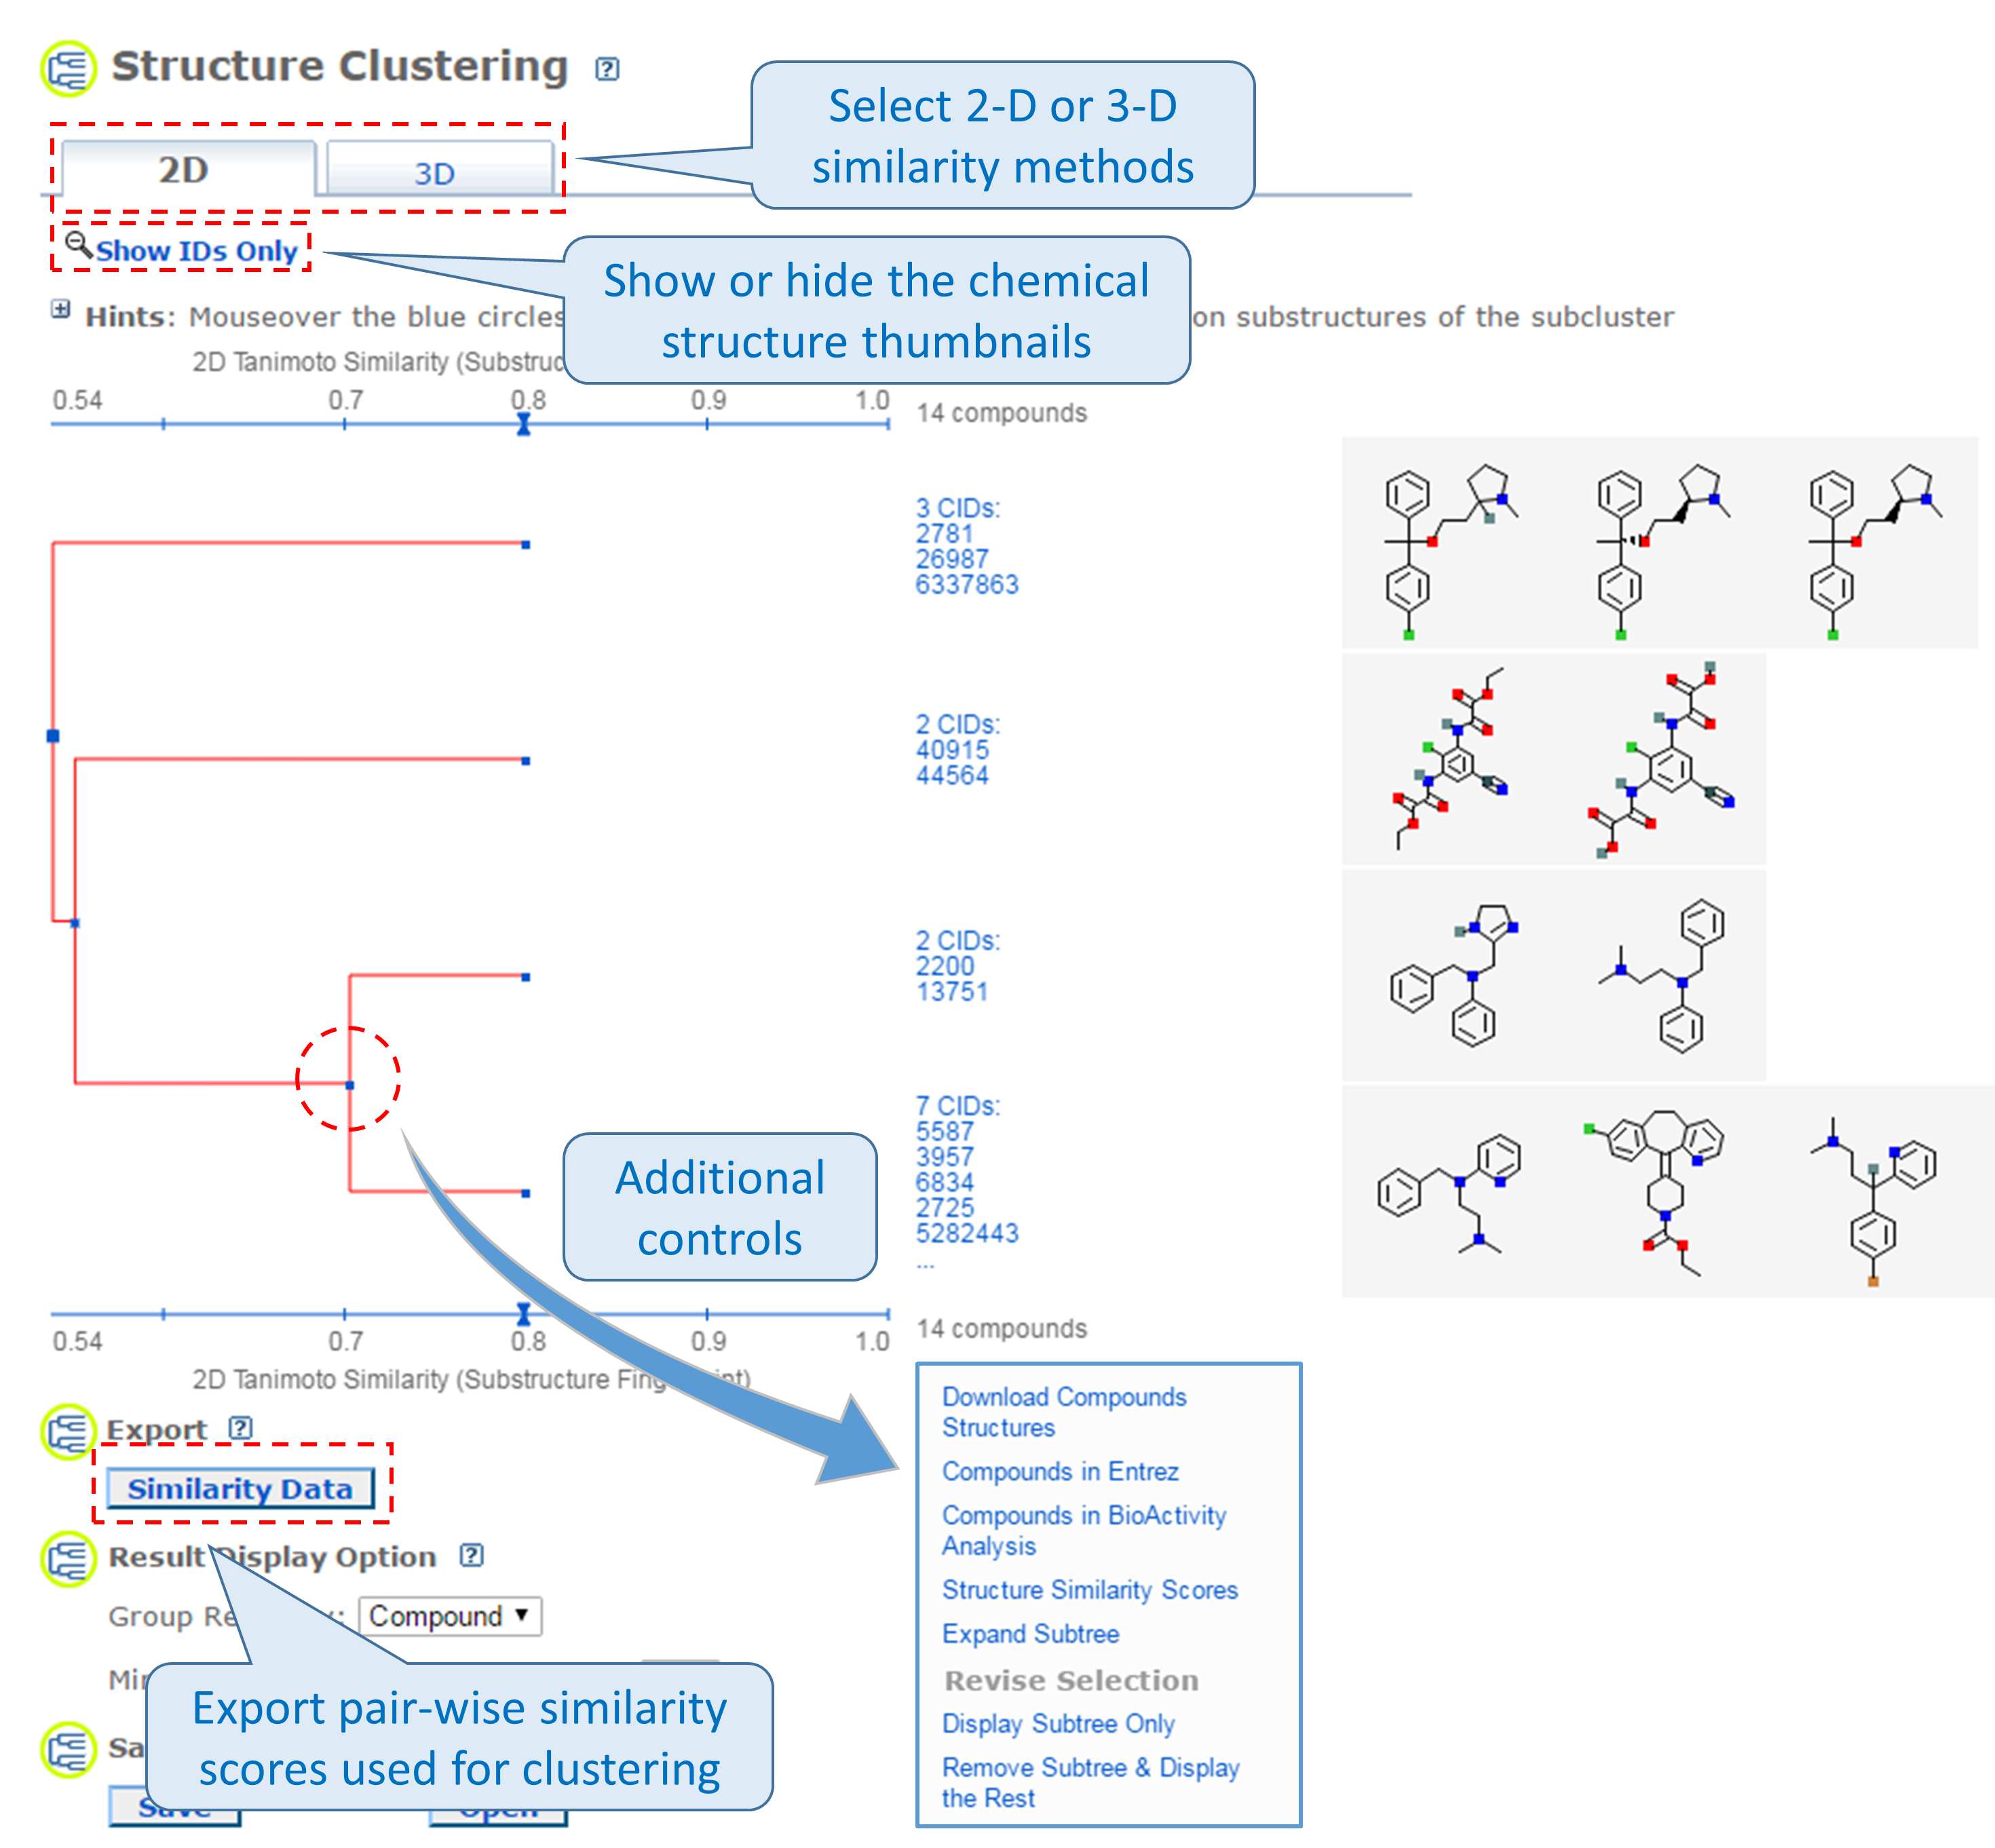
2.2. The Structure-Activity Relationship (SAR) Analysis tool
PubChem also provides the Structure-Activity Relationship (SAR) Analysis tool, available at the following URL:
https://pubchem.ncbi.nlm.nih.gov/assay/assay.cgi?p=heat
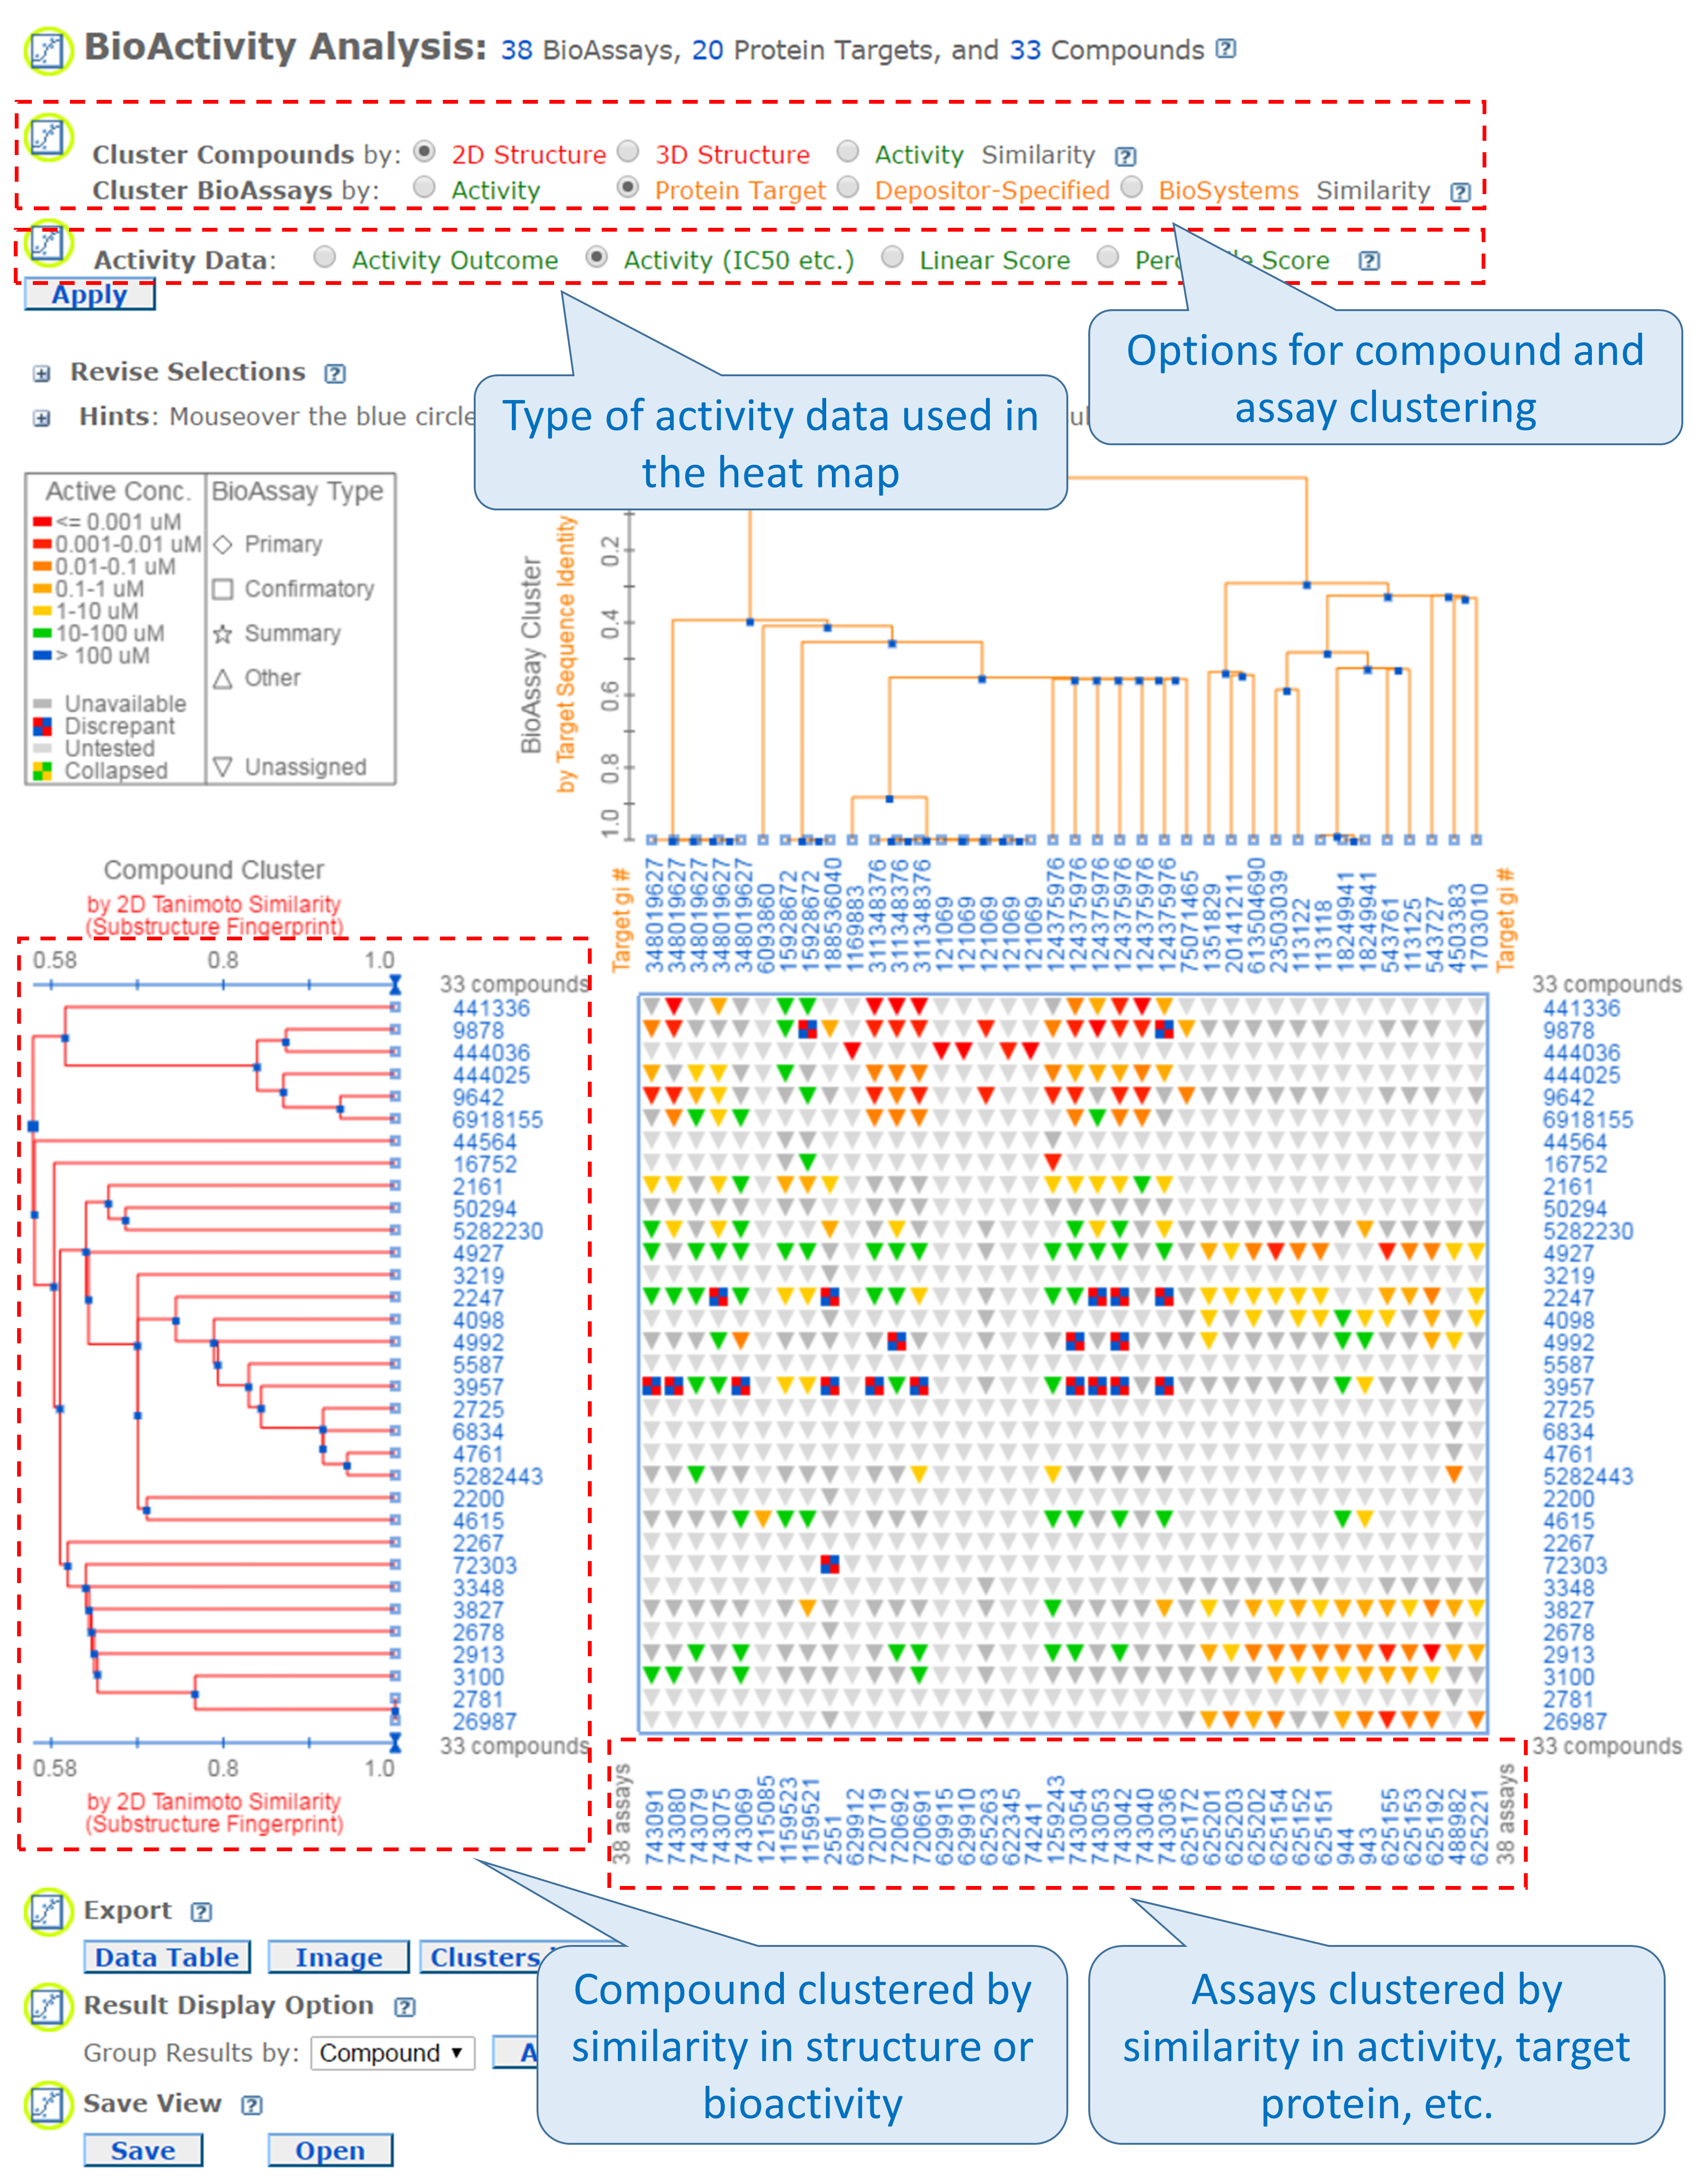
It presents biological activity data in a heat map-style layout,21 in which the rows and columns correspond to the compounds and the assays being considered. The compounds may be clustered by (either 2-D or 3-D) structural similarity or bioactivity similarity, and the assays may be clustered by similarity in the activity of tested compounds, target protein, depositor-specified related bioassays, or biosystems with the input assays. Essentially, this tool displays the bioactivity data along with the clustering results of the compounds and the assays in which they are tested. The SAR analysis tool helps users determine the common structural factor(s) among compounds that have similar biological activities against the target protein.
Questions
- To perform an identity search for Cymbalta (CID 60835), go to the Chemical Structure Search page (https://pubchem.ncbi.nlm.nih.gov/search/search.cgi) and select the “Identity/Similarity” tab. Expand the “Options” section by clicking the “plus” button and select the “Identical Structures” with “same connectivity” from the drop-down menus. Expand the Filters section and limit the number of covalent units to 1 (by setting the range to “from 1 to 1”). Provide the query CID in the search box and run the search. Repeat the search with the “same isotopical labels” option selected. Explain how the two different options affect the identity search results.
- Perform a 2-D similarity search using CID 5090 as a query. Select the “Identity/Similarity” tab and expand the Options sections by clicking the “plus” button next to the “Options” section heading. Select the “Similar Structures” and “95%” from the drop-down menus. Expand the Filters section and limit the number of covalent units to
- Provide the CID query in the search box and press the “search” button. Repeat the search with the following similarity search threshold: 90%, 85%, and 80%.
- How many records are returned for each search?
- The right column of the last search result page (for threshold >= 80%) shows what kind of information is available for the returned compounds. Click the “Pharmacological Actions” link under “BioMedical Annotation” to choose the compounds with the Pharmacological Action annotations. For each compound, check the information under the “Pharmacology and Biochemistry” section. What pharmacological actions do these compounds have?
- Select the “3D Conformer” tab to perform a 3-D similarity search using CID 5090 as a query. Expand the Options section and select the “(Sort results by) Shape-then-feature” and “(output to) NCBI Entrez” options from the drop-down menus. Expand the Filters section and limit the covalent unit count to 1. Type the query CID in the search box and press the “search” button. How many compounds are returned? How many CIDs have pharmacological action annotations. Compare the results from 3-D similarity search with those from 2-D similarity search.
- In this question, you will learn how to explore PubChem’s bioactivity data.
- Search the PubChem Compound database for seretide, without any Entrez index specified. Initially, you will get more than a thousand compounds because the auto-correction functionality of the search system will modify the query to “selenide”. Make sure that you search for “seretide”, by clicking “seretide” in the message “Search instead for seretide” presented at the top of the DocSum page. How many compounds are retrieved? What are their CIDs?
- Go to the Compound Summary page for each compound in (a) and retrieve its component compounds by clicking the “Mixtures, Components, and Neutralized Forms” item in the “Related Compounds” section. What are the CIDs for the component compounds for each compound in (a).
- What is the common component that appears in all compounds retrieved in (a)? What are the non-common components that occur in only one of the compound in (a)? What is the difference between the non-common components of the compounds in (a)
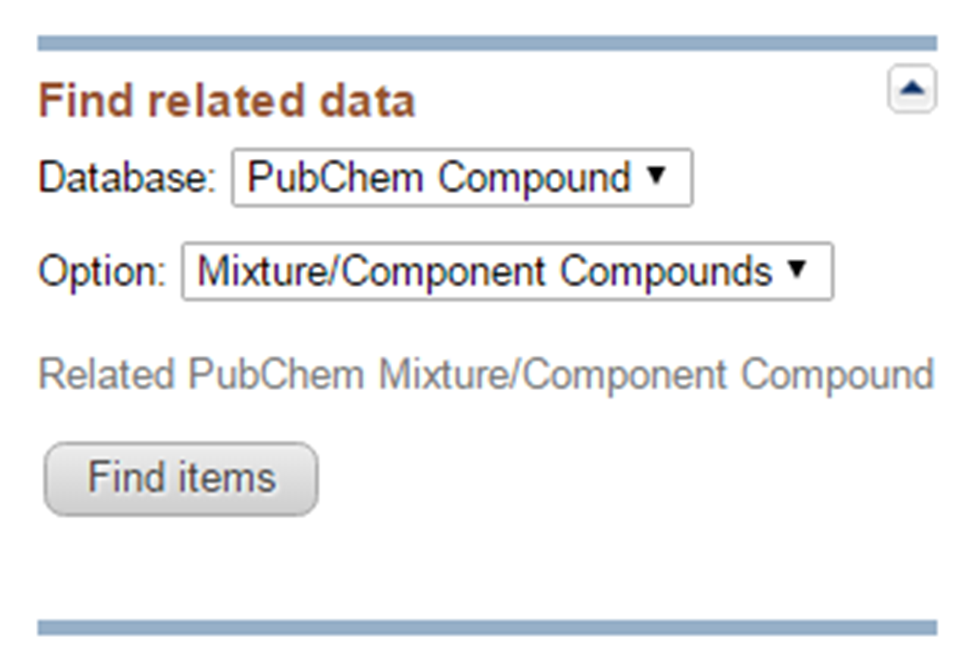
- Go back to the DocSum page for the search for “seretide”, and retrieve their component compounds by selecting “PubChem Compound” -> “Mixture/Component Compounds” from the drop-down menu under the “Find Related Data” on the right column. This directs you to the DocSum page that presents all components you retrieved in (b). Refine the list by selecting only those with pharmacological actions annotations (available under the Biomedical annotation on the right column). What are the CIDs of these compounds? What are the names of these compounds used as the titles of their Compound Summary page?
- For each compound in (d), go to the “Pharmacology” section of its Compound Summary page and find the target receptor to which the compound bind
- Find compounds that are more potent than the compounds in (d) against the same targets, using the following steps:
- For each compound in (d), go to the “BioAssay result” section of its Compound Summary page. This section displays bioactivity data for the compound in a tabular format. Click the “Refine/Analyze” button above the top-right corner of the table to go to the Bioactivity analysis tool. This directs you to the page that allows you to filter the bioactivity data by various criteria. How many targets has this compound been tested to be active against? [It’s mentioned at the top of the page.]
- For each compound in (d), go to the “BioAssay result” section of its Compound Summary page. This section displays bioactivity data for the compound in a tabular format. Click the “Refine/Analyze” button above the top-right corner of the table to go to the Bioactivity analysis tool. This directs you to the page that allows you to filter the bioactivity data by various criteria. How many targets has this compound been tested to be active against? [It’s mentioned at the top of the page.]
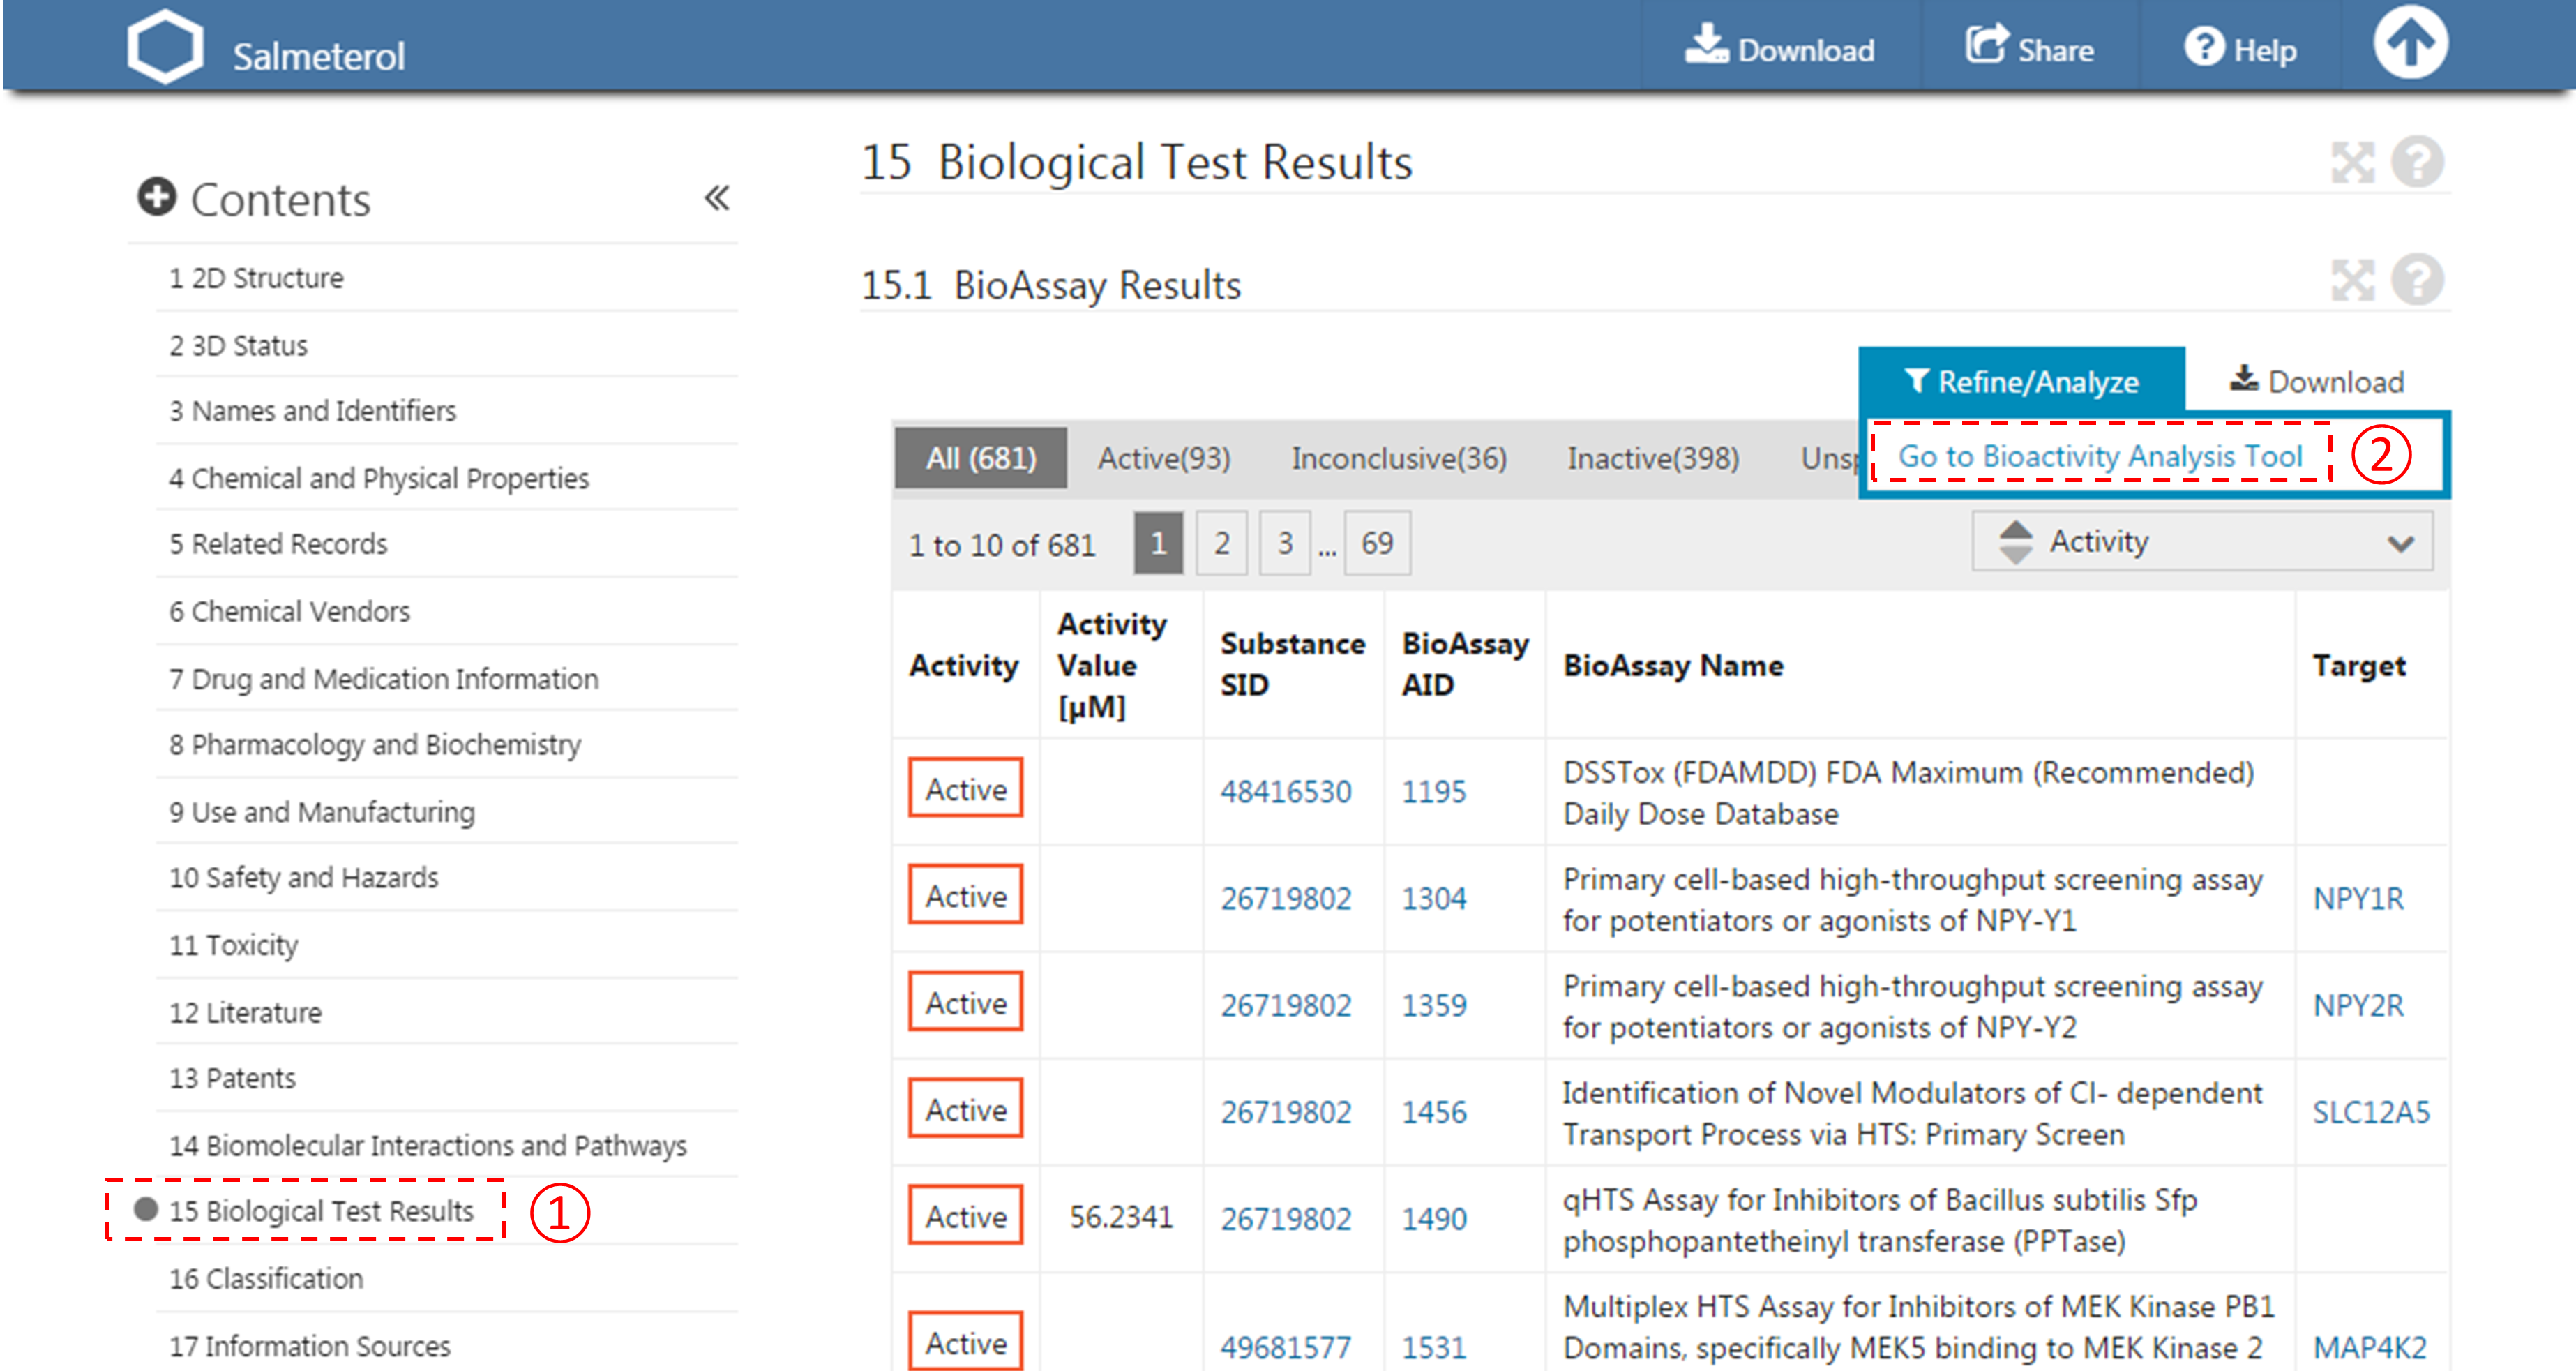
- Filter the bioactivity data by selecting “active” for the bioactivity outcome and “EC50” for the BioActivity types. Sort the table by EC50 value in ascending order. What is the target name and accession for the bioactivity data that appear at the top of the sorted list (that is, the target of the compound with the smallest EC50 value)?
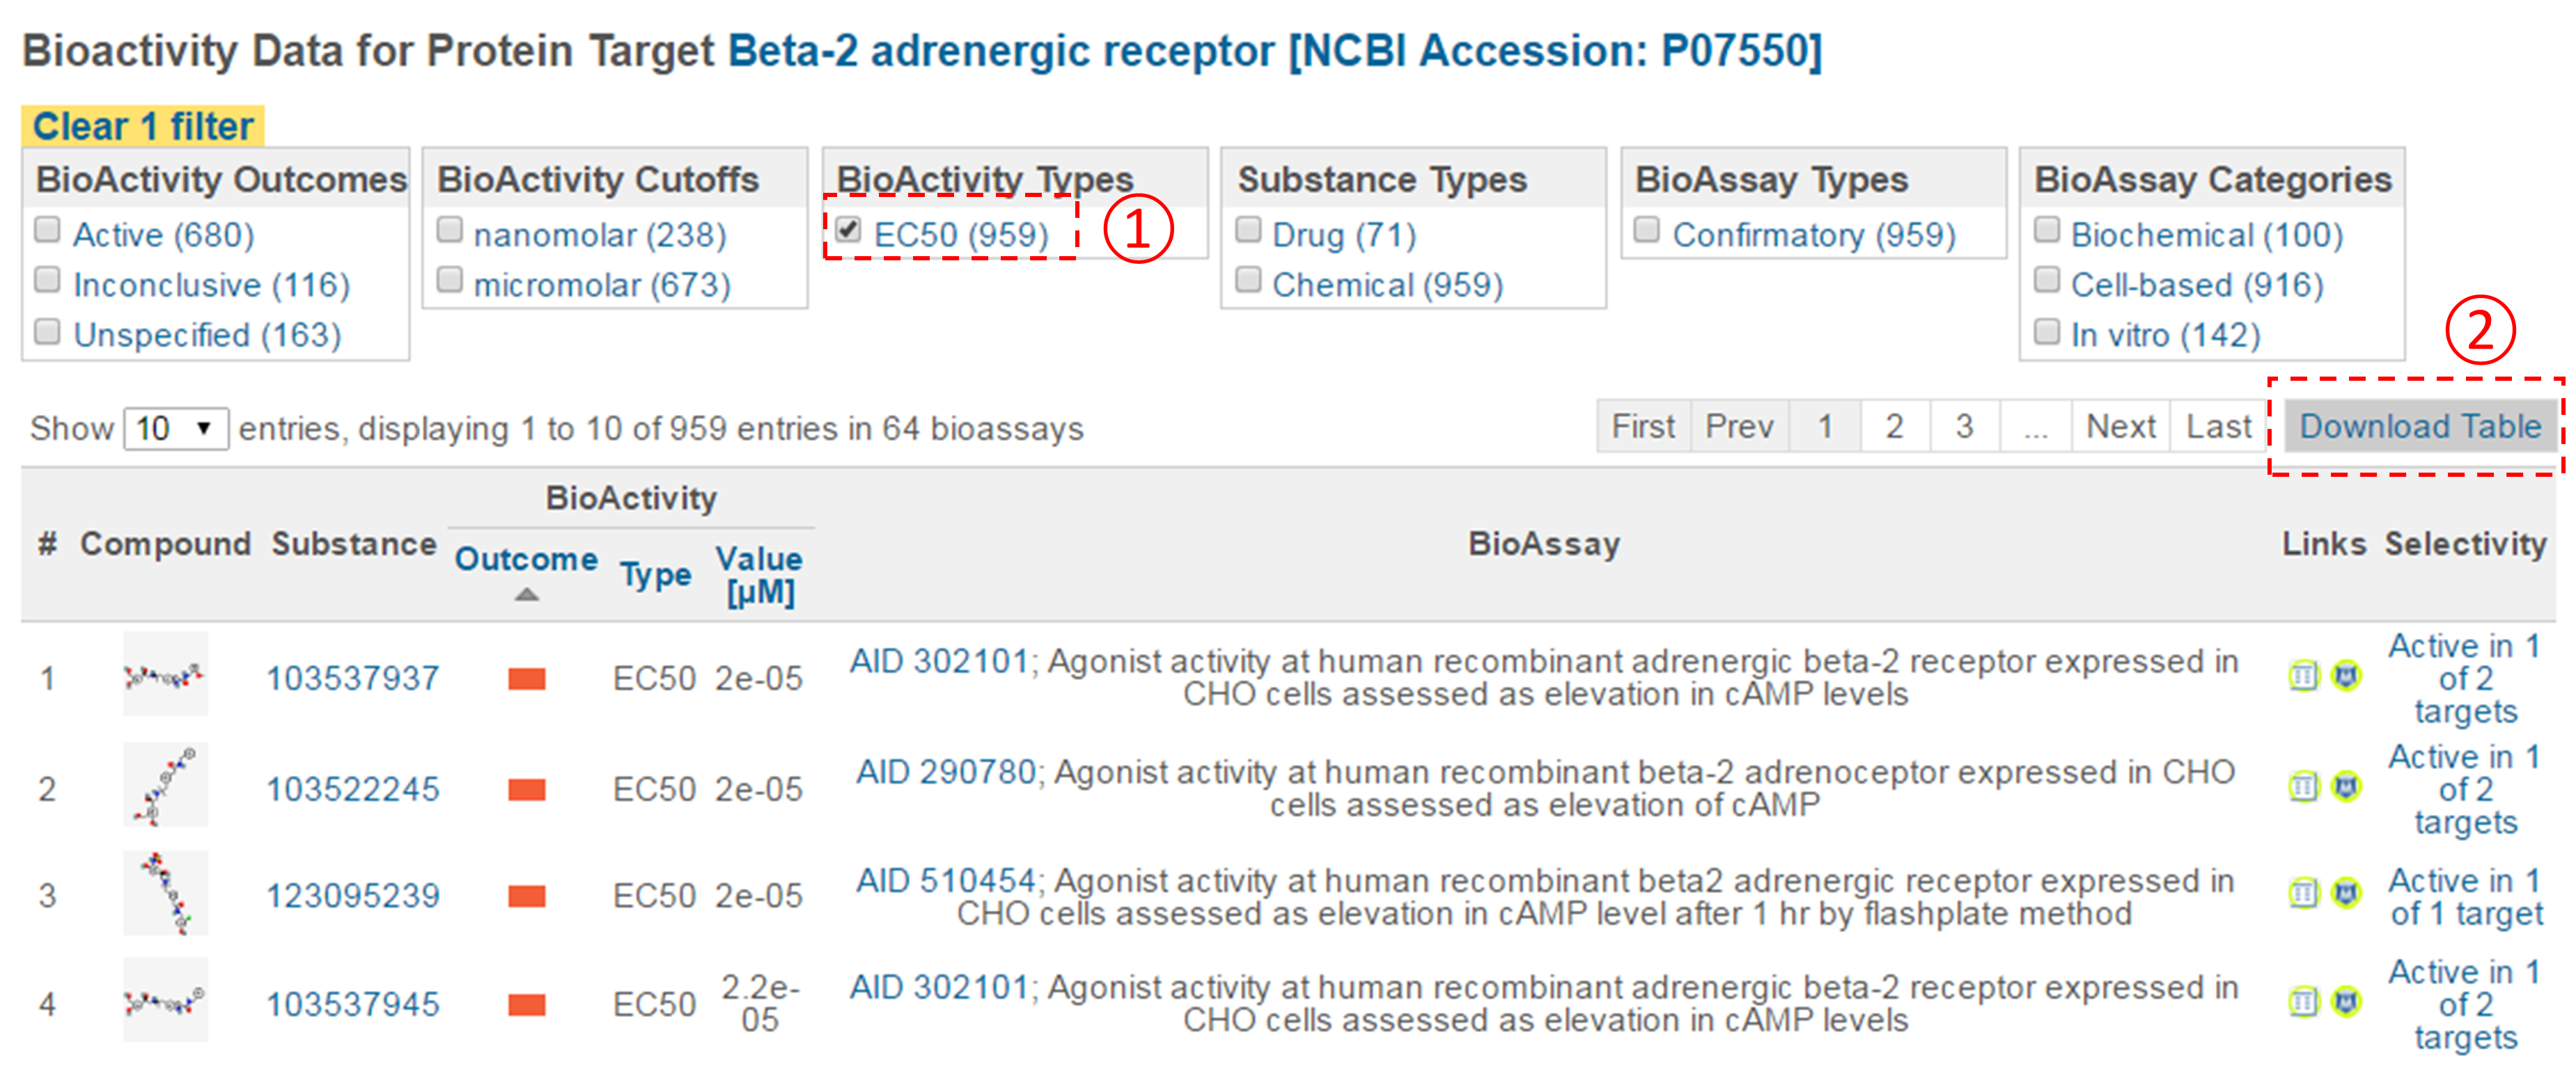
- Click the accession number of the target in (ii) to go to the page that presents all bioactivity data against the target. Filter the data by selecting “EC50” for the bioactivity type, and click the “Download Table” button at the top-right corner of the table to download the selected data in a tab-delimited txt file. Open this file in Excel (or Google Sheet) and sort the table by AC value in ascending order (from smallest to largest). How many compounds are more potent than the CID in (d) (that is, those with smaller EC50 values)? [Note that a compound may have multiple EC50 values determined from different experiments (likely under different experimental conditions). Therefore, one often needs to check all available experimental values to choose the most reasonable value to use in subsequent analysis. In this homework question, use the smallest EC50 value (for simplicity) if there are multiple values.]
- This question is designed to help you understand how various tools in PubChem can be used together to analyze the bioactivity data of a group of chemicals.
- Go to the Classification Browser (https://pubchem.ncbi.nlm.nih.gov/classification) and select “MeSH” for classification, “Compound” for data type counts to display, and “No” for whether to display zero count nodes. Then select the Anti-allegic agent node from the MeSH tree (by clicking Chemical and Drug Category → Chemical Actions and Use → Pharmacological Actions → Therapeutic Uses → Anti-allergic agent). How many compounds do you get?
- Some of the compounds retrieved in (a) contain active drug ingredients as well as their salt and mixtures. For simplicity, limit the search only to monomeric, neutral molecules without minor isotopes by combining the retrieved search results [from (a)] with the following Entrez indices:
- 1:1[CovalentUnitCount]
- 0:0[IsotopeAtomCount]
- 0:0[TotalFormalCharge]
How many compounds do you get?
- Click the “Structure Clustering” button near the top of the right column, to get the dendrogram that shows the compounds in (b) clustered into small groups at the clustering threshold of 0.9 (in terms of PubChem 2-D similarity). Click the “Show 2D thumbnails” button under the “2D/3D” tabs to show the 2-D images of the molecules next to the dendrogram. Click the midpoint (~0.65, not necessarily exact) between 0.6 and 0.7 on the similarity score axis (the horizontal line above/below the dendrogram).
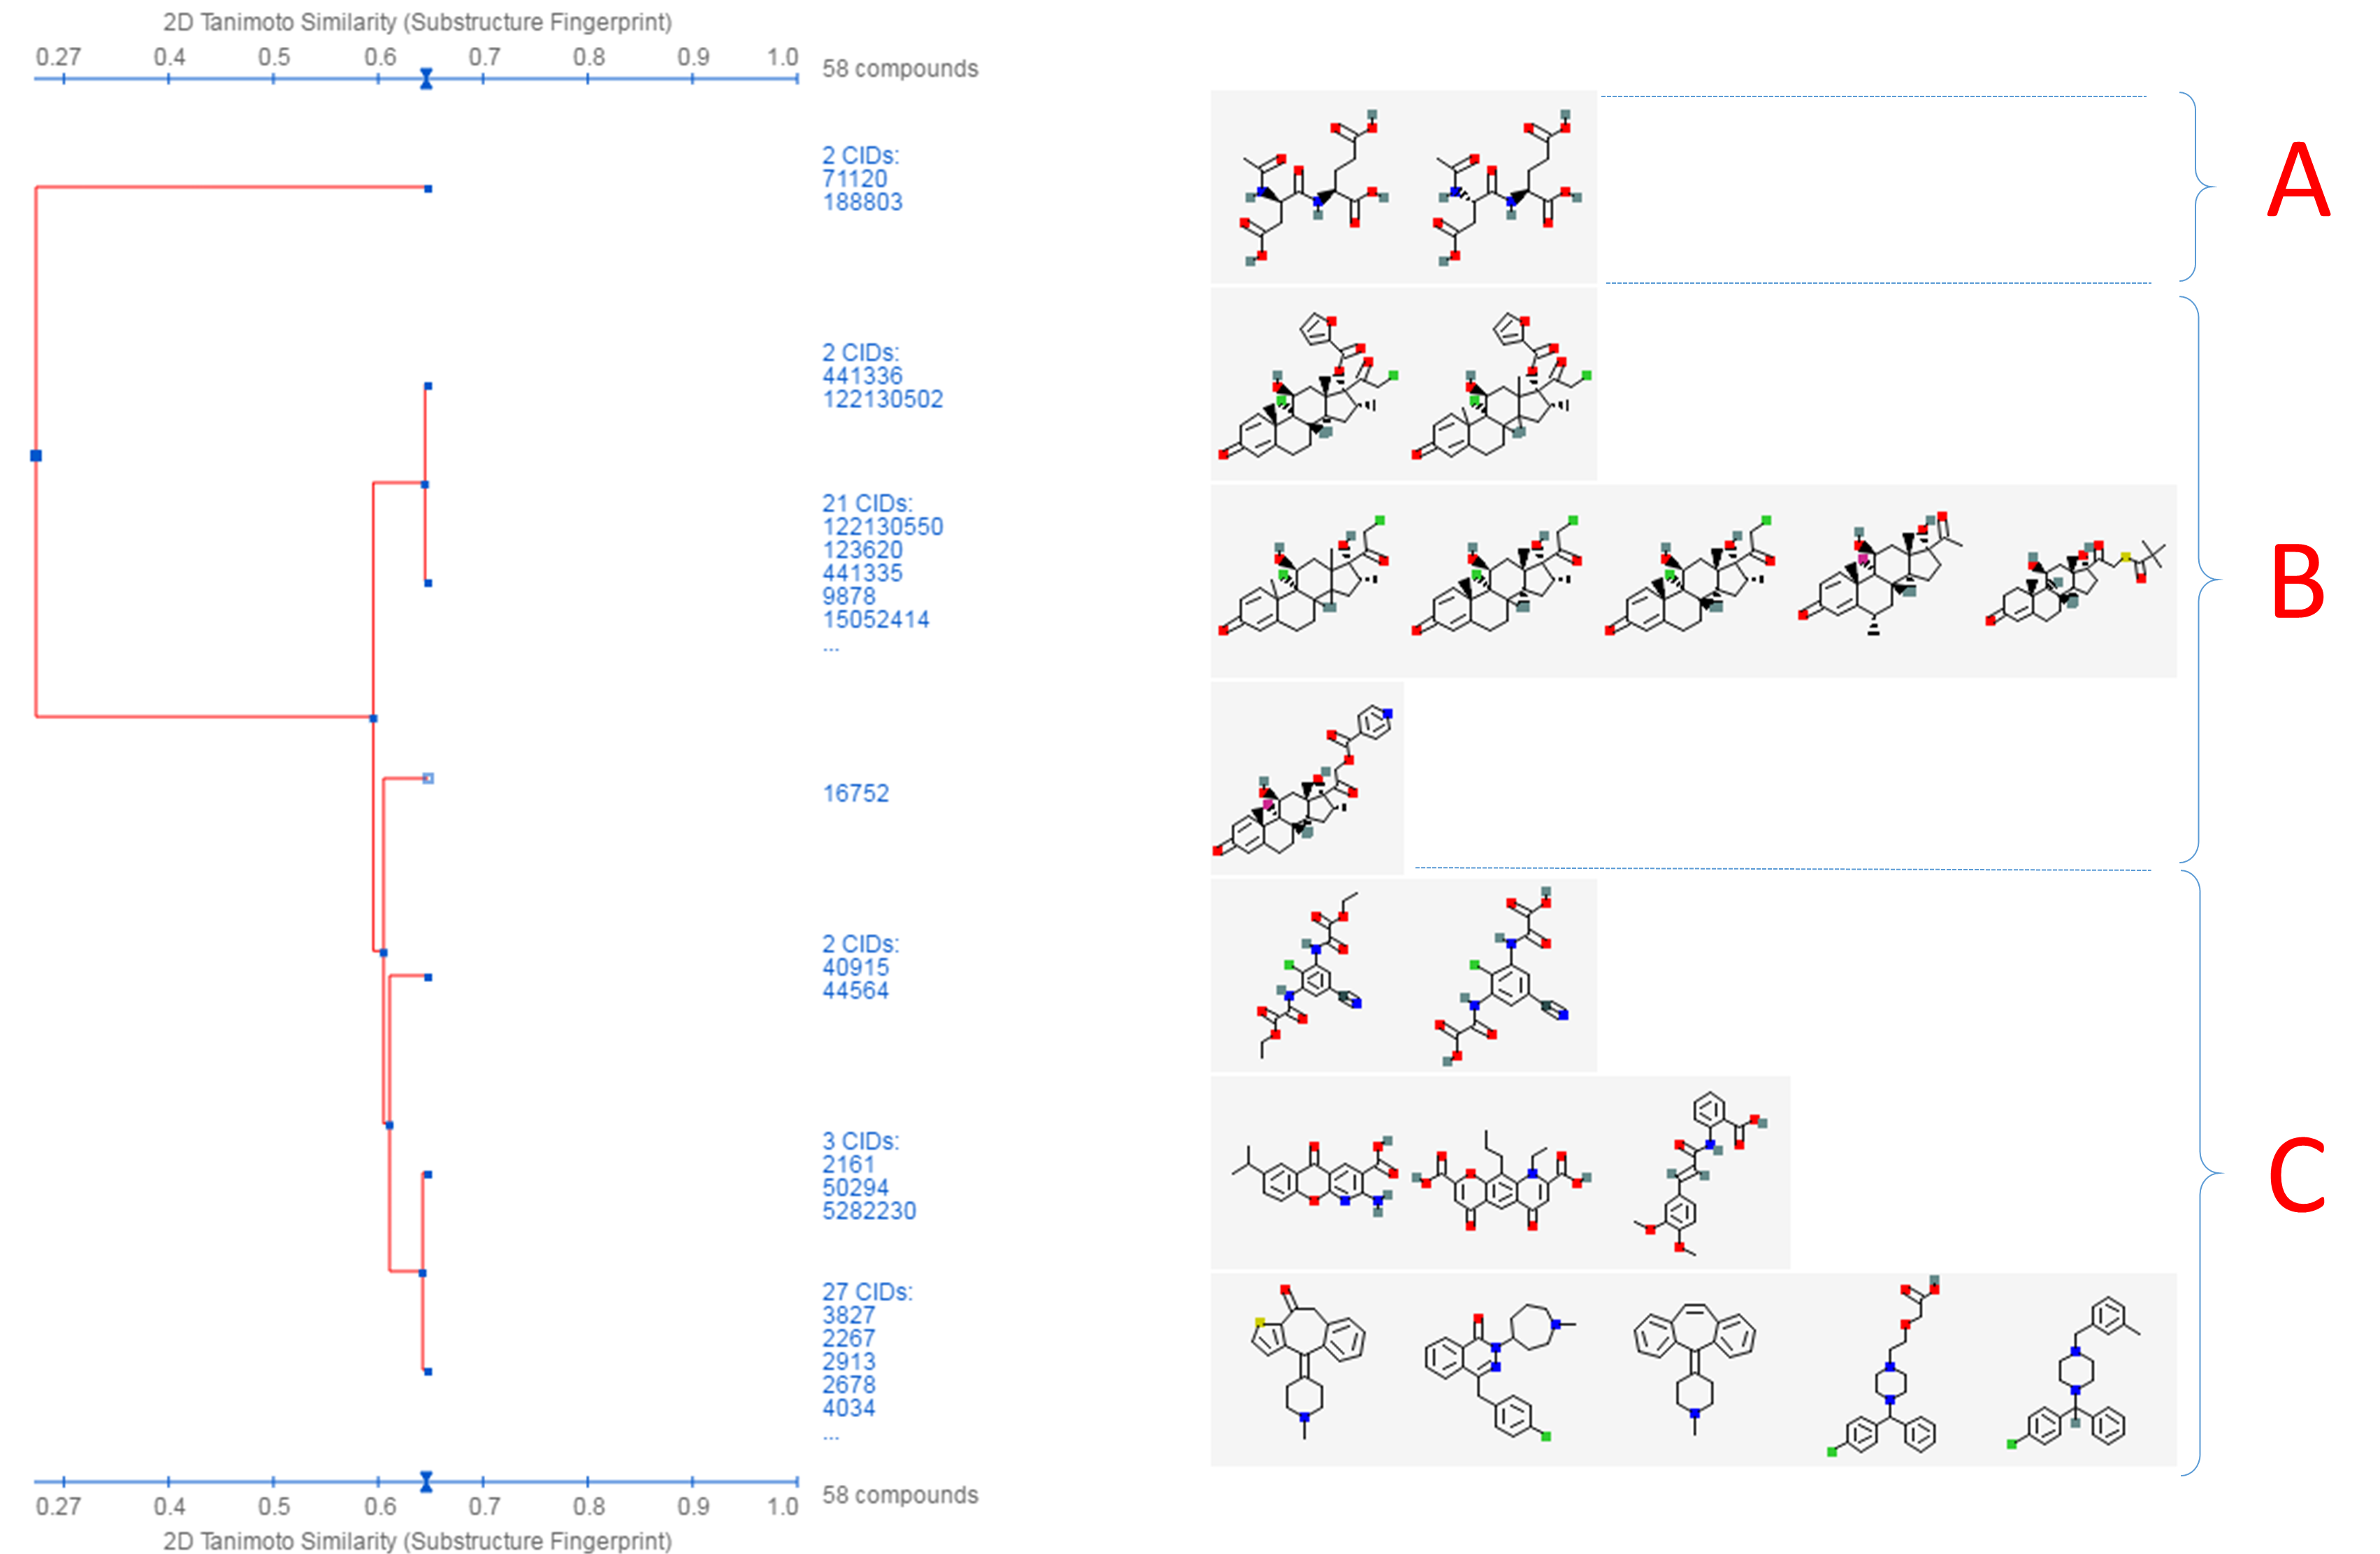
- From the dendrogram, you can see that the compounds can be classified roughly into three groups. Group A has two compounds, CIDs 71120 and 188803. These are “dipeptides”, which have two amino acids connected with a peptide bond. For convenience, duplicate this web page in a new window to avoid generating the page again. Click the blue circle on the node (on the dendrogram) that corresponds to group A, and then “Compounds in Entrez”. Go to the Compound Summary pages of these compounds and find their IUPAC-condensed biologic line notations and record them below. What are the relationship between these two compounds?
- Go back to the dendrogram page and duplicate it again in a new window. Group B includes 24 compounds. Click the parent node of the two biggest clusters (with 21 CIDs & 2 CIDs, respectively), and then the “Compounds in Entrez” link to go to the DocSum page that presents the 23 CIDs. Click “All 5 pharmacological actions” under the BioMedical annotation section on the right column. What are the five pharmacological actions associated with at least one of these 23 compounds? Provide a short description about each pharmacological action (you can copy and paste the descriptions presented on the MeSH DocSum page).
- Go back to the dendrogram page and duplicate it again in a new window. Click the parent node of all clusters containing the Group C compounds. (32 CIDs) and then the “Display Subtree Only” link to present only the 32 CIDs on the dendrogram. Click the “Export Similarity Data” below the dendrogram (near the bottom of the page) to download (in .csv format) the 2-D similarity scores among the 32 compounds used to generate the dendrogram. Click the 3-D button of the dendrogram to generate a new dendrogram using 3-D similarity scores. Download the 3-D similarity scores by clicking the Export Similarity Data” button below the dendrogram. After opening the two downloaded score files in Excel or Google Sheet, compute the difference between the 2-D and 3-D similarity scores for each CID pair, using the following equation:
\[Δ = (3-D score) / 2 – (2-D score).\]
Note that the 3-D similarity score is divided by 2, because it ranges from 0 to 2, while a 2-D similarity score can range from 0 to 1. Report the CID pair with the smallest Δ value (which means that the pair has a small 2-D score but a large 3-D score). Also report the CID pair with the largest Δ value (which has a large 2-D score, but a small 3-D score).
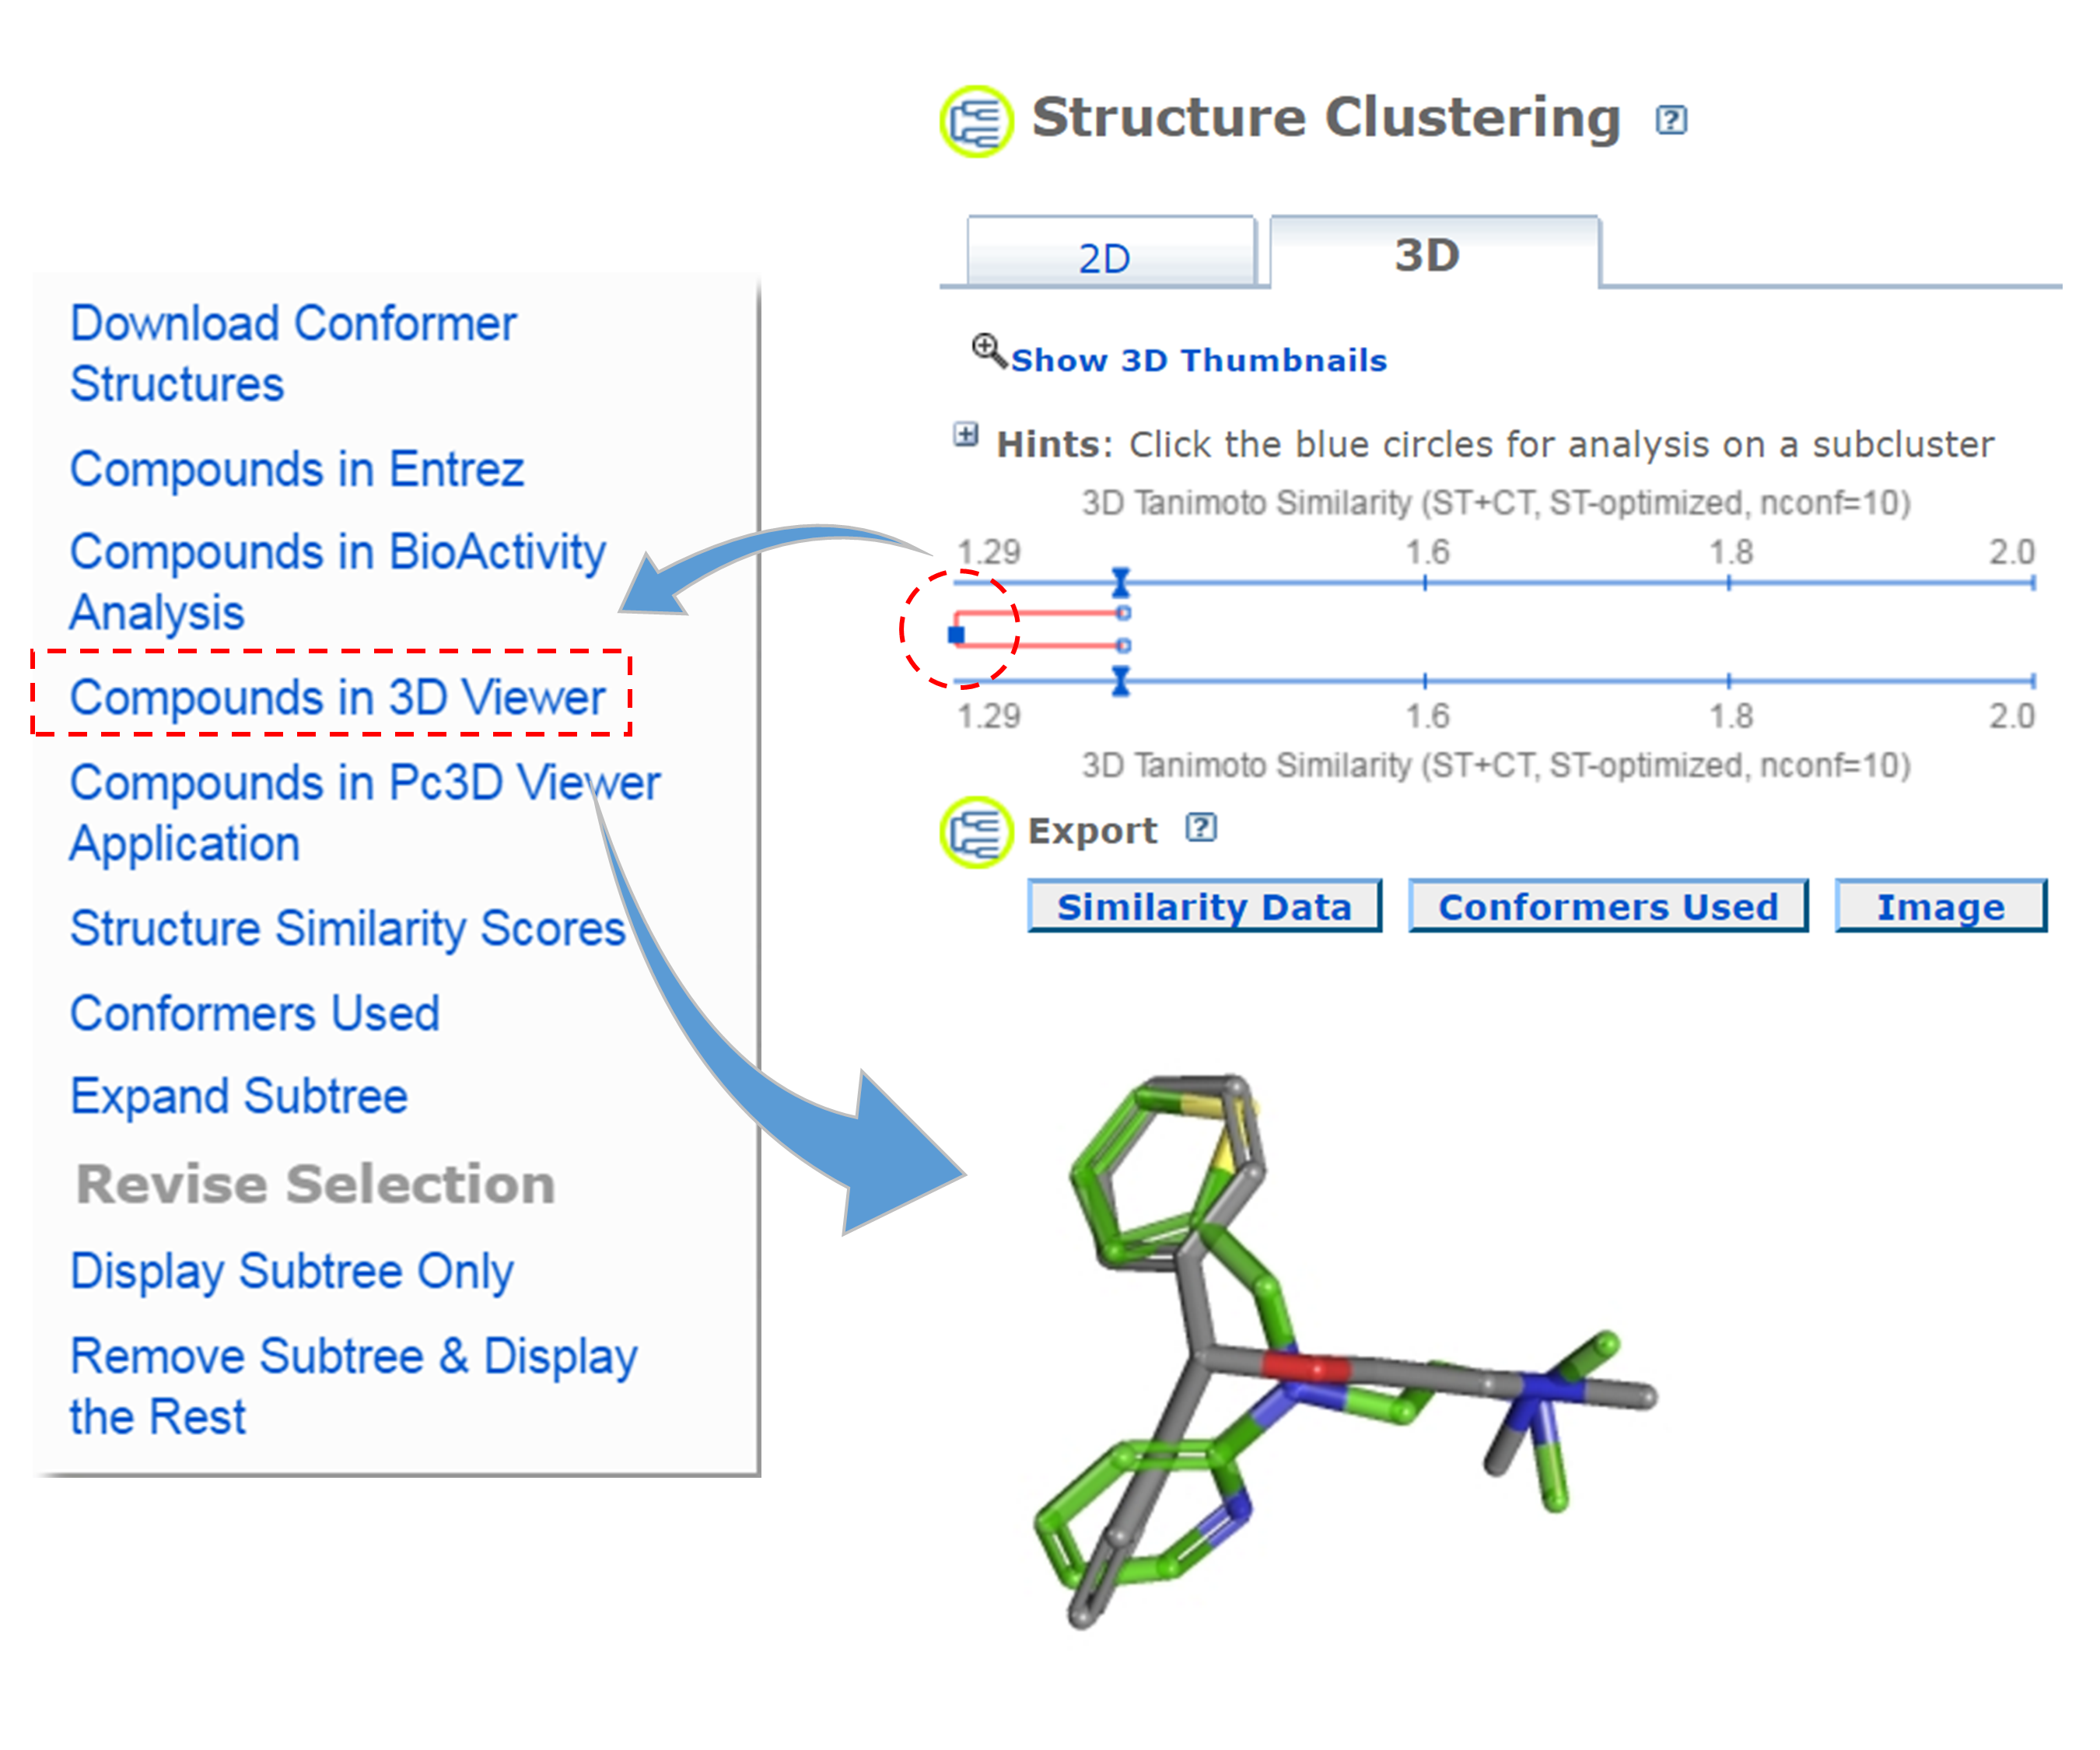
(CID1, CID2) 2-D score 3-D score Δ[= (3D/2) - 2D] - Go to the PubChem home page (https://pubchem.ncbi.nlm.nih.gov) and click the “Structure Clustering” button available on the right column. Using the CIDs from (iii) as inputs to the Structure Clustering tool, generate a dendrogram based on 3-D similarity score. Clicking the node for the cluster that contains the CID pair from (iii) and then “Compounds in 3D Viewer” to visualize the 3-D superposition of the two compounds. Briefly describe the complementarity between 2-D and 3-D similarity methods, using the conformer pairs from (iii) as an example.
- Go back to the search result page from (b). Through “Find Related Data”, retrieve assays in which any molecules being considered are found to have a submicromolar potency. The retrieved AIDs may or may not have protein target information (for example, for some assays performed on whole cells or organisms without specific target macromolecules). Select those with the target information by clicking “Proteins” under the “Targets” part of the “Refine your results” section at the top of the right column.
- Go to the PubChem home page and then click the “BioAssay Tools” -> “SAR” buttons on the right column. Select the compound search history from (b) and the assay search history from (d) as input CIDs and AIDs. Then click the “Go” button. When a heat map of the bioactivity data is displayed, select “Protein target” similarity for “Cluster BioAssays by” and “Activity (IC50 etc.)” for “Activity Data” and click the “Apply” button. The rows of the heat map correspond to tested compounds and the columns represent the proteins against which the compounds were tested. The legend near the top-left corner of the heat map explains how bioactivity data are color-coded. (Basically, red/orange mean “strong activity against the target” against the target, and green/blue mean “weak activity against the target”. Grey means no data available or not tested.) Answer the following questions.
- Many anti-allergic drugs are classified as anti-histamines because they opposes the activity of histamine receptors. From the heat map, find the region that show bioactivity data against histamine receptors. How many blue or green cells exist in this region of the heat map?
- About 25% of compounds displayed in the heat map do not have bioactivity data against histamine receptors. What compound group [from (c)] do these compounds belong to?
- From the heat map, find the high-activity cells (red/orange regions) for the compounds in (ii) against the protein GIs (numeric identifiers presented at the top axis of the heat map) listed in the table below and record the names of the proteins.
GI
Protein name
348019672
311348376
124375976
- Search the web for one known endogenous ligand (as an example) for each protein in (iii), and provide the structure below (you are allowed to copy and paste the images of the ligands).
- Explain why compounds in (ii) have strong activities against the proteins in (iii).
- Neutrotransmitter receptors (such as adrenergic receptors, dopamine receptors, serotonin receptors, and muscarinic acetylcholine receptors) play an important role in the central nervous system. Among the three compound groups in (c), which one shows a strong activity against these receptors?
- Read the first paragraph of this Wikipedia article about hERG protein (https://en.wikipedia.org/wiki/HERG), and explain (in two or three sentences) what the role of this receptor is in the human body and why this target is important in drug discovery and development.
- From the heat map, find the compounds with the strongest activity against the hERG protein. What is the CID of this compound? Go to the Compound Summary page of this compound and review the information in the “7. Drug and Medication Information”. Write a paragraph (of no more than 5 sentences) that includes the following information:
- CID and chemical name of this compound
- Intended uses/indications of this compound.
- Summary of adverse side effects
- Explanation of the underlying mechanism for the adverse side effects.
- Current marketing status of this compound
References
- (1) Kim, S.; Thiessen, P. A.; Bolton, E. E.; Chen, J.; Fu, G.; Gindulyte, A.; Han, L. Y.; He, J. E.; He, S. Q.; Shoemaker, B. A.; Wang, J. Y.; Yu, B.; Zhang, J.; Bryant, S. H. Nucleic Acids Res. 2016, 44, D1202.
- (2) Wang, Y.; Bryant, S. H.; Cheng, T.; Wang, J.; Gindulyte, A.; Shoemaker, B. A.; Thiessen, P. A.; He, S.; Zhang, J. Nucleic Acids Res. 2017, 45, D955.
- (3) Kim, S. Expert Opinion on Drug Discovery 2016, 11, 843.
- (4) Ihlenfeldt, W. D.; Bolton, E. E.; Bryant, S. H. J. Cheminform. 2009, 1, 20.
- (5) Concepts and Applications of Molecular Similarity; Johnson, M. A.; Maggiora, G. M., Eds.; John Wiley & Sons, Inc.: New York, NY, 1990.
- (6) Chen, X.; Reynolds, C. H. J. Chem. Inf. Comput. Sci. 2002, 42, 1407.
- (7) Holliday, J. D.; Hu, C. Y.; Willett, P. Combinatorial Chemistry & High Throughput Screening 2002, 5, 155.
- (8) Holliday, J. D.; Salim, N.; Whittle, M.; Willett, P. J. Chem. Inf. Comput. Sci. 2003, 43, 819.
- (9) Grant, J. A.; Pickup, B. T. Journal of Physical Chemistry 1995, 99, 3503.
- (10) Grant, J. A.; Gallardo, M. A.; Pickup, B. T. Journal of Computational Chemistry 1996, 17, 1653.
- (11) Grant, J. A.; Pickup, B. T. Journal of Physical Chemistry 1996, 100, 2456.
- (12) Grant, J. A.; Pickup, B. T. In Computer Simulation of Biomolecular Systems; van Gunsteren, W. F., Weiner, P. K., Wilkinson, A. J., Eds.; Kluwer Academic Publishers: Dordrecht, 1997, p 150.
- (13) Rush, T. S.; Grant, J. A.; Mosyak, L.; Nicholls, A. Journal of Medicinal Chemistry 2005, 48, 1489.
- (14) 3.1.0 ed.; OpenEye Scientific Software, Inc.: Santa Fe, NM, 2010.
- (15) Bolton, E. E.; Chen, J.; Kim, S.; Han, L. Y.; He, S. Q.; Shi, W. Y.; Simonyan, V.; Sun, Y.; Thiessen, P. A.; Wang, J. Y.; Yu, B.; Zhang, J.; Bryant, S. H. J. Cheminform. 2011, 3, 32.
- (16) Bolton, E. E.; Kim, S.; Bryant, S. H. J. Cheminform. 2011, 3, 4.
- (17) Kim, S.; Bolton, E. E.; Bryant, S. H. J. Cheminform. 2013, 5, 1.
- (18) Cluster analysis (https://en.wikipedia.org/wiki/Cluster_analysis) (Accessed on March 10, 2017).
- (19) Dendrogram (https://en.wikipedia.org/wiki/Dendrogram) (Accessed on March 10, 2017).
- (20) Single-linkage clustering (https://en.wikipedia.org/wiki/Single-linkage_clustering) (Accessed on March 10, 2017).
- (21) Heat map (https://en.wikipedia.org/wiki/Heat_map) (Accessed on March 10, 2017).
Contributors
- Sunghwan Kim, National Center for Biotechnology Information