
9.7: Spectrophotometric Studies of Complex Ions
- Page ID
- 220473
Absorption spectroscopy is one of the most powerful methods for determining the formulas of complex ions in solution and in determining their formation constants. The only requirement is that either or both the reactant or product absorbs light or that either the reactant of product can be caused to participate in a competing equilibrium that does not produce an absorbing species.
The three most common methods employed for studies of complex ions are (1) the method of continuous variations [also called the Job’s method], (2) the mole-ratio methods, and (3) the slope-ratio method.
Method of Continuous Variations
Posted on July 29, 2013 by David Harvey on the Analytical Sciences Digital Library (asdlib.org)
The method of continuous variations, also called Job’s method, is used to determine the stoichiometry of a metal-ligand complex. In this method we prepare a series of solutions such that the total moles of metal and ligand, ntotal, in each solution is the same. If (nM)i and (nL)i are, respectively, the moles of metal and ligand in solution i, then
ntotal = (nM)i + (nL)i
The relative amount of ligand and metal in each solution is expressed as the mole fraction of ligand, (XL)i, and the mole fraction of metal, (XM)i,
(XL)i = (nL)i/ntotal
(XM)i = 1 – (nL)i/ntotal = (nM)i/ntotal
The concentration of the metal–ligand complex in any solution is determined by the limiting reagent, with the greatest concentration occurring when the metal and the ligand are mixed stoichiometrically. If we monitor the complexation reaction at a wavelength where the metal–ligand complex absorbs only, a graph of absorbance versus the mole fraction of ligand will have two linear branches—one when the ligand is the limiting reagent and a second when the metal is the limiting reagent. The intersection of these two branches represents a stoichiometric mixing of the metal and the ligand. We can use the mole fraction of ligand at the intersection to determine the value of y for the metal–ligand complex MLy.
y = (nL/nM) = (XL/XM) = (XL/1 –XM)
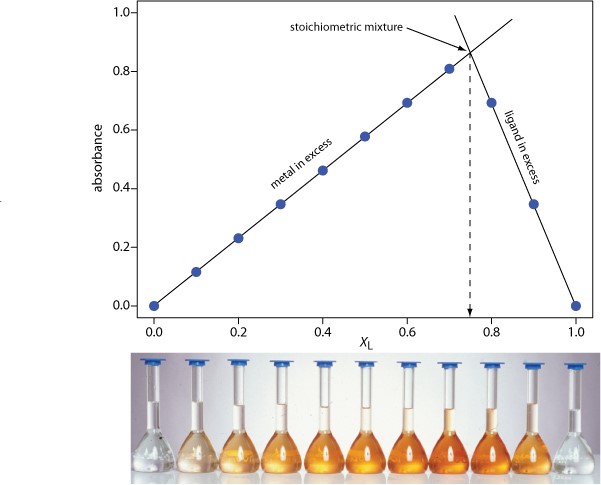
Figure\(\PageIndex {1}\): The illustration below shows a continuous variations plot for the metal–ligand complex between Fe2+ and o-phenanthroline. As shown here, the metal and ligand form the 1:3 complex Fe(o-phenanthroline)32+.
Mole-Ratio Method for Determining Metal-Ligand Stoichiometry
Posted on July 29, 2013 by David Harvey on the Analytical Sciences Digital Library (asdlib.org)
An alternative to the method of continuous variations for determining the stoichiometry of metal-ligand complexes is the mole-ratio method in which the amount of one reactant, usually the moles of metal, is held constant, while the amount of the other reactant is varied. Absorbance is monitored at a wavelength where the metal–ligand complex absorbs.
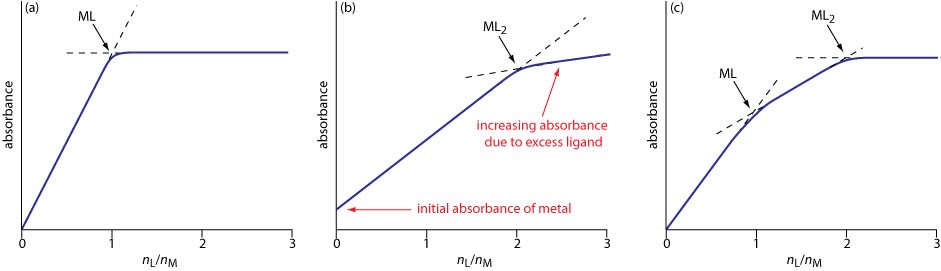
Figure\(\PageIndex {2}\): The illustrations below show typical results: (a) the mole-ratio plot for the formation of a 1:1 complex in which the absorbance is monitored at a wavelength where only the complex absorbs; (b) the mole-ratio plot for a 1:2 complex in which all three species—the metal, the ligand, and the complex—absorb at the selected wavelength; and (c) the mole-ratio plot for the step-wise formation of ML and ML2.
The Slope – Ratio Method
This method is useful for weak complexes and is applicable only to systems where a single complex is formed. The method assumes that the complex formation reaction can be forced to completion by a large excess of either the reactant metal ion or ligand and that Beer’s law is followed.
For the reaction mM + lL ⇄ MmLl
the following equation can be written, when L is present in very large excess.
[MmLl] ≈ FM/m
If Beer’ law is obeyed
Am = \({\epsilon}\)b[MmLl] = \({\epsilon}\)bFM/m
And a plot of Am with respect to FM will be linear. When M is very large with respect to L
[MmLl] ≈ FL/l
and
Al = \({\epsilon}\)b[MmLl] = \({\epsilon}\)bFL/l
A plot of Al with respect to FL will be linear. The slopes of straight line, (Am/FM) and (Al/FL) and the ratio of the slopes yields the combining ration of ligand to metal; l/m.