
8.6: Phase Diagrams
- Page ID
- 394566
\( \newcommand{\vecs}[1]{\overset { \scriptstyle \rightharpoonup} {\mathbf{#1}} } \)
\( \newcommand{\vecd}[1]{\overset{-\!-\!\rightharpoonup}{\vphantom{a}\smash {#1}}} \)
\( \newcommand{\id}{\mathrm{id}}\) \( \newcommand{\Span}{\mathrm{span}}\)
( \newcommand{\kernel}{\mathrm{null}\,}\) \( \newcommand{\range}{\mathrm{range}\,}\)
\( \newcommand{\RealPart}{\mathrm{Re}}\) \( \newcommand{\ImaginaryPart}{\mathrm{Im}}\)
\( \newcommand{\Argument}{\mathrm{Arg}}\) \( \newcommand{\norm}[1]{\| #1 \|}\)
\( \newcommand{\inner}[2]{\langle #1, #2 \rangle}\)
\( \newcommand{\Span}{\mathrm{span}}\)
\( \newcommand{\id}{\mathrm{id}}\)
\( \newcommand{\Span}{\mathrm{span}}\)
\( \newcommand{\kernel}{\mathrm{null}\,}\)
\( \newcommand{\range}{\mathrm{range}\,}\)
\( \newcommand{\RealPart}{\mathrm{Re}}\)
\( \newcommand{\ImaginaryPart}{\mathrm{Im}}\)
\( \newcommand{\Argument}{\mathrm{Arg}}\)
\( \newcommand{\norm}[1]{\| #1 \|}\)
\( \newcommand{\inner}[2]{\langle #1, #2 \rangle}\)
\( \newcommand{\Span}{\mathrm{span}}\) \( \newcommand{\AA}{\unicode[.8,0]{x212B}}\)
\( \newcommand{\vectorA}[1]{\vec{#1}} % arrow\)
\( \newcommand{\vectorAt}[1]{\vec{\text{#1}}} % arrow\)
\( \newcommand{\vectorB}[1]{\overset { \scriptstyle \rightharpoonup} {\mathbf{#1}} } \)
\( \newcommand{\vectorC}[1]{\textbf{#1}} \)
\( \newcommand{\vectorD}[1]{\overrightarrow{#1}} \)
\( \newcommand{\vectorDt}[1]{\overrightarrow{\text{#1}}} \)
\( \newcommand{\vectE}[1]{\overset{-\!-\!\rightharpoonup}{\vphantom{a}\smash{\mathbf {#1}}}} \)
\( \newcommand{\vecs}[1]{\overset { \scriptstyle \rightharpoonup} {\mathbf{#1}} } \)
\( \newcommand{\vecd}[1]{\overset{-\!-\!\rightharpoonup}{\vphantom{a}\smash {#1}}} \)
\(\newcommand{\avec}{\mathbf a}\) \(\newcommand{\bvec}{\mathbf b}\) \(\newcommand{\cvec}{\mathbf c}\) \(\newcommand{\dvec}{\mathbf d}\) \(\newcommand{\dtil}{\widetilde{\mathbf d}}\) \(\newcommand{\evec}{\mathbf e}\) \(\newcommand{\fvec}{\mathbf f}\) \(\newcommand{\nvec}{\mathbf n}\) \(\newcommand{\pvec}{\mathbf p}\) \(\newcommand{\qvec}{\mathbf q}\) \(\newcommand{\svec}{\mathbf s}\) \(\newcommand{\tvec}{\mathbf t}\) \(\newcommand{\uvec}{\mathbf u}\) \(\newcommand{\vvec}{\mathbf v}\) \(\newcommand{\wvec}{\mathbf w}\) \(\newcommand{\xvec}{\mathbf x}\) \(\newcommand{\yvec}{\mathbf y}\) \(\newcommand{\zvec}{\mathbf z}\) \(\newcommand{\rvec}{\mathbf r}\) \(\newcommand{\mvec}{\mathbf m}\) \(\newcommand{\zerovec}{\mathbf 0}\) \(\newcommand{\onevec}{\mathbf 1}\) \(\newcommand{\real}{\mathbb R}\) \(\newcommand{\twovec}[2]{\left[\begin{array}{r}#1 \\ #2 \end{array}\right]}\) \(\newcommand{\ctwovec}[2]{\left[\begin{array}{c}#1 \\ #2 \end{array}\right]}\) \(\newcommand{\threevec}[3]{\left[\begin{array}{r}#1 \\ #2 \\ #3 \end{array}\right]}\) \(\newcommand{\cthreevec}[3]{\left[\begin{array}{c}#1 \\ #2 \\ #3 \end{array}\right]}\) \(\newcommand{\fourvec}[4]{\left[\begin{array}{r}#1 \\ #2 \\ #3 \\ #4 \end{array}\right]}\) \(\newcommand{\cfourvec}[4]{\left[\begin{array}{c}#1 \\ #2 \\ #3 \\ #4 \end{array}\right]}\) \(\newcommand{\fivevec}[5]{\left[\begin{array}{r}#1 \\ #2 \\ #3 \\ #4 \\ #5 \\ \end{array}\right]}\) \(\newcommand{\cfivevec}[5]{\left[\begin{array}{c}#1 \\ #2 \\ #3 \\ #4 \\ #5 \\ \end{array}\right]}\) \(\newcommand{\mattwo}[4]{\left[\begin{array}{rr}#1 \amp #2 \\ #3 \amp #4 \\ \end{array}\right]}\) \(\newcommand{\laspan}[1]{\text{Span}\{#1\}}\) \(\newcommand{\bcal}{\cal B}\) \(\newcommand{\ccal}{\cal C}\) \(\newcommand{\scal}{\cal S}\) \(\newcommand{\wcal}{\cal W}\) \(\newcommand{\ecal}{\cal E}\) \(\newcommand{\coords}[2]{\left\{#1\right\}_{#2}}\) \(\newcommand{\gray}[1]{\color{gray}{#1}}\) \(\newcommand{\lgray}[1]{\color{lightgray}{#1}}\) \(\newcommand{\rank}{\operatorname{rank}}\) \(\newcommand{\row}{\text{Row}}\) \(\newcommand{\col}{\text{Col}}\) \(\renewcommand{\row}{\text{Row}}\) \(\newcommand{\nul}{\text{Nul}}\) \(\newcommand{\var}{\text{Var}}\) \(\newcommand{\corr}{\text{corr}}\) \(\newcommand{\len}[1]{\left|#1\right|}\) \(\newcommand{\bbar}{\overline{\bvec}}\) \(\newcommand{\bhat}{\widehat{\bvec}}\) \(\newcommand{\bperp}{\bvec^\perp}\) \(\newcommand{\xhat}{\widehat{\xvec}}\) \(\newcommand{\vhat}{\widehat{\vvec}}\) \(\newcommand{\uhat}{\widehat{\uvec}}\) \(\newcommand{\what}{\widehat{\wvec}}\) \(\newcommand{\Sighat}{\widehat{\Sigma}}\) \(\newcommand{\lt}{<}\) \(\newcommand{\gt}{>}\) \(\newcommand{\amp}{&}\) \(\definecolor{fillinmathshade}{gray}{0.9}\)- Describe phase diagrams.
- Identify the phase or phase change of a substance using a phase diagram.
Many rockets use a combination of kerosene and liquid oxygen for their fuel. Oxygen can be reduced to the liquid state either by cooling or by using high pressure. In the case of a rocket, since the oxygen is in a container essentially out in the open, maintaining a temperature of \(-183^\text{o} \text{C}\) (the boiling point of oxygen) is not very practical. However, high pressure can be used to force the oxygen into tanks, causing it to liquefy so that it can mix with the kerosene, and provide a powerful ignition to move the rocket.
Phase Diagrams
The relationship among the solid, liquid, and vapor (gas) states of a substance can be shown as a function of temperature and pressure in a single diagram. A phase diagram is graph showing the conditions of temperature and pressure under which a substance exists in the solid, liquid, and gas phases. Examine the general phase diagram shown in the figure below. In each of the three colored regions of the diagram, the substance is in a single state (or phase). The dark lines that act as the boundary between those regions represent the conditions under which the two phases are in equilibrium.
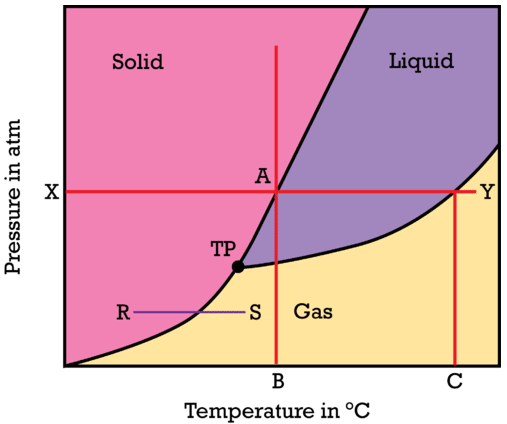
Find the \(X\) on the pressure axis and presume that the value of \(X\) is standard pressure of \(1 \: \text{atm}\). As one moves left to right across the red line, the temperature of the solid substance is being increased while the pressure remains constant. When point \(A\) is reached, the substance melts and the temperature \(B\) on the horizontal axis represents the normal melting point of the substance. Moving further to the right, the substance boils at point \(Y\) and so point \(C\) on the horizontal axis represents the normal boiling point of the substance. As the temperature increases at a constant pressure, the substance changes from solid to liquid to gas.
Start right above point \(B\) on the temperature axis and follow the red line vertically. At very low pressure, the particles of the substance are far apart from one another and the substance is in the gas state. As the pressure is increased, the particles of the substance are forced closer and closer together. Eventually the particles are pushed so close together that attractive forces cause the substance to condense into the liquid state. Continually increasing the pressure on the liquid will eventually cause the substance to solidify. For the majority of substances, the solid state is denser than the liquid state and so putting a liquid under great pressure will cause it to turn into a solid. The line segment \(R\)-\(S\) represents the process of sublimation, where the substance changes directly from a solid to a gas. At a sufficiently low pressure, the liquid phase does not exist. The point labeled \(TP\) is called the triple point. The triple point is the one condition of temperature and pressure where the solid, liquid, and vapor states of a substance can all coexist at equilibrium.
Phase Diagram for Water
Water is a unique substance in many ways. One of these special properties is the fact that solid water (ice) is less dense than liquid water just above the freezing point. The phase diagram for water is shown in the figure below.
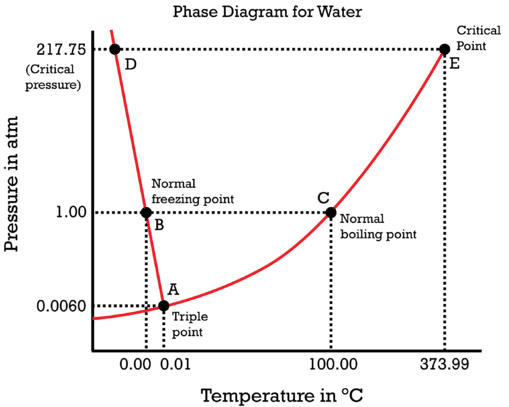
Notice one key difference between last section's general phase diagram, and the above phase diagram for water: in water's diagram, the slope of the line between the solid and liquid states is negative rather than positive. The reason is that water is an unusual substance, in that its solid state is less dense than the liquid state. Ice floats in liquid water. Therefore, a pressure change has the opposite effect on those two phases. If ice is relatively near its melting point, it can be changed into liquid water by the application of pressure. The water molecules are actually closer together in the liquid phase than they are in the solid phase.
Refer again to water's phase diagram (figure above). Notice point \(E\), labeled the critical point. What does that mean? At \(373.99^\text{o} \text{C}\), particles of water in the gas phase are moving very, very rapidly. At any temperature higher than that, the gas phase cannot be made to liquefy, no matter how much pressure is applied to the gas. The critical pressure \(\left( P_\text{C} \right)\) is the pressure that must be applied to the gas at the critical temperature in order to turn it into a liquid. For water, the critical pressure is very high, \(217.75 \: \text{atm}\). The critical point is the intersection point of the critical temperature and the critical pressure.
Summary
- A phase diagram graphs the conditions of temperature and pressure under which a substance exists in the solid, liquid, and gas states.
- The triple point is the one condition of temperature and pressure where the solid, liquid, and vapor states of a substance can all coexist at equilibrium.