
9.9: The Greenhouse Effect and Climate Change
- Page ID
- 477173

\( \newcommand{\vecs}[1]{\overset { \scriptstyle \rightharpoonup} {\mathbf{#1}} } \)
\( \newcommand{\vecd}[1]{\overset{-\!-\!\rightharpoonup}{\vphantom{a}\smash {#1}}} \)
\( \newcommand{\id}{\mathrm{id}}\) \( \newcommand{\Span}{\mathrm{span}}\)
( \newcommand{\kernel}{\mathrm{null}\,}\) \( \newcommand{\range}{\mathrm{range}\,}\)
\( \newcommand{\RealPart}{\mathrm{Re}}\) \( \newcommand{\ImaginaryPart}{\mathrm{Im}}\)
\( \newcommand{\Argument}{\mathrm{Arg}}\) \( \newcommand{\norm}[1]{\| #1 \|}\)
\( \newcommand{\inner}[2]{\langle #1, #2 \rangle}\)
\( \newcommand{\Span}{\mathrm{span}}\)
\( \newcommand{\id}{\mathrm{id}}\)
\( \newcommand{\Span}{\mathrm{span}}\)
\( \newcommand{\kernel}{\mathrm{null}\,}\)
\( \newcommand{\range}{\mathrm{range}\,}\)
\( \newcommand{\RealPart}{\mathrm{Re}}\)
\( \newcommand{\ImaginaryPart}{\mathrm{Im}}\)
\( \newcommand{\Argument}{\mathrm{Arg}}\)
\( \newcommand{\norm}[1]{\| #1 \|}\)
\( \newcommand{\inner}[2]{\langle #1, #2 \rangle}\)
\( \newcommand{\Span}{\mathrm{span}}\) \( \newcommand{\AA}{\unicode[.8,0]{x212B}}\)
\( \newcommand{\vectorA}[1]{\vec{#1}} % arrow\)
\( \newcommand{\vectorAt}[1]{\vec{\text{#1}}} % arrow\)
\( \newcommand{\vectorB}[1]{\overset { \scriptstyle \rightharpoonup} {\mathbf{#1}} } \)
\( \newcommand{\vectorC}[1]{\textbf{#1}} \)
\( \newcommand{\vectorD}[1]{\overrightarrow{#1}} \)
\( \newcommand{\vectorDt}[1]{\overrightarrow{\text{#1}}} \)
\( \newcommand{\vectE}[1]{\overset{-\!-\!\rightharpoonup}{\vphantom{a}\smash{\mathbf {#1}}}} \)
\( \newcommand{\vecs}[1]{\overset { \scriptstyle \rightharpoonup} {\mathbf{#1}} } \)
\( \newcommand{\vecd}[1]{\overset{-\!-\!\rightharpoonup}{\vphantom{a}\smash {#1}}} \)
\(\newcommand{\avec}{\mathbf a}\) \(\newcommand{\bvec}{\mathbf b}\) \(\newcommand{\cvec}{\mathbf c}\) \(\newcommand{\dvec}{\mathbf d}\) \(\newcommand{\dtil}{\widetilde{\mathbf d}}\) \(\newcommand{\evec}{\mathbf e}\) \(\newcommand{\fvec}{\mathbf f}\) \(\newcommand{\nvec}{\mathbf n}\) \(\newcommand{\pvec}{\mathbf p}\) \(\newcommand{\qvec}{\mathbf q}\) \(\newcommand{\svec}{\mathbf s}\) \(\newcommand{\tvec}{\mathbf t}\) \(\newcommand{\uvec}{\mathbf u}\) \(\newcommand{\vvec}{\mathbf v}\) \(\newcommand{\wvec}{\mathbf w}\) \(\newcommand{\xvec}{\mathbf x}\) \(\newcommand{\yvec}{\mathbf y}\) \(\newcommand{\zvec}{\mathbf z}\) \(\newcommand{\rvec}{\mathbf r}\) \(\newcommand{\mvec}{\mathbf m}\) \(\newcommand{\zerovec}{\mathbf 0}\) \(\newcommand{\onevec}{\mathbf 1}\) \(\newcommand{\real}{\mathbb R}\) \(\newcommand{\twovec}[2]{\left[\begin{array}{r}#1 \\ #2 \end{array}\right]}\) \(\newcommand{\ctwovec}[2]{\left[\begin{array}{c}#1 \\ #2 \end{array}\right]}\) \(\newcommand{\threevec}[3]{\left[\begin{array}{r}#1 \\ #2 \\ #3 \end{array}\right]}\) \(\newcommand{\cthreevec}[3]{\left[\begin{array}{c}#1 \\ #2 \\ #3 \end{array}\right]}\) \(\newcommand{\fourvec}[4]{\left[\begin{array}{r}#1 \\ #2 \\ #3 \\ #4 \end{array}\right]}\) \(\newcommand{\cfourvec}[4]{\left[\begin{array}{c}#1 \\ #2 \\ #3 \\ #4 \end{array}\right]}\) \(\newcommand{\fivevec}[5]{\left[\begin{array}{r}#1 \\ #2 \\ #3 \\ #4 \\ #5 \\ \end{array}\right]}\) \(\newcommand{\cfivevec}[5]{\left[\begin{array}{c}#1 \\ #2 \\ #3 \\ #4 \\ #5 \\ \end{array}\right]}\) \(\newcommand{\mattwo}[4]{\left[\begin{array}{rr}#1 \amp #2 \\ #3 \amp #4 \\ \end{array}\right]}\) \(\newcommand{\laspan}[1]{\text{Span}\{#1\}}\) \(\newcommand{\bcal}{\cal B}\) \(\newcommand{\ccal}{\cal C}\) \(\newcommand{\scal}{\cal S}\) \(\newcommand{\wcal}{\cal W}\) \(\newcommand{\ecal}{\cal E}\) \(\newcommand{\coords}[2]{\left\{#1\right\}_{#2}}\) \(\newcommand{\gray}[1]{\color{gray}{#1}}\) \(\newcommand{\lgray}[1]{\color{lightgray}{#1}}\) \(\newcommand{\rank}{\operatorname{rank}}\) \(\newcommand{\row}{\text{Row}}\) \(\newcommand{\col}{\text{Col}}\) \(\renewcommand{\row}{\text{Row}}\) \(\newcommand{\nul}{\text{Nul}}\) \(\newcommand{\var}{\text{Var}}\) \(\newcommand{\corr}{\text{corr}}\) \(\newcommand{\len}[1]{\left|#1\right|}\) \(\newcommand{\bbar}{\overline{\bvec}}\) \(\newcommand{\bhat}{\widehat{\bvec}}\) \(\newcommand{\bperp}{\bvec^\perp}\) \(\newcommand{\xhat}{\widehat{\xvec}}\) \(\newcommand{\vhat}{\widehat{\vvec}}\) \(\newcommand{\uhat}{\widehat{\uvec}}\) \(\newcommand{\what}{\widehat{\wvec}}\) \(\newcommand{\Sighat}{\widehat{\Sigma}}\) \(\newcommand{\lt}{<}\) \(\newcommand{\gt}{>}\) \(\newcommand{\amp}{&}\) \(\definecolor{fillinmathshade}{gray}{0.9}\)Earth’s Temperature is a Balancing Act
Earth’s temperature depends on the balance between energy entering and leaving the planet. When incoming energy from the Sun is absorbed, Earth warms. When the Sun’s energy is reflected back into space, Earth avoids warming. When energy is released from Earth into space, the planet cools. Many factors, both natural and human, can cause changes in Earth’s energy balance, including:
- Changes in the greenhouse effect, which affects the amount of heat retained by Earth’s atmosphere;
- Variations in the Sun’s energy reaching Earth;
- Changes in the reflectivity of Earth’s atmosphere and surface.
Scientists have pieced together a picture of Earth’s climate, dating back hundreds of thousands of years, by analyzing a number of indirect measures of climate such as ice cores, tree rings, glacier size, pollen counts, and ocean sediments. Scientists have also studied changes in Earth’s orbit around the sun and the activity of the sun itself.
The historical record shows that the climate varies naturally over a wide range of time scales. In general, climate changes prior to the Industrial Revolution in the 1700s can be explained by natural causes, such as changes in solar energy, volcanic eruptions, and natural changes in greenhouse gas (GHG) concentrations. (The details of these are beyond the scope of this text, but see the link in the attributions if you would like to know more about them.) Recent changes in climate, however, cannot be explained by natural causes alone. Research indicates that natural causes are very unlikely to explain most observed warming, especially warming since the mid-20th century. Rather, human activities, especially our combustion of fossil fuels, explains the current warming (figure \(\PageIndex{1}\)). The scientific consensus is clear: through alterations of the carbon cycle, humans are changing the global climate by increasing the effects of something known as the greenhouse effect.

The Greenhouse Effect Causes the Atmosphere to Retain Heat
Gardeners that live in moderate or cool environments use greenhouses because they trap heat and create an environment that is warmer than outside temperatures. This is great for plants that like heat, or are sensitive to cold temperatures, such as tomato and pepper plants. Greenhouses contain glass or plastic that is transparent to visible light from the Sun. This light is absorbed by plants, soil, and surfaces and heats them. Some of that heat energy is then radiated outwards in the form of infrared radiation. But the glass of the greenhouse is opaque to the infrared radiation, thereby trapping the heat energy, causing the temperature within the greenhouse to increase.
The same phenomenon happens inside a car on a sunny day. Have you ever noticed how much hotter a car can get compared to the outside temperature? Light energy from the Sun passes through the windows and is absorbed by the surfaces in the car such as seats and the dashboard. Those warm surfaces then radiate infrared radiation, which cannot pass through the glass. This trapped infrared energy causes the air temperatures in the car to increase. This process is commonly known as the greenhouse effect.
The video below made for kids, but provides a clear and simple introduction to the greenhouse effect.
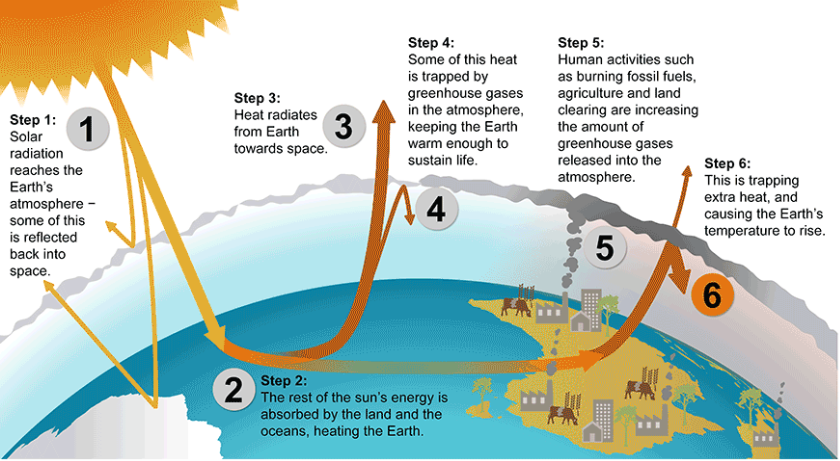
The greenhouse effect also happens with the entire Earth. Of course, our planet is not surrounded by glass windows. Instead, the Earth is wrapped with an atmosphere that contains greenhouse gases (GHGs). Much like the glass in a greenhouse, GHGs are transparent to visible light from the Sun, but they are opaque to infrared radiation that is radiated from the Earth towards space (figure \(\PageIndex{2}\)). In this way, they help trap heat energy that subsequently raises air temperature. Being a greenhouse gas is a physical property of certain types of gases; because of their molecular structure they absorb wavelengths of infrared radiation, but are transparent to visible light. Some notable greenhouse gases are water vapor (H2O), carbon dioxide (CO2), and methane (CH4). GHGs act like a blanket, making Earth significantly warmer than it would otherwise be. Scientists estimate that average temperature on Earth would be -18º C without naturally-occurring GHGs.
What is Global Warming?
Global warming refers to the recent and ongoing rise in global average temperature near Earth’s surface. It is caused mostly by increasing concentrations of greenhouse gases in the atmosphere. Global warming is causing climate patterns to change. However, global warming itself represents only one aspect of climate change. Climate change refers to any significant change in the measures of climate lasting for an extended period of time. In other words, climate change includes major changes in temperature, precipitation, or wind patterns, among other effects, that occur over several decades or longer.
The Main Greenhouse Gasses
The most important GHGs directly emitted by humans include CO2 and methane. Carbon dioxide (CO2) is the primary greenhouse gas that is contributing to recent global climate change. CO2 is a natural component of the carbon cycle, involved in such activities as photosynthesis, respiration, volcanic eruptions, and ocean-atmosphere exchange. Human activities, primarily the burning of fossil fuels and changes in land use, release very large amounts of CO2 to the atmosphere, causing its concentration in the atmosphere to rise.
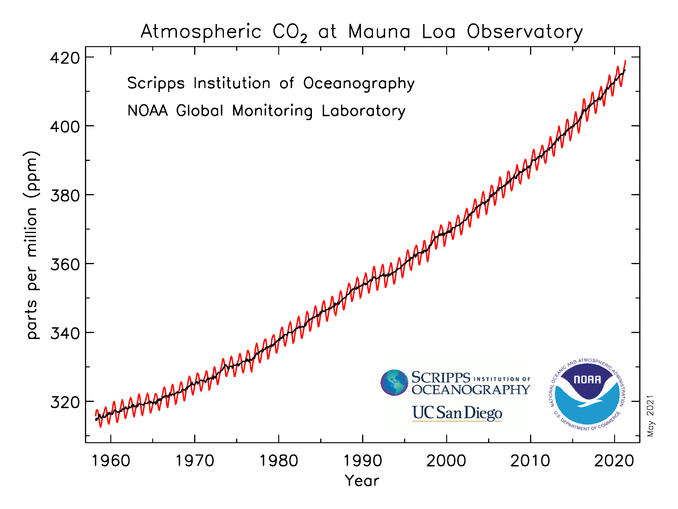
Atmospheric CO2 concentrations have increased by 45% since pre-industrial times, from approximately 280 parts per million (ppm) in the 18th century to 409.8 ppm in 2019 (figure \(\PageIndex{c}\)). The current CO2 level is higher than it has been in at least 800,000 years, based on evidence from ice cores that preserve ancient atmospheric gases (figure \(\PageIndex{d-f}\)). Human activities currently release over 30 billion tons of CO2 into the atmosphere every year. While some volcanic eruptions released large quantities of CO2 in the distant past, the U.S. Geological Survey (USGS) reports that human activities now emit more than 135 times as much CO2 as volcanoes each year. This human-caused build-up of CO2 in the atmosphere is like a tub filling with water, where more water flows from the faucet than the drain can take away.
Water vapor is the most abundant greenhouse gas and also the most important in terms of its contribution to the natural greenhouse effect, despite having a short atmospheric lifetime. Some human activities can influence local water vapor levels. However, on a global scale, the concentration of water vapor is controlled by temperature, which influences overall rates of evaporation and precipitation. Therefore, the global concentration of water vapor is not substantially affected by direct human emissions.
Methane is another GHG which has increased due to human activity, but its concentrations are much lower than CO2.


Scientific Consensus: Global Climate Change is Real
The Intergovernmental Panel on Climate Change (IPCC) was created in 1988 by the United Nations Environment Programme and the World Meteorological Organization. It is charged with the task of evaluating and synthesizing the scientific evidence surrounding global climate change. The IPCC uses this information to evaluate current impacts and future risks, in addition to providing policymakers with assessments. These assessments are released about once every every six years. The most recent report, the 6th Assessment, was released in 2021. Hundreds of leading scientists from around the world are chosen to author these reports. Over the history of the IPCC, these scientists have reviewed thousands of peer-reviewed, publicly available studies. The scientific consensus is clear: global climate change is real and humans are very likely the cause for this change.
Additionally, the major scientific agencies of the United States, including the National Aeronautics and Space Administration (NASA) and the National Oceanic and Atmospheric Administration (NOAA), also agree that climate change is occurring and that humans are driving it. In 2010, the US National Research Council concluded that “Climate change is occurring, is very likely caused by human activities, and poses significant risks for a broad range of human and natural systems”. Many independent scientific organizations have released similar statements, both in the United States and abroad. This does not necessarily mean that every scientist sees eye to eye on each component of the climate change problem, but broad agreement exists that climate change is happening and is primarily caused by excess greenhouse gases from human activities. Critics of climate change, driven by ideology instead of evidence, try to suggest to the public that there is no scientific consensus on global climate change. Such an assertion is patently false.
Current Status of Global Climate Change and Future Changes
Greenhouse gas concentrations in the atmosphere will continue to increase unless the billions of tons of anthropogenic emissions each year decrease substantially. Increased concentrations are expected to do the following:
- Increase Earth’s average temperature (figure \(\PageIndex{6}\)).
- Influence the patterns and amounts of precipitation.
- Reduce ice and snow cover, as well as permafrost.
- Raise sea level.
- Increase the acidity of the oceans.


Figure \(\PageIndex{7}\): Sea height variation (mm) over time. Sea height has increased about 3.3 millimeters per year on average since 1993. Data is from satellite sea level observations by the NASA Goddard Space Flight Center. Image by NASA(opens in new window) (public domain).
These changes will impact our food supply, water resources, infrastructure, ecosystems, and even our own health. The magnitude and rate of future climate change will primarily depend on the following factors:
- The rate at which levels of greenhouse gas concentrations in our atmosphere continue to increase.
- How strongly features of the climate (e.g., temperature, precipitation, and sea level) respond to the expected increase in greenhouse gas concentrations.
- Natural influences on climate (e.g., from volcanic activity and changes in the sun’s intensity) and natural processes within the climate system (e.g., changes in ocean circulation patterns).
These impacts will continue well into the future (please see the attribution link at the end of this page if you would like to read about the impacts and time frame in more detail.)
Climate Change Affects Everyone
Our lives are connected to the climate. Human societies have adapted to the relatively stable climate we have enjoyed since the last ice age which ended several thousand years ago. A warming climate will bring changes that can affect our water supplies, agriculture, power and transportation systems, the natural environment, and even our own health and safety.
Carbon dioxide can stay in the atmosphere for nearly a century, on average, so Earth will continue to warm in the coming decades. The warmer it gets, the greater the risk for more severe changes to the climate and Earth’s system. Although it’s difficult to predict the exact impacts of climate change, what is clear is that the climate we are accustomed to is no longer a reliable guide for what to expect in the future.
We can reduce the risks we will face from climate change. By making choices that reduce greenhouse gas pollution, and preparing for the changes that are already underway, we can reduce risks from climate change. Our decisions today will shape the world our children and grandchildren will live in.
You can take steps at home, on the road, and in your office to reduce greenhouse gas emissions and the risks associated with climate change. Many of these steps can save you money. Some, such as walking or biking to work, can even improve your health! You can also get involved on a local or state level to support energy efficiency, clean energy programs, or other climate programs.
Suggested Supplementary Reading
Intergovernmental Panel on Climate Change. 2021. 6th Assessment: Summary for Policymakers.
NASA. 2018. Global Climate Change: Vital Signs of the Planet. This website by NASA provides a multi-media smorgasbord of engaging content. Learn about climate change using data collected by NASA satellites and more.
Attributions
Remixed by Jamie MacArthur from the following source which was modified by Melissa Ha from the following sources:
- Climate and the Effects of Global Climate Change from General Biology by OpenStax (licensed under CC-BY(opens in new window))
- Climate Change from Environmental Biology by Matthew R. Fisher (licensed under CC-BY(opens in new window))
- Carbon Cycle from Biology by John W. Kimball (licensed under CC-BY(opens in new window))