
2.1: Kinetics and Thermodynamics of Simple Chemical Processes
- Page ID
- 201085
\( \newcommand{\vecs}[1]{\overset { \scriptstyle \rightharpoonup} {\mathbf{#1}} } \)
\( \newcommand{\vecd}[1]{\overset{-\!-\!\rightharpoonup}{\vphantom{a}\smash {#1}}} \)
\( \newcommand{\dsum}{\displaystyle\sum\limits} \)
\( \newcommand{\dint}{\displaystyle\int\limits} \)
\( \newcommand{\dlim}{\displaystyle\lim\limits} \)
\( \newcommand{\id}{\mathrm{id}}\) \( \newcommand{\Span}{\mathrm{span}}\)
( \newcommand{\kernel}{\mathrm{null}\,}\) \( \newcommand{\range}{\mathrm{range}\,}\)
\( \newcommand{\RealPart}{\mathrm{Re}}\) \( \newcommand{\ImaginaryPart}{\mathrm{Im}}\)
\( \newcommand{\Argument}{\mathrm{Arg}}\) \( \newcommand{\norm}[1]{\| #1 \|}\)
\( \newcommand{\inner}[2]{\langle #1, #2 \rangle}\)
\( \newcommand{\Span}{\mathrm{span}}\)
\( \newcommand{\id}{\mathrm{id}}\)
\( \newcommand{\Span}{\mathrm{span}}\)
\( \newcommand{\kernel}{\mathrm{null}\,}\)
\( \newcommand{\range}{\mathrm{range}\,}\)
\( \newcommand{\RealPart}{\mathrm{Re}}\)
\( \newcommand{\ImaginaryPart}{\mathrm{Im}}\)
\( \newcommand{\Argument}{\mathrm{Arg}}\)
\( \newcommand{\norm}[1]{\| #1 \|}\)
\( \newcommand{\inner}[2]{\langle #1, #2 \rangle}\)
\( \newcommand{\Span}{\mathrm{span}}\) \( \newcommand{\AA}{\unicode[.8,0]{x212B}}\)
\( \newcommand{\vectorA}[1]{\vec{#1}} % arrow\)
\( \newcommand{\vectorAt}[1]{\vec{\text{#1}}} % arrow\)
\( \newcommand{\vectorB}[1]{\overset { \scriptstyle \rightharpoonup} {\mathbf{#1}} } \)
\( \newcommand{\vectorC}[1]{\textbf{#1}} \)
\( \newcommand{\vectorD}[1]{\overrightarrow{#1}} \)
\( \newcommand{\vectorDt}[1]{\overrightarrow{\text{#1}}} \)
\( \newcommand{\vectE}[1]{\overset{-\!-\!\rightharpoonup}{\vphantom{a}\smash{\mathbf {#1}}}} \)
\( \newcommand{\vecs}[1]{\overset { \scriptstyle \rightharpoonup} {\mathbf{#1}} } \)
\(\newcommand{\longvect}{\overrightarrow}\)
\( \newcommand{\vecd}[1]{\overset{-\!-\!\rightharpoonup}{\vphantom{a}\smash {#1}}} \)
\(\newcommand{\avec}{\mathbf a}\) \(\newcommand{\bvec}{\mathbf b}\) \(\newcommand{\cvec}{\mathbf c}\) \(\newcommand{\dvec}{\mathbf d}\) \(\newcommand{\dtil}{\widetilde{\mathbf d}}\) \(\newcommand{\evec}{\mathbf e}\) \(\newcommand{\fvec}{\mathbf f}\) \(\newcommand{\nvec}{\mathbf n}\) \(\newcommand{\pvec}{\mathbf p}\) \(\newcommand{\qvec}{\mathbf q}\) \(\newcommand{\svec}{\mathbf s}\) \(\newcommand{\tvec}{\mathbf t}\) \(\newcommand{\uvec}{\mathbf u}\) \(\newcommand{\vvec}{\mathbf v}\) \(\newcommand{\wvec}{\mathbf w}\) \(\newcommand{\xvec}{\mathbf x}\) \(\newcommand{\yvec}{\mathbf y}\) \(\newcommand{\zvec}{\mathbf z}\) \(\newcommand{\rvec}{\mathbf r}\) \(\newcommand{\mvec}{\mathbf m}\) \(\newcommand{\zerovec}{\mathbf 0}\) \(\newcommand{\onevec}{\mathbf 1}\) \(\newcommand{\real}{\mathbb R}\) \(\newcommand{\twovec}[2]{\left[\begin{array}{r}#1 \\ #2 \end{array}\right]}\) \(\newcommand{\ctwovec}[2]{\left[\begin{array}{c}#1 \\ #2 \end{array}\right]}\) \(\newcommand{\threevec}[3]{\left[\begin{array}{r}#1 \\ #2 \\ #3 \end{array}\right]}\) \(\newcommand{\cthreevec}[3]{\left[\begin{array}{c}#1 \\ #2 \\ #3 \end{array}\right]}\) \(\newcommand{\fourvec}[4]{\left[\begin{array}{r}#1 \\ #2 \\ #3 \\ #4 \end{array}\right]}\) \(\newcommand{\cfourvec}[4]{\left[\begin{array}{c}#1 \\ #2 \\ #3 \\ #4 \end{array}\right]}\) \(\newcommand{\fivevec}[5]{\left[\begin{array}{r}#1 \\ #2 \\ #3 \\ #4 \\ #5 \\ \end{array}\right]}\) \(\newcommand{\cfivevec}[5]{\left[\begin{array}{c}#1 \\ #2 \\ #3 \\ #4 \\ #5 \\ \end{array}\right]}\) \(\newcommand{\mattwo}[4]{\left[\begin{array}{rr}#1 \amp #2 \\ #3 \amp #4 \\ \end{array}\right]}\) \(\newcommand{\laspan}[1]{\text{Span}\{#1\}}\) \(\newcommand{\bcal}{\cal B}\) \(\newcommand{\ccal}{\cal C}\) \(\newcommand{\scal}{\cal S}\) \(\newcommand{\wcal}{\cal W}\) \(\newcommand{\ecal}{\cal E}\) \(\newcommand{\coords}[2]{\left\{#1\right\}_{#2}}\) \(\newcommand{\gray}[1]{\color{gray}{#1}}\) \(\newcommand{\lgray}[1]{\color{lightgray}{#1}}\) \(\newcommand{\rank}{\operatorname{rank}}\) \(\newcommand{\row}{\text{Row}}\) \(\newcommand{\col}{\text{Col}}\) \(\renewcommand{\row}{\text{Row}}\) \(\newcommand{\nul}{\text{Nul}}\) \(\newcommand{\var}{\text{Var}}\) \(\newcommand{\corr}{\text{corr}}\) \(\newcommand{\len}[1]{\left|#1\right|}\) \(\newcommand{\bbar}{\overline{\bvec}}\) \(\newcommand{\bhat}{\widehat{\bvec}}\) \(\newcommand{\bperp}{\bvec^\perp}\) \(\newcommand{\xhat}{\widehat{\xvec}}\) \(\newcommand{\vhat}{\widehat{\vvec}}\) \(\newcommand{\uhat}{\widehat{\uvec}}\) \(\newcommand{\what}{\widehat{\wvec}}\) \(\newcommand{\Sighat}{\widehat{\Sigma}}\) \(\newcommand{\lt}{<}\) \(\newcommand{\gt}{>}\) \(\newcommand{\amp}{&}\) \(\definecolor{fillinmathshade}{gray}{0.9}\)Equilibrium Constant
For the hypothetical chemical reaction:
\[aA + bB \rightleftharpoons cC + dD \tag{6.5.1}\]
the equilibrium constant is defined as:
\[K_C = \dfrac{[C]^c[D]^d}{[A]^a[B]^b} \tag{6.5.2}\]
The notation [A] signifies the molar concentration of species A. An alternative expression for the equilibrium constant involves partial pressures:
\[K_P = \dfrac{P_C^c P_D^d}{P_A^aP_B^b} \tag{6.5.3}\]
Note that the expression for the equilibrium constant includes only solutes and gases; pure solids and liquids do not appear in the expression. For example, the equilibrium expression for the reaction
\[CaH_2 (s) + 2H_2O (g) \rightleftharpoons Ca(OH)_2 (s) + 2H_2 (g) \tag{6.5.4}\]
is the following:
\[K_C = \dfrac{[H_2]^2}{[H_2O]^2} \tag{6.5.5}\]
Observe that the gas-phase species H2O and H2 appear in the expression but the solids CaH2 and Ca(OH)2 do not appear.
The equilibrium constant is most readily determined by allowing a reaction to reach equilibrium, measuring the concentrations of the various solution-phase or gas-phase reactants and products, and substituting these values into the Law of Mass Action.
Gibbs Energy
The interaction between enthalpy and entropy changes in chemical reactions is best observed by studying their influence on the equilibrium constants of reversible reactions. To this end a new thermodynamic function called Free Energy (or Gibbs Free Energy), symbol ΔG, is defined as shown in the first equation below. Two things should be apparent from this equation. First, in cases where the entropy change is small, ΔG ≅ ΔH. Second, the importance of ΔS in determining ΔG increases with increasing temperature.
\[ΔGº = ΔHº – TΔSº \tag{6.5.6}\]
where \(T\) is the absolute temperature measured in kelvin.
The free energy function provides improved insight into the thermodynamic driving forces that influence reactions. A negative ΔGº is characteristic of an exergonic reaction, one which is thermodynamically favorable and often spontaneous, as is the melting of ice at 1 ºC. Likewise a positive ΔGº is characteristic of an endergonic reaction, one which requires an input of energy from the surroundings.
Example 6.5.1: Decomposition of Cyclobutane
For an example of the relationship of free energy to enthalpy consider the decomposition of cyclobutane to ethene, shown in the following equation. The standard state for all the compounds is gaseous.

This reaction is endothermic, but the increase in number of molecules from one (reactants) to two (products) results in a large positive ΔSº.
At 25 ºC (298 ºK), ΔGº = 19 kcal/mol – 298(43.6) cal/mole = 19 – 13 kcal/mole = +6 kcal/mole. Thus, the entropy change opposes the enthalpy change, but is not sufficient to change the sign of the resulting free energy change, which is endergonic. Indeed, cyclobutane is perfectly stable when kept at room temperature.
Because the entropy contribution increases with temperature, this energetically unfavorable transformation can be made favorable by raising the temperature. At 200 ºC (473 ºK), ΔGº = 19 kcal/mol – 473(43.6) cal/mole = 19 – 20.6 kcal/mole = –1.6 kcal/mole. This is now an exergonic reaction, and the thermal cracking of cyclobutane to ethene is known to occur at higher temperatures.
\[ΔGº = –RT \ln K = –2.303RT \log K\]
with
- R = 1.987 cal/ ºK mole
- T = temperature in ºK
- K = equilibrium constant
A second equation, shown above, is important because it demonstrates the fundamental relationship of ΔGº to the equilibrium constant, K. Because of the negative logarithmic relationship between these variables, a negative ΔGº generates a K>1, whereas a positive ΔGº generates a K<1. When ΔGº = 0, K = 1. Furthermore, small changes in ΔGº produce large changes in K. A change of 1.4 kcal/mole in ΔGº changes K by approximately a factor of 10. This interrelationship may be explored with the calculator on the right. Entering free energies outside the range -8 to 8 kcal/mole or equilibrium constants outside the range 10-6 to 900,000 will trigger an alert, indicating the large imbalance such numbers imply.
Substituted Cyclohexanes
A Values
Substituents on a cyclohexane prefer to be in the equatorial position. When a substituent is in the axial position, there are two gauche butane interactions more than when a substituent is in the equatorial position. We quantify the energy difference between the axial and equatorial conformations as the A-value, which is equivalent to the negative of the ∆G°, for the equilibrium shown below. Therefore the A-value, or -∆G°, is the preference for the substituent to sit in the equatorial position.
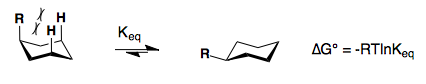
Recall that the equilibrium constant is related to the change in Gibbs Energies for the reaction:
\[\Delta{G^o} = -RT\ln {K_{eq}}\]
The balance between reactants and products in a reaction will be determined by the free energy difference between the two sides of the reaction. The greater the free energy difference, the more the reaction will favor one side or the other (Table 6.5.1).
| Substituent | ∆G° (kcal/mol) | A-value |
| -F | -0.28-0.24 | 0.24-0.28 |
| -Cl | -0.53 | 0.53 |
| -Br | -0.48 | 0.48 |
| -I | -0.47 | 0.47 |
| -CH3 (-Me) | -1.8 | 1.8 |
| -CH2CH3 (-Et) | -1.8 | 1.8 |
| -CH(CH3)2 (-i-Pr) | -2.1 | 2.1 |
| -C(CH3)3 (-t-Bu) | <-4.5 | >4.5 |
| -CHCH2 | -1.7 | 1.7 |
| -CCH | -0.5 | 0.5 |
| -CN | -0.25-0.15 | 0.15-0.25 |
| -C6H5 (-Ph) | -2.9 | 2.9 |
Polysubstituted Cyclohexanes
1,4-disubstitution
The A-values of the substituents are roughly additive in either the cis- or trans-diastereomers.
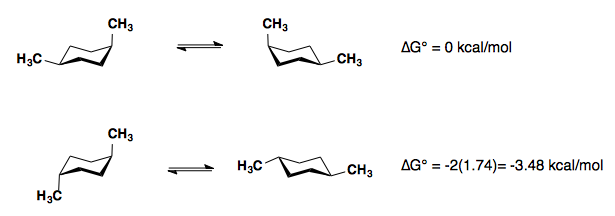
1,3-disubstitution
A-values are only additive in the trans-diastereomer:
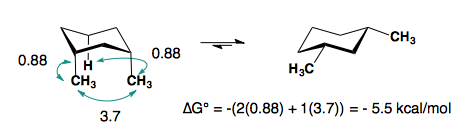
When there are cis-substituents on the chair, there is a new interaction in the di-axial conformation:
In the above example, each methyl group has one 1,3-diaxial interaction with a hydrogen. The methyl groups also interact with each other. This new diaxial interaction is extremely unfavorable based on their steric interaction (see: double-gauche pentane conformation).
Contributors
Prof. Steven Farmer (Sonoma State University)
William Reusch, Professor Emeritus (Michigan State U.), Virtual Textbook of Organic Chemistry
Organic Chemistry With a Biological Emphasis by Tim Soderberg (University of Minnesota, Morris)
Jim Clark (Chemguide.co.uk)
You may recall from general chemistry that it is often convenient to describe chemical reactions with energy diagrams. In an energy diagram, the vertical axis represents the overall energy of the reactants, while the horizontal axis is the ‘reaction coordinate’, tracing from left to right the progress of the reaction from starting compounds to final products. The energy diagram for a typical one-step reaction might look like this:
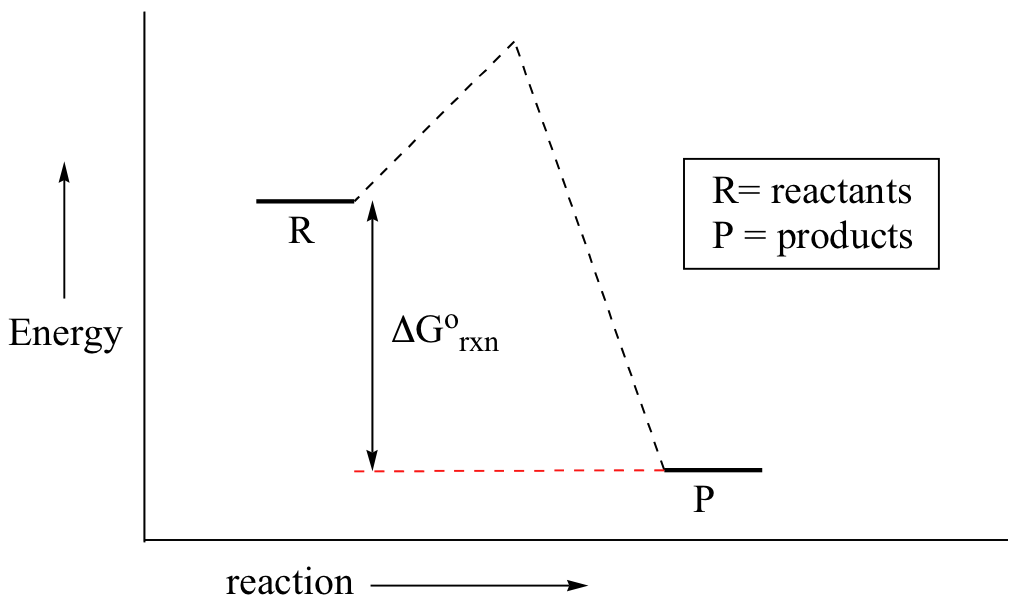
Despite its apparent simplicity, this energy diagram conveys some very important ideas about the thermodynamics and kinetics of the reaction. Recall that when we talk about the thermodynamics of a reaction, we are concerned with the difference in energy between reactants and products, and whether a reaction is ‘downhill’ (exergonic, energy releasing) or ‘uphill (endergonic, energy absorbing). When we talk about kinetics, on the other hand, we are concerned with the rate of the reaction, regardless of whether it is uphill or downhill thermodynamically.
First, let’s review what this energy diagram tells us about the thermodynamics of the reaction illustrated by the energy diagram above. The energy level of the products is lower than that of the reactants. This tells us that the change in standard Gibbs Free Energy for the reaction (ΔG˚rnx) is negative. In other words, the reaction is exergonic, or ‘downhill’. Recall that the ΔG˚rnx term encapsulates both ΔH˚rnx, the change in enthalpy (heat) and ΔS˚rnx , the change in entropy (disorder):
\[ΔG˚ = ΔH˚- TΔS˚\]
where T is the absolute temperature in Kelvin. For chemical processes where the entropy change is small (~0), the enthalpy change is essentially the same as the change in Gibbs Free Energy. Energy diagrams for these processes will often plot the enthalpy (H) instead of Free Energy for simplicity.
The standard Gibbs Free Energy change for a reaction can be related to the reaction's equilibrium constant (\(K_{eq}\_) by a simple equation:
\[ΔG˚ = -RT \ln K_{eq}\]
where:
- Keq = [product] / [reactant] at equilibrium
- R = 8.314 J×K-1×mol-1 or 1.987 cal× K-1×mol-1
- T = temperature in Kelvin (K)
If you do the math, you see that a negative value for ΔG˚rnx (an exergonic reaction) corresponds - as it should by intuition - to Keq being greater than 1, an equilibrium constant which favors product formation.
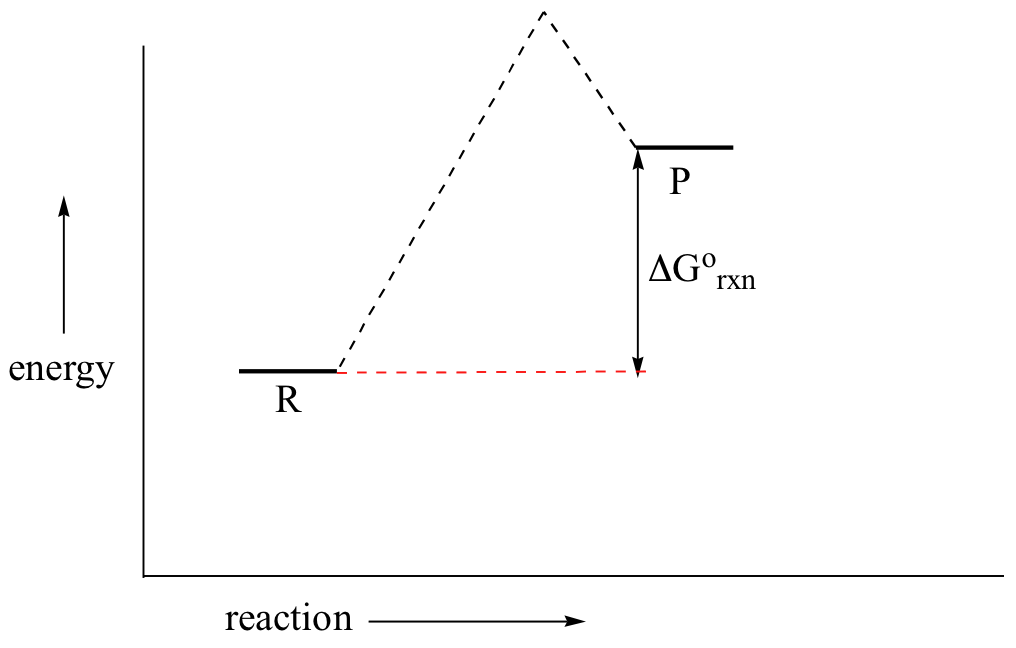
In a hypothetical endergonic (energy-absorbing) reaction the products would have a higher energy than reactants and thus ΔG˚rnx would be positive and Keq would be less than 1, favoring reactants.
Now, let's move to kinetics. Look again at the energy diagram for exergonic reaction: although it is ‘downhill’ overall, it isn’t a straight downhill run.
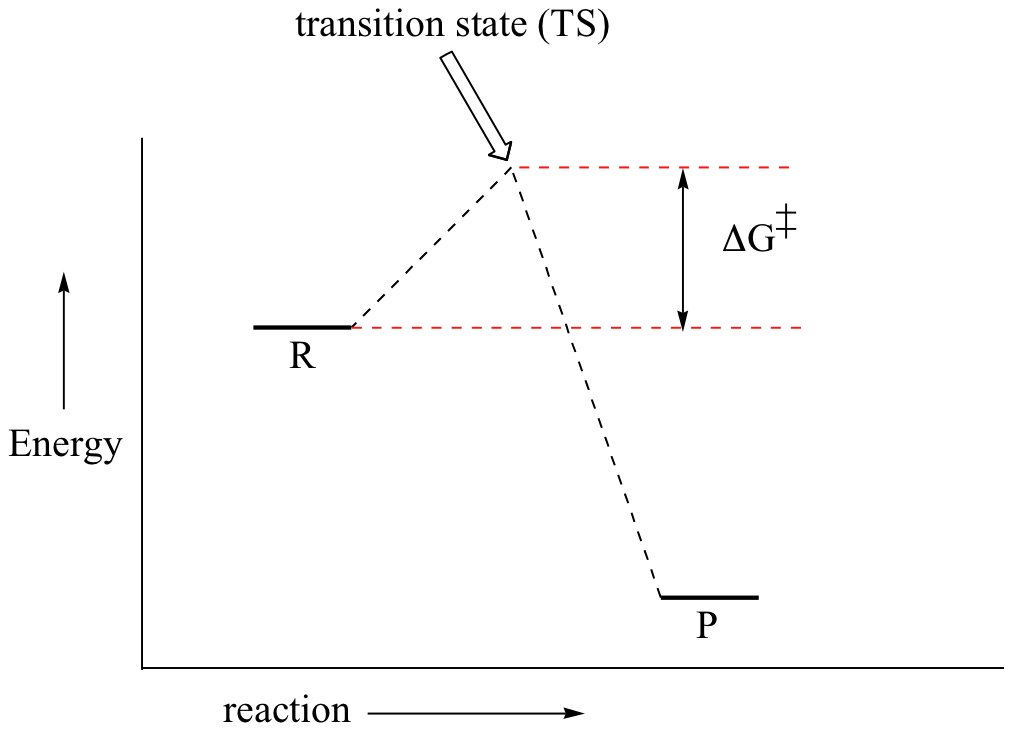
First, an ‘energy barrier’ must be overcome to get to the product side. The height of this energy barrier, you may recall, is called the ‘activation energy’ (ΔG‡). The activation energy is what determines the kinetics of a reaction: the higher the energy hill, the slower the reaction. At the very top of the energy barrier, the reaction is at its transition state (TS), which is the point at which the bonds are in the process of breaking and forming. The transition state is an ‘activated complex’: a transient and dynamic state that, unlike more stable species, does not have any definable lifetime. It may help to imagine a transition state as being analogous to the exact moment that a baseball is struck by a bat. Transition states are drawn with dotted lines representing bonds that are in the process of breaking or forming, and the drawing is often enclosed by brackets. Here is a picture of a likely transition state for a substitution reaction between hydroxide and chloromethane:
\[CH_3Cl + HO^- \rightarrow CH_3OH + Cl^-\]

This reaction involves a collision between two molecules: for this reason, we say that it has second order kinetics. The rate expression for this type of reaction is:
rate = k[reactant 1][reactant 2]
. . . which tells us that the rate of the reaction depends on the rate constant k as well as on the concentration of both reactants. The rate constant can be determined experimentally by measuring the rate of the reaction with different starting reactant concentrations. The rate constant depends on the activation energy, of course, but also on temperature: a higher temperature means a higher k and a faster reaction, all else being equal. This should make intuitive sense: when there is more heat energy in the system, more of the reactant molecules are able to get over the energy barrier.
Here is one more interesting and useful expression. Consider a simple reaction where the reactants are A and B, and the product is AB (this is referred to as a condensation reaction, because two molecules are coming together, or condensing). If we know the rate constant k for the forward reaction and the rate constant kreverse for the reverse reaction (where AB splits apart into A and B), we can simply take the quotient to find our equilibrium constant \(K_{eq}\):
![]()
This too should make some intuitive sense; if the forward rate constant is higher than the reverse rate constant, equilibrium should lie towards products.
Activation Energy
Since exothermic reactions are energetically (thermodynamically) favored, a careless thinker might conclude that all such reactions will proceed spontaneously to their products. Were this true, no life would exist on Earth, because the numerous carbon compounds that are present in and essential to all living organisms would spontaneously combust in the presence of oxygen to give carbon dioxide-a more stable carbon compound. The combustion of methane (eq.1), for example, does not occur spontaneously, but requires an initiating energy in the form of a spark or flame. The flaw in this careless reasoning is that we have focused only on the initial (reactant) and final (product) states of reactions. To understand why some reactions occur readily (almost spontaneously), whereas other reactions are slow, even to the point of being unobservable, we need to consider the intermediate stages of reactions.
| Exothermic Single Step Reaction | Endothermic Single Step Reaction | Exothermic Two Step Reaction |
|---|---|---|
 |  |  |
Every reaction in which bonds are broken will have a high energy transition state that must be reached before products can form. In order for the reactants to reach this transition state, energy must be supplied and reactant molecules must orient themselves in a suitable fashion. The energy needed to raise the reactants to the transition state energy level is called the activation energy, ΔE‡. An example of a single-step exothermic reaction profile is shown on the left above, and a similar single-step profile for an endothermic reaction is in the center. The activation energy is drawn in red in each case, and the overall energy change (ΔE) is in green.
The profile becomes more complex when a multi-step reaction path is described. An example of a two-step reaction proceeding by way of a high energy intermediate is shown on the right above. Here there are two transition states, each with its own activation energy. The overall activation energy is the difference in energy between the reactant state and the highest energy transition state. We see now why the rate of a reaction may not correlate with its overall energy change. In the exothermic diagram on the left, a significant activation energy must be provided to initiate the reaction. Since the reaction is strongly exothermic, it will probably generate enough heat to keep going as long as reactants remain. The endothermic reaction in the center has a similar activation energy, but this will have to be supplied continuously for the reaction to proceed to completion.
What is the source of the activation energy that enables a chemical reaction to occur? Often it is heat, as noted above in reference to the flame or spark that initiates methane combustion. At room temperature, indeed at any temperature above absolute zero, the molecules of a compound have a total energy that is a combination of translational (kinetic) energy, internal vibrational and rotational energies, as well as electronic and nuclear energies. The temperature of a system is a measure of the average kinetic energy of all the atoms and molecules present in the system. As shown in the following diagram, the average kinetic energy increases and the distribution of energies broadens as the temperature is raised from T1 to T2. Portions of this thermal or kinetic energy provide the activation energy for many reactions, the concentration of suitably activated reactant molecules increasing with temperature, e.g. orange area for T1 and yellow plus orange for T2. (Note that the area under a curve or a part of a curve is proportional to the number of molecules represented.)
| Distribution of Molecular Kinetic Energy at Two Different Temperatures, T1 & T2 |  |
|---|
Reaction Rates and Kinetics
Chemical reactivity is the focus of chemistry, and the study of reaction rates provides essential information about this subject. Some reactions proceed so rapidly they seem to be instantaneous, whereas other reactions are so slow they are nearly unobservable. Most of the reactions described in this text take place in from 0.2 to 12 hours at 25 ºC. Temperature is important, since fast reactions may be slowed or stopped by cooling, and slow reactions are accelerated by heating. When a reaction occurs between two reactant species, it proceeds faster at higher concentrations of the reactants. These facts lead to the following general analysis of reaction rates.
Reaction Rate = |
| • |
| • |
|
|---|
Since reacting molecules must collide to interact, and the necessary activation energy must come from the kinetic energy of the colliding molecules, the first two factors are obvious. The third (probability) factor incorporates the orientational requirements of the reaction. For example, the addition of bromine to a double bond at the end of a six-carbon chain (1-hexene) could only occur if the colliding molecules came together in a way that allowed the bromine molecule to interact with the pi-electrons of the double bond.
The collision frequency of reactant molecules will be proportional to their concentration in the reaction system. This aspect of a reaction rate may be incorporated in a rate equation, which may take several forms depending on the number of reactants. Three general examples are presented in the following table.
| Reaction Type | Rate Equation | Reaction Order |
|---|---|---|
| A ——> B | Reaction Rate = k•[A] | First Order Reaction (no collision needed) |
| A + B ——> C + D | Reaction Rate = k•[A]*[B] | Second Order Reaction |
| A + A ——> D | Reaction Rate = k•[A]2 | Second Order Reaction |
These rate equations take the form Reaction Rate = k[X] n[Y] m, where the proportionality constant k reflects the unique characteristics of a specific reaction, and is called the rate constant. The concentrations of reactants X and Y are [X] and [Y] respectively, and n & m are exponential numbers used to fit the rate equation to the experimental data. The sum n + m is termed the kinetic order of a reaction. The first example is a simple first order process. The next two examples are second order reactions, since n + m = 2. The kinetic order of a reaction is usually used to determine its molecularity.
In writing a rate equation we have disconnected the collision frequency term from the activation energy and probability factors defined above, which are necessarily incorporated in the rate constant k. This is demonstrated by the following equation.

The complex parameter A incorporates the probability factor. Because of the exponential relationship of k and the activation energy small changes in ΔE‡ will cause relatively large changes in reaction rate. An increase in temperature clearly acts to increase k, but of greater importance is the increase in average molecular kinetic energy such an increase produces. This was illustrated in a previous diagram, increase in temperature from T1 to T2 producing a larger proportion of reactant molecules having energies equal or greater than the activation energy (designated by the red line.
Contributors
William Reusch, Professor Emeritus (Michigan State U.), Virtual Textbook of Organic Chemistry