Chemistry LibreTexts

3.13: Measuring the Molecular Mass of Organic Compounds: Mass Spectrometry

  • Page ID
    201108
  • \( \newcommand{\vecs}[1]{\overset { \scriptstyle \rightharpoonup} {\mathbf{#1}} } \)

    \( \newcommand{\vecd}[1]{\overset{-\!-\!\rightharpoonup}{\vphantom{a}\smash {#1}}} \)

    \( \newcommand{\id}{\mathrm{id}}\) \( \newcommand{\Span}{\mathrm{span}}\)

    ( \newcommand{\kernel}{\mathrm{null}\,}\) \( \newcommand{\range}{\mathrm{range}\,}\)

    \( \newcommand{\RealPart}{\mathrm{Re}}\) \( \newcommand{\ImaginaryPart}{\mathrm{Im}}\)

    \( \newcommand{\Argument}{\mathrm{Arg}}\) \( \newcommand{\norm}[1]{\| #1 \|}\)

    \( \newcommand{\inner}[2]{\langle #1, #2 \rangle}\)

    \( \newcommand{\Span}{\mathrm{span}}\)

    \( \newcommand{\id}{\mathrm{id}}\)

    \( \newcommand{\Span}{\mathrm{span}}\)

    \( \newcommand{\kernel}{\mathrm{null}\,}\)

    \( \newcommand{\range}{\mathrm{range}\,}\)

    \( \newcommand{\RealPart}{\mathrm{Re}}\)

    \( \newcommand{\ImaginaryPart}{\mathrm{Im}}\)

    \( \newcommand{\Argument}{\mathrm{Arg}}\)

    \( \newcommand{\norm}[1]{\| #1 \|}\)

    \( \newcommand{\inner}[2]{\langle #1, #2 \rangle}\)

    \( \newcommand{\Span}{\mathrm{span}}\) \( \newcommand{\AA}{\unicode[.8,0]{x212B}}\)

    \( \newcommand{\vectorA}[1]{\vec{#1}}      % arrow\)

    \( \newcommand{\vectorAt}[1]{\vec{\text{#1}}}      % arrow\)

    \( \newcommand{\vectorB}[1]{\overset { \scriptstyle \rightharpoonup} {\mathbf{#1}} } \)

    \( \newcommand{\vectorC}[1]{\textbf{#1}} \)

    \( \newcommand{\vectorD}[1]{\overrightarrow{#1}} \)

    \( \newcommand{\vectorDt}[1]{\overrightarrow{\text{#1}}} \)

    \( \newcommand{\vectE}[1]{\overset{-\!-\!\rightharpoonup}{\vphantom{a}\smash{\mathbf {#1}}}} \)

    \( \newcommand{\vecs}[1]{\overset { \scriptstyle \rightharpoonup} {\mathbf{#1}} } \)

    \( \newcommand{\vecd}[1]{\overset{-\!-\!\rightharpoonup}{\vphantom{a}\smash {#1}}} \)

    \(\newcommand{\avec}{\mathbf a}\) \(\newcommand{\bvec}{\mathbf b}\) \(\newcommand{\cvec}{\mathbf c}\) \(\newcommand{\dvec}{\mathbf d}\) \(\newcommand{\dtil}{\widetilde{\mathbf d}}\) \(\newcommand{\evec}{\mathbf e}\) \(\newcommand{\fvec}{\mathbf f}\) \(\newcommand{\nvec}{\mathbf n}\) \(\newcommand{\pvec}{\mathbf p}\) \(\newcommand{\qvec}{\mathbf q}\) \(\newcommand{\svec}{\mathbf s}\) \(\newcommand{\tvec}{\mathbf t}\) \(\newcommand{\uvec}{\mathbf u}\) \(\newcommand{\vvec}{\mathbf v}\) \(\newcommand{\wvec}{\mathbf w}\) \(\newcommand{\xvec}{\mathbf x}\) \(\newcommand{\yvec}{\mathbf y}\) \(\newcommand{\zvec}{\mathbf z}\) \(\newcommand{\rvec}{\mathbf r}\) \(\newcommand{\mvec}{\mathbf m}\) \(\newcommand{\zerovec}{\mathbf 0}\) \(\newcommand{\onevec}{\mathbf 1}\) \(\newcommand{\real}{\mathbb R}\) \(\newcommand{\twovec}[2]{\left[\begin{array}{r}#1 \\ #2 \end{array}\right]}\) \(\newcommand{\ctwovec}[2]{\left[\begin{array}{c}#1 \\ #2 \end{array}\right]}\) \(\newcommand{\threevec}[3]{\left[\begin{array}{r}#1 \\ #2 \\ #3 \end{array}\right]}\) \(\newcommand{\cthreevec}[3]{\left[\begin{array}{c}#1 \\ #2 \\ #3 \end{array}\right]}\) \(\newcommand{\fourvec}[4]{\left[\begin{array}{r}#1 \\ #2 \\ #3 \\ #4 \end{array}\right]}\) \(\newcommand{\cfourvec}[4]{\left[\begin{array}{c}#1 \\ #2 \\ #3 \\ #4 \end{array}\right]}\) \(\newcommand{\fivevec}[5]{\left[\begin{array}{r}#1 \\ #2 \\ #3 \\ #4 \\ #5 \\ \end{array}\right]}\) \(\newcommand{\cfivevec}[5]{\left[\begin{array}{c}#1 \\ #2 \\ #3 \\ #4 \\ #5 \\ \end{array}\right]}\) \(\newcommand{\mattwo}[4]{\left[\begin{array}{rr}#1 \amp #2 \\ #3 \amp #4 \\ \end{array}\right]}\) \(\newcommand{\laspan}[1]{\text{Span}\{#1\}}\) \(\newcommand{\bcal}{\cal B}\) \(\newcommand{\ccal}{\cal C}\) \(\newcommand{\scal}{\cal S}\) \(\newcommand{\wcal}{\cal W}\) \(\newcommand{\ecal}{\cal E}\) \(\newcommand{\coords}[2]{\left\{#1\right\}_{#2}}\) \(\newcommand{\gray}[1]{\color{gray}{#1}}\) \(\newcommand{\lgray}[1]{\color{lightgray}{#1}}\) \(\newcommand{\rank}{\operatorname{rank}}\) \(\newcommand{\row}{\text{Row}}\) \(\newcommand{\col}{\text{Col}}\) \(\renewcommand{\row}{\text{Row}}\) \(\newcommand{\nul}{\text{Nul}}\) \(\newcommand{\var}{\text{Var}}\) \(\newcommand{\corr}{\text{corr}}\) \(\newcommand{\len}[1]{\left|#1\right|}\) \(\newcommand{\bbar}{\overline{\bvec}}\) \(\newcommand{\bhat}{\widehat{\bvec}}\) \(\newcommand{\bperp}{\bvec^\perp}\) \(\newcommand{\xhat}{\widehat{\xvec}}\) \(\newcommand{\vhat}{\widehat{\vvec}}\) \(\newcommand{\uhat}{\widehat{\uvec}}\) \(\newcommand{\what}{\widehat{\wvec}}\) \(\newcommand{\Sighat}{\widehat{\Sigma}}\) \(\newcommand{\lt}{<}\) \(\newcommand{\gt}{>}\) \(\newcommand{\amp}{&}\) \(\definecolor{fillinmathshade}{gray}{0.9}\)
    Objectives

    After completing this section, you should be able to

    1. describe, briefly, how a mass spectrometer works.
    2. sketch a simple diagram to show the essential features of a mass spectrometer.
    3. identify peaks in a simple mass spectrum, and explain how they arise.
    Key Terms

    Make certain that you can define, and use in context, the key terms below.

    • base peak
    • parent peak (molecular ion peak)
    • cation radical
    • relative abundance
    • mass spectrometer
    • mass spectroscopy
    • mass spectrum
    • molecular ion (M+·)
    • mass-to-charge ratio (m/z)
    Study Notes

    You may remember from general first-year chemistry how mass spectroscopy has been used to establish the atomic mass and abundance of isotopes.

    Mass spectrometers are large and expensive, and usually operated only by fully trained personnel, so you may not have the opportunity to use such an instrument as part of this course. Research chemists often rely quite heavily on mass spectra to assist them in the identification of compounds, and you will be required to interpret simple mass spectra both in assignments and on examinations. Note that in most attempts to identify an unknown compound, chemists do not rely exclusively on the results obtained from a single spectroscopic technique. A combination of chemical and physical properties and spectral evidence is usually employed.

    The Mass Spectrometer

    In order to measure the characteristics of individual molecules, a mass spectrometer converts them to ions so that they can be moved about and manipulated by external electric and magnetic fields. The three essential functions of a mass spectrometer, and the associated components, are:

    1. A small sample is ionized, usually to cations by loss of an electron. The Ion Source
    2. The ions are sorted and separated according to their mass and charge. The Mass Analyzer
    3. The separated ions are then measured, and the results displayed on a chart. The Detector

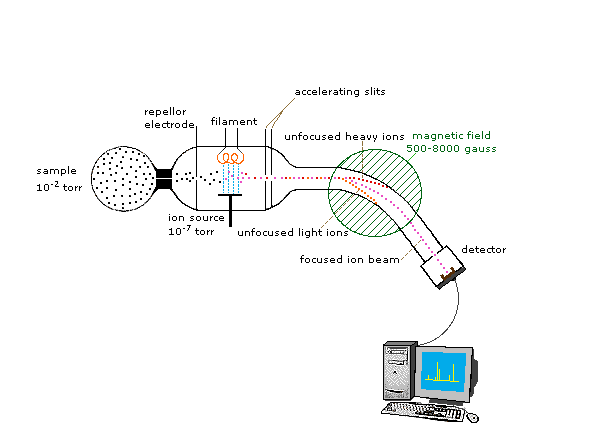
    Because ions are very reactive and short-lived, their formation and manipulation must be conducted in a vacuum. Atmospheric pressure is around 760 torr (mm of mercury). The pressure under which ions may be handled is roughly 10-5 to 10-8 torr (less than a billionth of an atmosphere). Each of the three tasks listed above may be accomplished in different ways. In one common procedure, ionization is effected by a high energy beam of electrons, and ion separation is achieved by accelerating and focusing the ions in a beam, which is then bent by an external magnetic field. The ions are then detected electronically and the resulting information is stored and analyzed in a computer. A mass spectrometer operating in this fashion is outlined in the following diagram. The heart of the spectrometer is the ion source. Here molecules of the sample (black dots) are bombarded by electrons (light blue lines) issuing from a heated filament. This is called an EI (electron-ionization) source. Gases and volatile liquid samples are allowed to leak into the ion source from a reservoir (as shown). Non-volatile solids and liquids may be introduced directly. Cations formed by the electron bombardment (red dots) are pushed away by a charged repellor plate (anions are attracted to it), and accelerated toward other electrodes, having slits through which the ions pass as a beam. Some of these ions fragment into smaller cations and neutral fragments. A perpendicular magnetic field deflects the ion beam in an arc whose radius is inversely proportional to the mass of each ion. Lighter ions are deflected more than heavier ions. By varying the strength of the magnetic field, ions of different mass can be focused progressively on a detector fixed at the end of a curved tube (also under a high vacuum).

    Sample has to pass through the repllor electrode, ion source, filament, and accelerating slits to become unfocused light ions. The ion beam becomes focused and passes through the detector.

    When a high energy electron collides with a molecule it often ionizes it by knocking away one of the molecular electrons (either bonding or non-bonding). This leaves behind a molecular ion (colored red in the following diagram). Residual energy from the collision may cause the molecular ion to fragment into neutral pieces (colored green) and smaller fragment ions (colored pink and orange). The molecular ion is a radical cation, but the fragment ions may either be radical cations (pink) or carbocations (orange), depending on the nature of the neutral fragment. An animated display of this ionization process will appear if you click on the ion source of the mass spectrometer diagram.

    ionizn1.gif

    Below is typical output for an electron-ionization MS experiment (MS data below is derived from the Spectral Database for Organic Compounds, a free, web-based service provided by AIST in Japan.

    Graph of relative intensity against m/z

    The sample is acetone. On the horizontal axis is the value for m/z, which is the mass to charge ratio (as we stated above, the charge z is almost always +1, so in practice this is the same as mass). On the vertical axis is the relative abundance of each ion detected. On this scale, the most abundant ion, called the base peak, is set to 100%, and all other peaks are recorded relative to this value. For acetone, the base peak corresponds to a fragment with m/z = 43 - . The molecular weight of acetone is 58, so we can identify the peak at m/z = 58 as that corresponding to the molecular ion peak, or parent peak. Notice that there is a small peak at m/z = 59: this is referred to as the M+1 peak. How can there be an ion that has a greater mass than the molecular ion? Simple: a small fraction - about 1.1% - of all carbon atoms in nature are actually the 13C rather than the 12C isotope. The 13C isotope is, of course, heavier than 12C by 1 mass unit. In addition, about 0.015% of all hydrogen atoms are actually deuterium, the 2H isotope. So the M+1 peak represents those few acetone molecules in the sample which contained either a 13C or 2H.


    3.13: Measuring the Molecular Mass of Organic Compounds: Mass Spectrometry is shared under a not declared license and was authored, remixed, and/or curated by LibreTexts.

    • Was this article helpful?