Qualitative Reports
- Page ID
- 160752
\( \newcommand{\vecs}[1]{\overset { \scriptstyle \rightharpoonup} {\mathbf{#1}} } \)
\( \newcommand{\vecd}[1]{\overset{-\!-\!\rightharpoonup}{\vphantom{a}\smash {#1}}} \)
\( \newcommand{\id}{\mathrm{id}}\) \( \newcommand{\Span}{\mathrm{span}}\)
( \newcommand{\kernel}{\mathrm{null}\,}\) \( \newcommand{\range}{\mathrm{range}\,}\)
\( \newcommand{\RealPart}{\mathrm{Re}}\) \( \newcommand{\ImaginaryPart}{\mathrm{Im}}\)
\( \newcommand{\Argument}{\mathrm{Arg}}\) \( \newcommand{\norm}[1]{\| #1 \|}\)
\( \newcommand{\inner}[2]{\langle #1, #2 \rangle}\)
\( \newcommand{\Span}{\mathrm{span}}\)
\( \newcommand{\id}{\mathrm{id}}\)
\( \newcommand{\Span}{\mathrm{span}}\)
\( \newcommand{\kernel}{\mathrm{null}\,}\)
\( \newcommand{\range}{\mathrm{range}\,}\)
\( \newcommand{\RealPart}{\mathrm{Re}}\)
\( \newcommand{\ImaginaryPart}{\mathrm{Im}}\)
\( \newcommand{\Argument}{\mathrm{Arg}}\)
\( \newcommand{\norm}[1]{\| #1 \|}\)
\( \newcommand{\inner}[2]{\langle #1, #2 \rangle}\)
\( \newcommand{\Span}{\mathrm{span}}\) \( \newcommand{\AA}{\unicode[.8,0]{x212B}}\)
\( \newcommand{\vectorA}[1]{\vec{#1}} % arrow\)
\( \newcommand{\vectorAt}[1]{\vec{\text{#1}}} % arrow\)
\( \newcommand{\vectorB}[1]{\overset { \scriptstyle \rightharpoonup} {\mathbf{#1}} } \)
\( \newcommand{\vectorC}[1]{\textbf{#1}} \)
\( \newcommand{\vectorD}[1]{\overrightarrow{#1}} \)
\( \newcommand{\vectorDt}[1]{\overrightarrow{\text{#1}}} \)
\( \newcommand{\vectE}[1]{\overset{-\!-\!\rightharpoonup}{\vphantom{a}\smash{\mathbf {#1}}}} \)
\( \newcommand{\vecs}[1]{\overset { \scriptstyle \rightharpoonup} {\mathbf{#1}} } \)
\( \newcommand{\vecd}[1]{\overset{-\!-\!\rightharpoonup}{\vphantom{a}\smash {#1}}} \)
\(\newcommand{\avec}{\mathbf a}\) \(\newcommand{\bvec}{\mathbf b}\) \(\newcommand{\cvec}{\mathbf c}\) \(\newcommand{\dvec}{\mathbf d}\) \(\newcommand{\dtil}{\widetilde{\mathbf d}}\) \(\newcommand{\evec}{\mathbf e}\) \(\newcommand{\fvec}{\mathbf f}\) \(\newcommand{\nvec}{\mathbf n}\) \(\newcommand{\pvec}{\mathbf p}\) \(\newcommand{\qvec}{\mathbf q}\) \(\newcommand{\svec}{\mathbf s}\) \(\newcommand{\tvec}{\mathbf t}\) \(\newcommand{\uvec}{\mathbf u}\) \(\newcommand{\vvec}{\mathbf v}\) \(\newcommand{\wvec}{\mathbf w}\) \(\newcommand{\xvec}{\mathbf x}\) \(\newcommand{\yvec}{\mathbf y}\) \(\newcommand{\zvec}{\mathbf z}\) \(\newcommand{\rvec}{\mathbf r}\) \(\newcommand{\mvec}{\mathbf m}\) \(\newcommand{\zerovec}{\mathbf 0}\) \(\newcommand{\onevec}{\mathbf 1}\) \(\newcommand{\real}{\mathbb R}\) \(\newcommand{\twovec}[2]{\left[\begin{array}{r}#1 \\ #2 \end{array}\right]}\) \(\newcommand{\ctwovec}[2]{\left[\begin{array}{c}#1 \\ #2 \end{array}\right]}\) \(\newcommand{\threevec}[3]{\left[\begin{array}{r}#1 \\ #2 \\ #3 \end{array}\right]}\) \(\newcommand{\cthreevec}[3]{\left[\begin{array}{c}#1 \\ #2 \\ #3 \end{array}\right]}\) \(\newcommand{\fourvec}[4]{\left[\begin{array}{r}#1 \\ #2 \\ #3 \\ #4 \end{array}\right]}\) \(\newcommand{\cfourvec}[4]{\left[\begin{array}{c}#1 \\ #2 \\ #3 \\ #4 \end{array}\right]}\) \(\newcommand{\fivevec}[5]{\left[\begin{array}{r}#1 \\ #2 \\ #3 \\ #4 \\ #5 \\ \end{array}\right]}\) \(\newcommand{\cfivevec}[5]{\left[\begin{array}{c}#1 \\ #2 \\ #3 \\ #4 \\ #5 \\ \end{array}\right]}\) \(\newcommand{\mattwo}[4]{\left[\begin{array}{rr}#1 \amp #2 \\ #3 \amp #4 \\ \end{array}\right]}\) \(\newcommand{\laspan}[1]{\text{Span}\{#1\}}\) \(\newcommand{\bcal}{\cal B}\) \(\newcommand{\ccal}{\cal C}\) \(\newcommand{\scal}{\cal S}\) \(\newcommand{\wcal}{\cal W}\) \(\newcommand{\ecal}{\cal E}\) \(\newcommand{\coords}[2]{\left\{#1\right\}_{#2}}\) \(\newcommand{\gray}[1]{\color{gray}{#1}}\) \(\newcommand{\lgray}[1]{\color{lightgray}{#1}}\) \(\newcommand{\rank}{\operatorname{rank}}\) \(\newcommand{\row}{\text{Row}}\) \(\newcommand{\col}{\text{Col}}\) \(\renewcommand{\row}{\text{Row}}\) \(\newcommand{\nul}{\text{Nul}}\) \(\newcommand{\var}{\text{Var}}\) \(\newcommand{\corr}{\text{corr}}\) \(\newcommand{\len}[1]{\left|#1\right|}\) \(\newcommand{\bbar}{\overline{\bvec}}\) \(\newcommand{\bhat}{\widehat{\bvec}}\) \(\newcommand{\bperp}{\bvec^\perp}\) \(\newcommand{\xhat}{\widehat{\xvec}}\) \(\newcommand{\vhat}{\widehat{\vvec}}\) \(\newcommand{\uhat}{\widehat{\uvec}}\) \(\newcommand{\what}{\widehat{\wvec}}\) \(\newcommand{\Sighat}{\widehat{\Sigma}}\) \(\newcommand{\lt}{<}\) \(\newcommand{\gt}{>}\) \(\newcommand{\amp}{&}\) \(\definecolor{fillinmathshade}{gray}{0.9}\)
Formal laboratory reports should always be neat and readable. Reports for qualitative analysis will be done in ink, on 8 1/2" x 11" white paper, but need not be typed. The specific format for Quantitative reports is given on another page. The format for Qualititative Reports is given below:
-
A cover page that contains the experiment title, your name and section number. This cover page should also list the identified ion(s), unknown number, and contain a summary paragraph of any difficulties or perplexing results encountered in the analysis. If there were no problems encountered, simply write the statement: No problems encountered. This cover page may be word-processed or hand-written neatly in ink.
-
A report flowchart for the unknown analyzed (see Figures below). Indicate on your flow chart the result of each test. Include formulas of ionic species analyzed, the formulas of reagents and the formulas of the products formed. Include only analysis setups that were actually performed during the experiment. This means that the report flowchart will, in most cases, be shorter than the ones in your research notebook, since you cannot pursue analysis of, for example, a precipitate that did not form. Note that the ion absent is recorded and “slashed” in all steps prior to the point that the negative test became apparent. This gives a flowchart that shows the chemistry of the ions that were actually present. Note also that the descriptions of each substance recorded on the report flowchart are the actual experimental observations. These observations are to be placed before the formula for the chemical species formed.
-
An additional section, Chemical Equations for Reactions that Occurred in Analysis of the Unknown, is required (this may be multiple pages). Do not write chemical equations for ions that were absent in your unknown. Show the balanced net ionic equations for the reaction of each ion in each step that appears on the flow chart of the report cover sheet. Do not show full formula equations nor spectator ions that appear on both sides of ionic equations. For your reference, proper net ionic equations are given in the ‘Chemistry and hints’ sections that follow the experimental steps for each group.
The format for reporting these equations is shown in Moodle. Begin by writing the step number from your qual scheme and the reagents that were used in that step. Write the reagents as complete formulas (i.e. 6 M NaOH) since this communicates the specific reagent used to separate or identify the ion. Underline this information. Beneath the underlined step number, write the net ionic equation that occurred for each ion that was listed in that step. When a step involves multiple reagents (e.g. has both an acid and a base added to adjust the pH), write multiple equations that show what happens upon the addition of each reagent. Do this for all steps listed on your report flowchart, including both separations and confirmatory tests.
Use (s) and (g) for the solid and gas states, respectively, and the (aq) for the dissolved aqueous state. (Note that ionic species are always dissolved in solution.) The states of matter highlight the difference between dissolved and solid species. Writing the color under the species is optional. Note: although IUPAC has adopted the non-subscript form for states of matter, many chemists still opt to use the subscript version: \(\ce{H2O(l)}\) vs. \(\ce{H2O_{(l)}}\); both are acceptable for your report.
-
The NCR pages containing flow charts with observations of all experimental work on the known and unknown samples covered in the report. The NCR pages should be in chronological order.
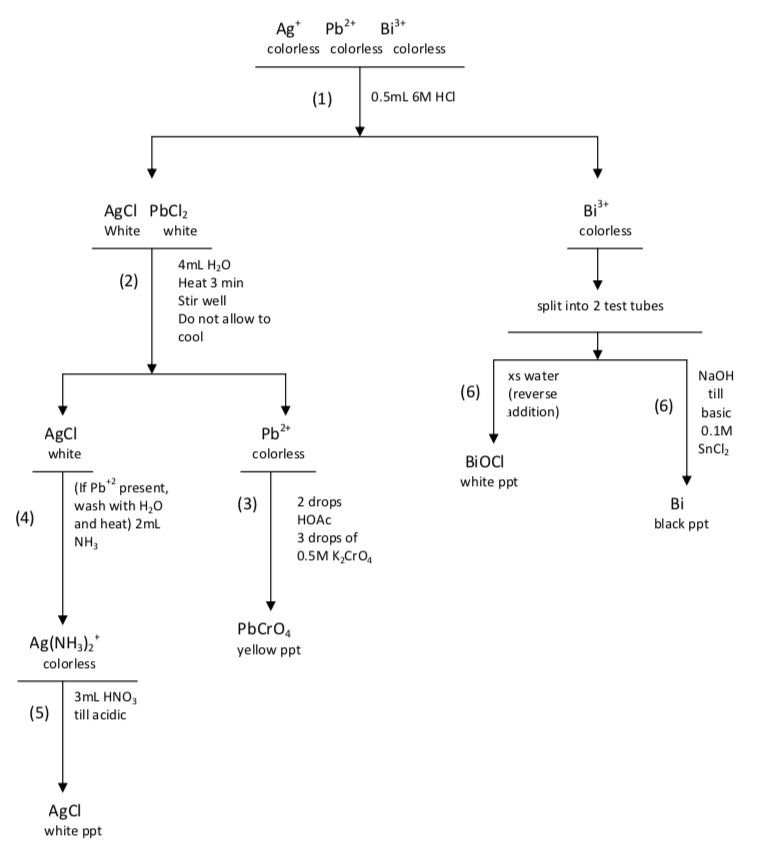
Figure \(\PageIndex{1}\): A model skeleton flowchart for Q-1. A copy of this flowchart should be prepared in your laboratory copied into the lab notebook before coming to lab. If approved by your instructor, this copy in the laboratory notebook before coming to lab. If approved by your instructor, this copy will be ready to receive observations as notebook will be ready to receive the observations as the known mixture is tested in the laboratory. A second page the known mixture is tested in the laboratory. A second page is exactly like this one, except labeled “Unknown Q-1”, will receive observations as the unknown mixture is tested in the laboratory. The numbers in parentheses are the step numbers from the lab manual. These numbers should always be included when a step from the lab manual is to be used.
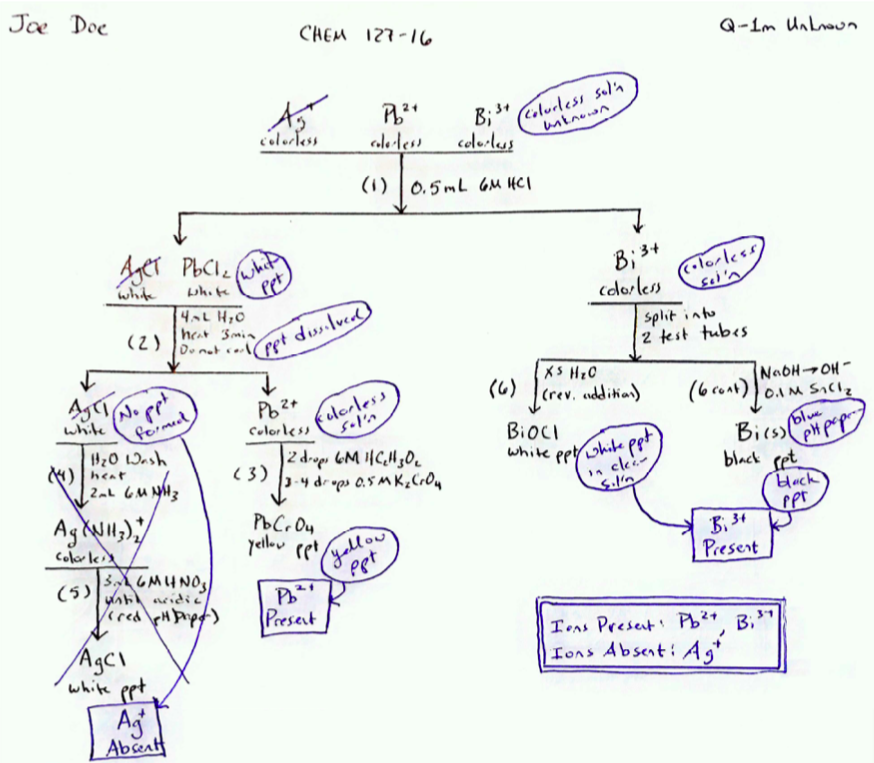
Figure \(\PageIndex{2}\): A sample notebook page showing observations (circled) recorded on the skeleton flow chart for the Q-1 unknown. This sheet shows the laboratory notebook page as it might appear after the student has dated it and Q-1 unknown was tested in the laboratory. Note the boxed summary statements indicate the results and should be written prior to having the results checked by your instructor.
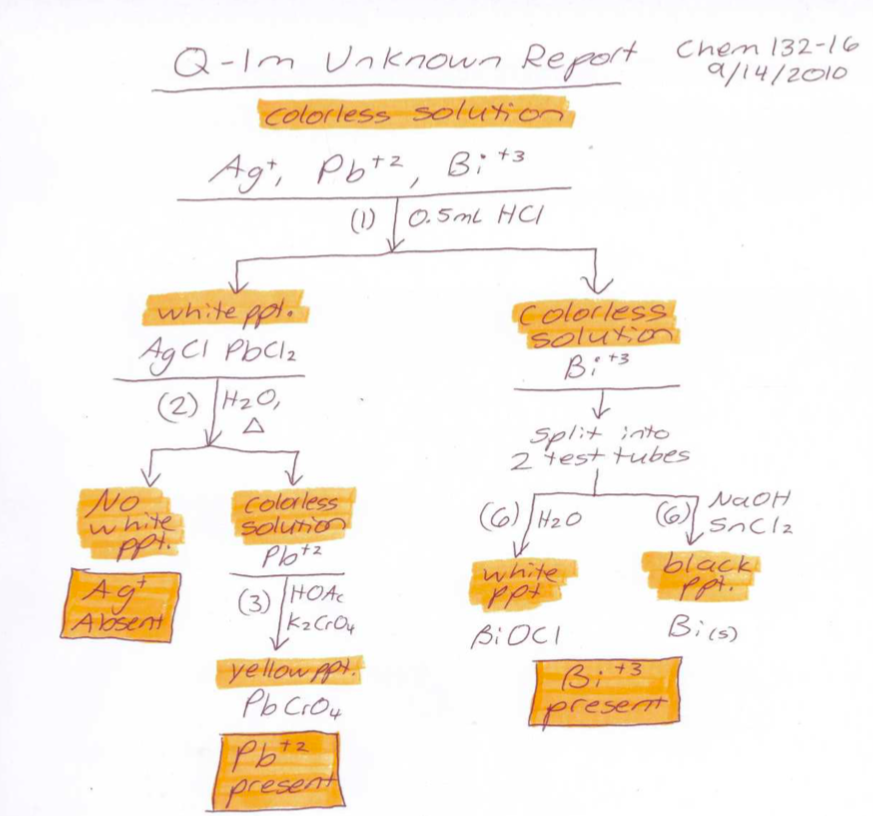
Figure \(\PageIndex{3}\): A sample report flowchart for Q-1. **Note that the observations precede the formula of the species formed.
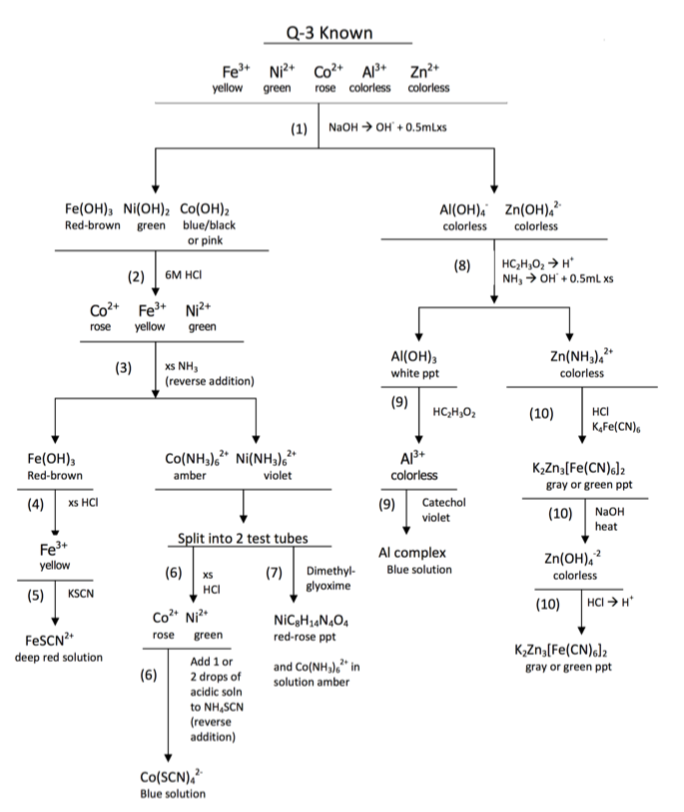
Figure \(\PageIndex{4}\): A model skeleton flowchart for Q-3. A copy of this flowchart should be prepared in your laboratory notebook before coming to lab. It is ready to receive the observations as the known is tested in the laboratory. A similar page will receive the observations as the unknown is tested in the laboratory.
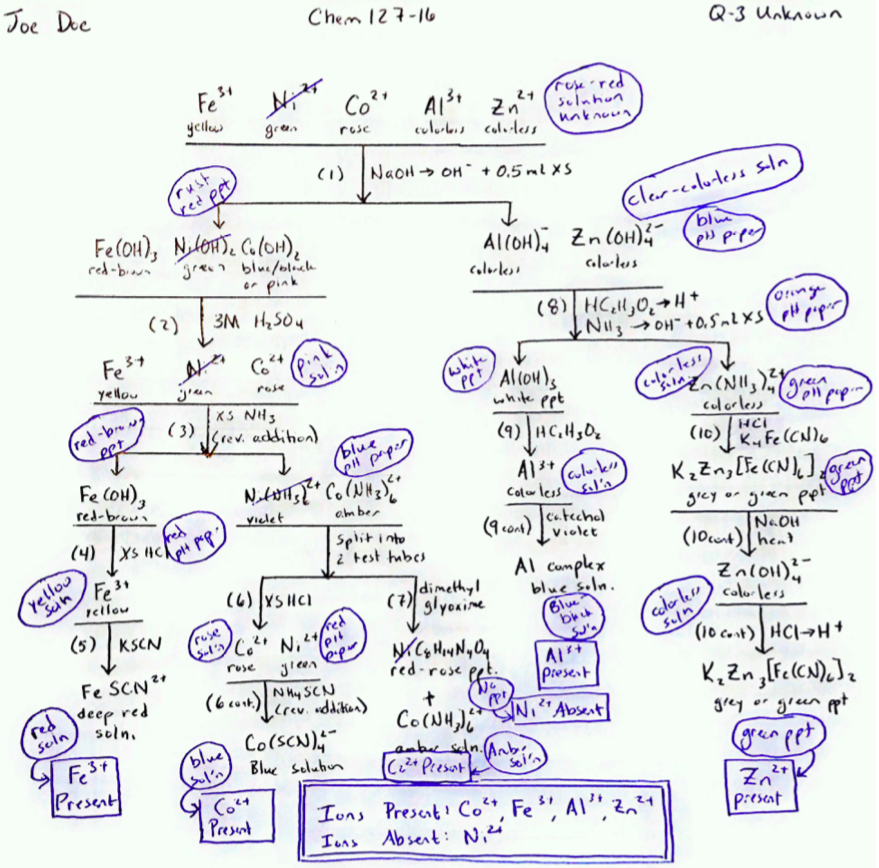
Figure \(\PageIndex{5}\): A sample notebook page showing observations (circled) recorded on the skeleton flow chart for Q-3. This sheet shows the laboratory notebook page as it might appear after the student has dated it and recorded observations made as the unknown Q-3 was tested in the laboratory. Note the boxed summary statements indicate the results and should be written prior to having the results checked by your instructor.
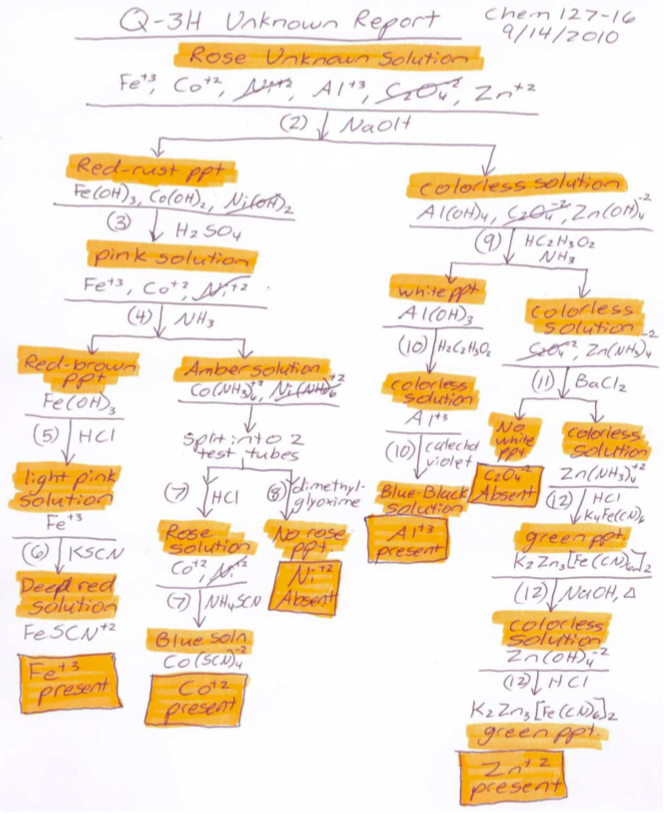
Figure \(\PageIndex{6}\): A sample report flowchart for Q-3. *Note that the observations precede the formula of the species formed.

