
Raman Spectroscopy
- Page ID
- 148443
\( \newcommand{\vecs}[1]{\overset { \scriptstyle \rightharpoonup} {\mathbf{#1}} } \)
\( \newcommand{\vecd}[1]{\overset{-\!-\!\rightharpoonup}{\vphantom{a}\smash {#1}}} \)
\( \newcommand{\dsum}{\displaystyle\sum\limits} \)
\( \newcommand{\dint}{\displaystyle\int\limits} \)
\( \newcommand{\dlim}{\displaystyle\lim\limits} \)
\( \newcommand{\id}{\mathrm{id}}\) \( \newcommand{\Span}{\mathrm{span}}\)
( \newcommand{\kernel}{\mathrm{null}\,}\) \( \newcommand{\range}{\mathrm{range}\,}\)
\( \newcommand{\RealPart}{\mathrm{Re}}\) \( \newcommand{\ImaginaryPart}{\mathrm{Im}}\)
\( \newcommand{\Argument}{\mathrm{Arg}}\) \( \newcommand{\norm}[1]{\| #1 \|}\)
\( \newcommand{\inner}[2]{\langle #1, #2 \rangle}\)
\( \newcommand{\Span}{\mathrm{span}}\)
\( \newcommand{\id}{\mathrm{id}}\)
\( \newcommand{\Span}{\mathrm{span}}\)
\( \newcommand{\kernel}{\mathrm{null}\,}\)
\( \newcommand{\range}{\mathrm{range}\,}\)
\( \newcommand{\RealPart}{\mathrm{Re}}\)
\( \newcommand{\ImaginaryPart}{\mathrm{Im}}\)
\( \newcommand{\Argument}{\mathrm{Arg}}\)
\( \newcommand{\norm}[1]{\| #1 \|}\)
\( \newcommand{\inner}[2]{\langle #1, #2 \rangle}\)
\( \newcommand{\Span}{\mathrm{span}}\) \( \newcommand{\AA}{\unicode[.8,0]{x212B}}\)
\( \newcommand{\vectorA}[1]{\vec{#1}} % arrow\)
\( \newcommand{\vectorAt}[1]{\vec{\text{#1}}} % arrow\)
\( \newcommand{\vectorB}[1]{\overset { \scriptstyle \rightharpoonup} {\mathbf{#1}} } \)
\( \newcommand{\vectorC}[1]{\textbf{#1}} \)
\( \newcommand{\vectorD}[1]{\overrightarrow{#1}} \)
\( \newcommand{\vectorDt}[1]{\overrightarrow{\text{#1}}} \)
\( \newcommand{\vectE}[1]{\overset{-\!-\!\rightharpoonup}{\vphantom{a}\smash{\mathbf {#1}}}} \)
\( \newcommand{\vecs}[1]{\overset { \scriptstyle \rightharpoonup} {\mathbf{#1}} } \)
\(\newcommand{\longvect}{\overrightarrow}\)
\( \newcommand{\vecd}[1]{\overset{-\!-\!\rightharpoonup}{\vphantom{a}\smash {#1}}} \)
\(\newcommand{\avec}{\mathbf a}\) \(\newcommand{\bvec}{\mathbf b}\) \(\newcommand{\cvec}{\mathbf c}\) \(\newcommand{\dvec}{\mathbf d}\) \(\newcommand{\dtil}{\widetilde{\mathbf d}}\) \(\newcommand{\evec}{\mathbf e}\) \(\newcommand{\fvec}{\mathbf f}\) \(\newcommand{\nvec}{\mathbf n}\) \(\newcommand{\pvec}{\mathbf p}\) \(\newcommand{\qvec}{\mathbf q}\) \(\newcommand{\svec}{\mathbf s}\) \(\newcommand{\tvec}{\mathbf t}\) \(\newcommand{\uvec}{\mathbf u}\) \(\newcommand{\vvec}{\mathbf v}\) \(\newcommand{\wvec}{\mathbf w}\) \(\newcommand{\xvec}{\mathbf x}\) \(\newcommand{\yvec}{\mathbf y}\) \(\newcommand{\zvec}{\mathbf z}\) \(\newcommand{\rvec}{\mathbf r}\) \(\newcommand{\mvec}{\mathbf m}\) \(\newcommand{\zerovec}{\mathbf 0}\) \(\newcommand{\onevec}{\mathbf 1}\) \(\newcommand{\real}{\mathbb R}\) \(\newcommand{\twovec}[2]{\left[\begin{array}{r}#1 \\ #2 \end{array}\right]}\) \(\newcommand{\ctwovec}[2]{\left[\begin{array}{c}#1 \\ #2 \end{array}\right]}\) \(\newcommand{\threevec}[3]{\left[\begin{array}{r}#1 \\ #2 \\ #3 \end{array}\right]}\) \(\newcommand{\cthreevec}[3]{\left[\begin{array}{c}#1 \\ #2 \\ #3 \end{array}\right]}\) \(\newcommand{\fourvec}[4]{\left[\begin{array}{r}#1 \\ #2 \\ #3 \\ #4 \end{array}\right]}\) \(\newcommand{\cfourvec}[4]{\left[\begin{array}{c}#1 \\ #2 \\ #3 \\ #4 \end{array}\right]}\) \(\newcommand{\fivevec}[5]{\left[\begin{array}{r}#1 \\ #2 \\ #3 \\ #4 \\ #5 \\ \end{array}\right]}\) \(\newcommand{\cfivevec}[5]{\left[\begin{array}{c}#1 \\ #2 \\ #3 \\ #4 \\ #5 \\ \end{array}\right]}\) \(\newcommand{\mattwo}[4]{\left[\begin{array}{rr}#1 \amp #2 \\ #3 \amp #4 \\ \end{array}\right]}\) \(\newcommand{\laspan}[1]{\text{Span}\{#1\}}\) \(\newcommand{\bcal}{\cal B}\) \(\newcommand{\ccal}{\cal C}\) \(\newcommand{\scal}{\cal S}\) \(\newcommand{\wcal}{\cal W}\) \(\newcommand{\ecal}{\cal E}\) \(\newcommand{\coords}[2]{\left\{#1\right\}_{#2}}\) \(\newcommand{\gray}[1]{\color{gray}{#1}}\) \(\newcommand{\lgray}[1]{\color{lightgray}{#1}}\) \(\newcommand{\rank}{\operatorname{rank}}\) \(\newcommand{\row}{\text{Row}}\) \(\newcommand{\col}{\text{Col}}\) \(\renewcommand{\row}{\text{Row}}\) \(\newcommand{\nul}{\text{Nul}}\) \(\newcommand{\var}{\text{Var}}\) \(\newcommand{\corr}{\text{corr}}\) \(\newcommand{\len}[1]{\left|#1\right|}\) \(\newcommand{\bbar}{\overline{\bvec}}\) \(\newcommand{\bhat}{\widehat{\bvec}}\) \(\newcommand{\bperp}{\bvec^\perp}\) \(\newcommand{\xhat}{\widehat{\xvec}}\) \(\newcommand{\vhat}{\widehat{\vvec}}\) \(\newcommand{\uhat}{\widehat{\uvec}}\) \(\newcommand{\what}{\widehat{\wvec}}\) \(\newcommand{\Sighat}{\widehat{\Sigma}}\) \(\newcommand{\lt}{<}\) \(\newcommand{\gt}{>}\) \(\newcommand{\amp}{&}\) \(\definecolor{fillinmathshade}{gray}{0.9}\)Student authors: Angus Unruh 2018 & Kate Meyers 2019
How Raman spectroscopy works
Raman Spectroscopy is performed by shining a light on a sample and measuring the intensity and wavenumber the scattered light. Most of the scattered light will be of the same intensity as the incident beam, but a small percentage will be different due to excited electrons that do not relax back to their original energy state.
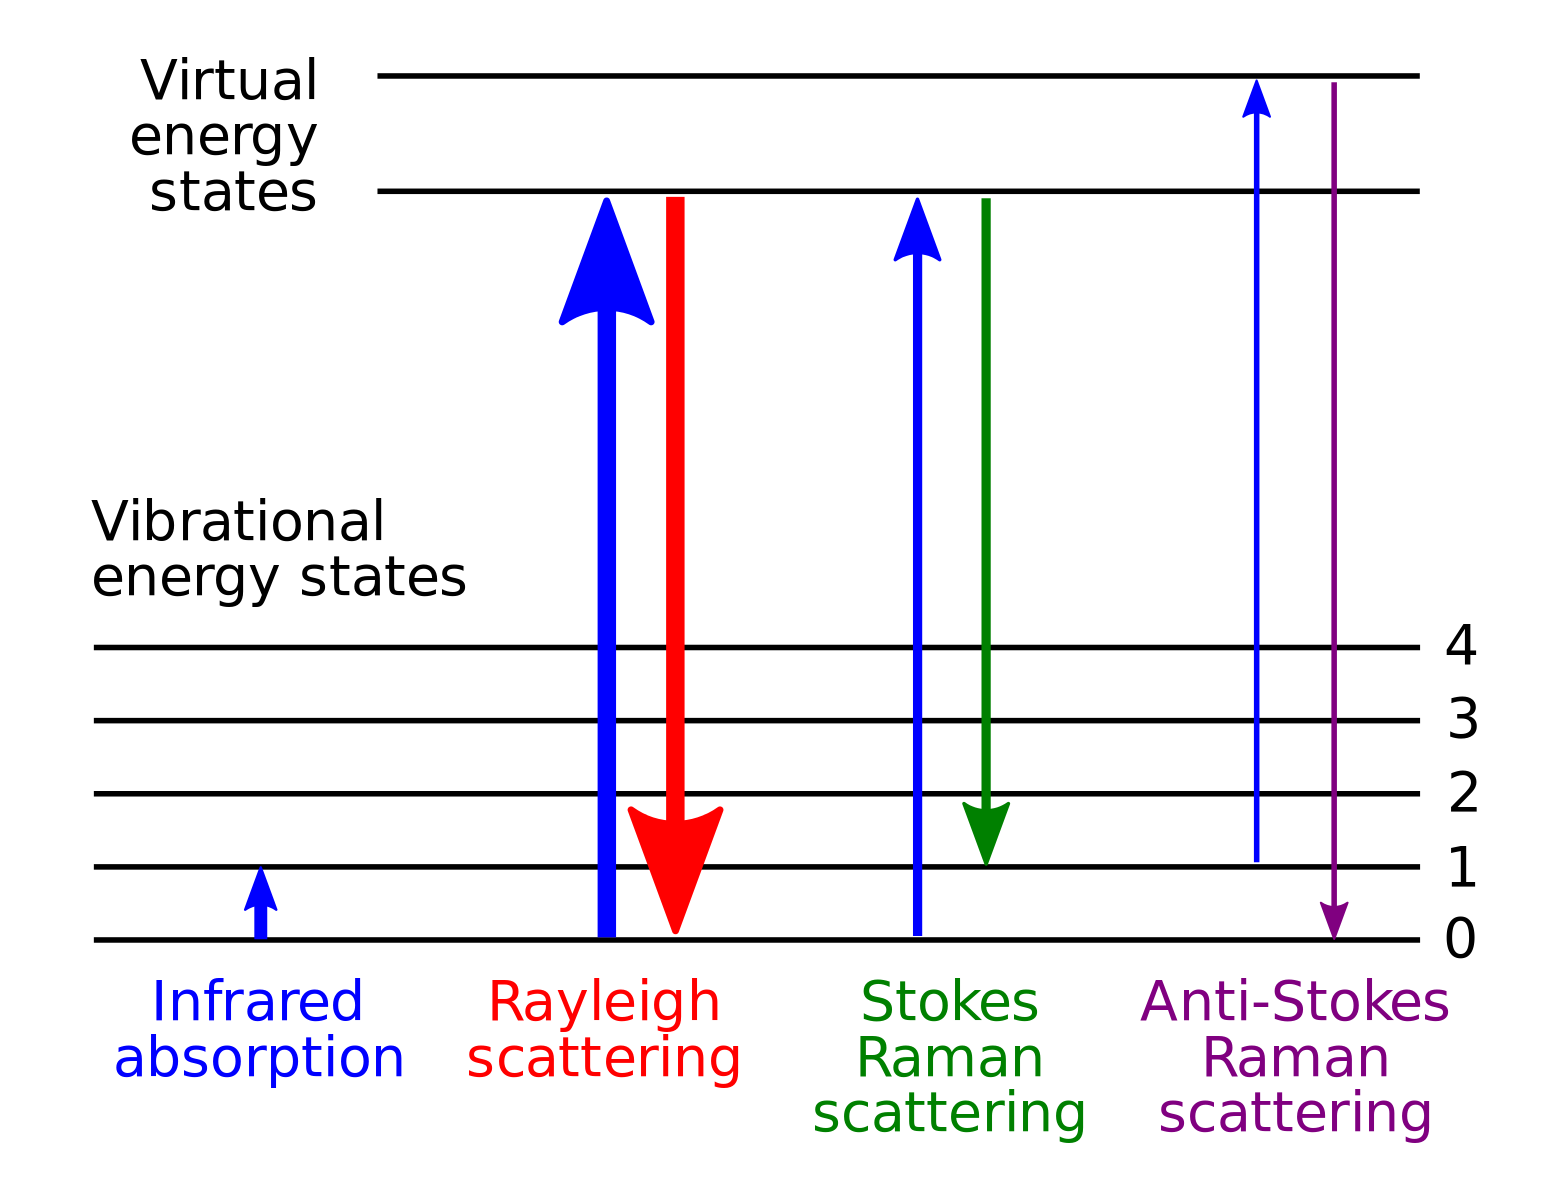
Figure Used under the Creative Commons Attribution Share Alike 3.0 License
Instead of relaxing back down to the ground state, electrons can relax to different energy levels caused by the vibrational modes of the molecules. This is similar to IR spectroscopy. By measuring the difference in initial photon and emitted photon the exact energy level of the vibrational mode can be determined.
Advantages
- Low/no sample prep
- Raman does not alter or damage sample in any way
- Water produces very little signal (can do Raman on aqueous solutions)
- Larger range: Good for both inorganic and organic compounds
- Raman typically produces sharper peaks with less noise
- spectra are highly specific to different materials
Disadvantages
- Not appropriate for fluorescent materials
- Highly sensitive (and expensive) instrumentation required for analysis
- Can't be used for alloys or metals
How to read the spectra
Once the energy/frequency of the vibrational modes is recorded, they can be graphed compared to intensity.
Example 1: Me3SiCl and MeHSiCl2
Here is a Raman of Me3SiCl and MeHSiCl2
and
- Each of the peaks represents a specific vibrational mode of the molecule
- The spectra are unique to each molecule/compound. A fingerprint.
- But, as seen above, similar compounds will have some vibrational modes in common so they will likely share some similar peaks.
- The intensity of the peaks is directly proportional to the number of molecules that create the band.
- This allows for one to quantitatively measure the concentration of molecules.
Basically, Raman can be read like an IR, where characteristic peaks/bands are identified and used to qualitatively characterize the components of a molecule.
Example 2:
It is especially useful for characterizing inorganic compounds, aqueous solutions, or samples that you do not want to damage. A notable example of a sample that can only be reasonably be characterized with Raman is oil paintings
“Synthetic organic pigments of the 20th and 21st century relevant to artist's paints: Raman spectra reference collection”
https://www.sciencedirect.com/science/article/pii/S138614250800646X
https://doi.org/10.1016/j.saa.2008.11.029
Most oil paints, such as those used in the renaissance era, were made by combining organic oil with ground up inorganic and organic pigments
- If an important painting, such as the Mona Lisa were to be restored the exact pigment mixture would be needed in order to match the original color
- With Raman spectroscopy, paints can be analyzed without damaging priceless works of art
- In the above paper over 170 pigments from important paintings and paints were analyzed in order to develop a reference guide to be used for restorations.
In the above figure, a paint sample from a notable painting was analyzed through Raman and matched to a pigment present in the database they developed. It also shows the FTIR spectra of the same unknown paint and its pigment match, demonstrating the superiority of Raman to be used in this kind of analysis.
The above table is an example of the library developed using Raman spectroscopy. The notable peaks were marked and bolded to help differentiate between similar structures. Raman spectroscopy has very little noise and produces bands that are narrow enough to differentiate between the second and fourth structures, even though they only differ by two C-Cl bonds, by identifying the single very strong peak at 1337 on the fourth structure.