
4.5: Problems
- Page ID
- 379472

\( \newcommand{\vecs}[1]{\overset { \scriptstyle \rightharpoonup} {\mathbf{#1}} } \)
\( \newcommand{\vecd}[1]{\overset{-\!-\!\rightharpoonup}{\vphantom{a}\smash {#1}}} \)
\( \newcommand{\id}{\mathrm{id}}\) \( \newcommand{\Span}{\mathrm{span}}\)
( \newcommand{\kernel}{\mathrm{null}\,}\) \( \newcommand{\range}{\mathrm{range}\,}\)
\( \newcommand{\RealPart}{\mathrm{Re}}\) \( \newcommand{\ImaginaryPart}{\mathrm{Im}}\)
\( \newcommand{\Argument}{\mathrm{Arg}}\) \( \newcommand{\norm}[1]{\| #1 \|}\)
\( \newcommand{\inner}[2]{\langle #1, #2 \rangle}\)
\( \newcommand{\Span}{\mathrm{span}}\)
\( \newcommand{\id}{\mathrm{id}}\)
\( \newcommand{\Span}{\mathrm{span}}\)
\( \newcommand{\kernel}{\mathrm{null}\,}\)
\( \newcommand{\range}{\mathrm{range}\,}\)
\( \newcommand{\RealPart}{\mathrm{Re}}\)
\( \newcommand{\ImaginaryPart}{\mathrm{Im}}\)
\( \newcommand{\Argument}{\mathrm{Arg}}\)
\( \newcommand{\norm}[1]{\| #1 \|}\)
\( \newcommand{\inner}[2]{\langle #1, #2 \rangle}\)
\( \newcommand{\Span}{\mathrm{span}}\) \( \newcommand{\AA}{\unicode[.8,0]{x212B}}\)
\( \newcommand{\vectorA}[1]{\vec{#1}} % arrow\)
\( \newcommand{\vectorAt}[1]{\vec{\text{#1}}} % arrow\)
\( \newcommand{\vectorB}[1]{\overset { \scriptstyle \rightharpoonup} {\mathbf{#1}} } \)
\( \newcommand{\vectorC}[1]{\textbf{#1}} \)
\( \newcommand{\vectorD}[1]{\overrightarrow{#1}} \)
\( \newcommand{\vectorDt}[1]{\overrightarrow{\text{#1}}} \)
\( \newcommand{\vectE}[1]{\overset{-\!-\!\rightharpoonup}{\vphantom{a}\smash{\mathbf {#1}}}} \)
\( \newcommand{\vecs}[1]{\overset { \scriptstyle \rightharpoonup} {\mathbf{#1}} } \)
\( \newcommand{\vecd}[1]{\overset{-\!-\!\rightharpoonup}{\vphantom{a}\smash {#1}}} \)
\(\newcommand{\avec}{\mathbf a}\) \(\newcommand{\bvec}{\mathbf b}\) \(\newcommand{\cvec}{\mathbf c}\) \(\newcommand{\dvec}{\mathbf d}\) \(\newcommand{\dtil}{\widetilde{\mathbf d}}\) \(\newcommand{\evec}{\mathbf e}\) \(\newcommand{\fvec}{\mathbf f}\) \(\newcommand{\nvec}{\mathbf n}\) \(\newcommand{\pvec}{\mathbf p}\) \(\newcommand{\qvec}{\mathbf q}\) \(\newcommand{\svec}{\mathbf s}\) \(\newcommand{\tvec}{\mathbf t}\) \(\newcommand{\uvec}{\mathbf u}\) \(\newcommand{\vvec}{\mathbf v}\) \(\newcommand{\wvec}{\mathbf w}\) \(\newcommand{\xvec}{\mathbf x}\) \(\newcommand{\yvec}{\mathbf y}\) \(\newcommand{\zvec}{\mathbf z}\) \(\newcommand{\rvec}{\mathbf r}\) \(\newcommand{\mvec}{\mathbf m}\) \(\newcommand{\zerovec}{\mathbf 0}\) \(\newcommand{\onevec}{\mathbf 1}\) \(\newcommand{\real}{\mathbb R}\) \(\newcommand{\twovec}[2]{\left[\begin{array}{r}#1 \\ #2 \end{array}\right]}\) \(\newcommand{\ctwovec}[2]{\left[\begin{array}{c}#1 \\ #2 \end{array}\right]}\) \(\newcommand{\threevec}[3]{\left[\begin{array}{r}#1 \\ #2 \\ #3 \end{array}\right]}\) \(\newcommand{\cthreevec}[3]{\left[\begin{array}{c}#1 \\ #2 \\ #3 \end{array}\right]}\) \(\newcommand{\fourvec}[4]{\left[\begin{array}{r}#1 \\ #2 \\ #3 \\ #4 \end{array}\right]}\) \(\newcommand{\cfourvec}[4]{\left[\begin{array}{c}#1 \\ #2 \\ #3 \\ #4 \end{array}\right]}\) \(\newcommand{\fivevec}[5]{\left[\begin{array}{r}#1 \\ #2 \\ #3 \\ #4 \\ #5 \\ \end{array}\right]}\) \(\newcommand{\cfivevec}[5]{\left[\begin{array}{c}#1 \\ #2 \\ #3 \\ #4 \\ #5 \\ \end{array}\right]}\) \(\newcommand{\mattwo}[4]{\left[\begin{array}{rr}#1 \amp #2 \\ #3 \amp #4 \\ \end{array}\right]}\) \(\newcommand{\laspan}[1]{\text{Span}\{#1\}}\) \(\newcommand{\bcal}{\cal B}\) \(\newcommand{\ccal}{\cal C}\) \(\newcommand{\scal}{\cal S}\) \(\newcommand{\wcal}{\cal W}\) \(\newcommand{\ecal}{\cal E}\) \(\newcommand{\coords}[2]{\left\{#1\right\}_{#2}}\) \(\newcommand{\gray}[1]{\color{gray}{#1}}\) \(\newcommand{\lgray}[1]{\color{lightgray}{#1}}\) \(\newcommand{\rank}{\operatorname{rank}}\) \(\newcommand{\row}{\text{Row}}\) \(\newcommand{\col}{\text{Col}}\) \(\renewcommand{\row}{\text{Row}}\) \(\newcommand{\nul}{\text{Nul}}\) \(\newcommand{\var}{\text{Var}}\) \(\newcommand{\corr}{\text{corr}}\) \(\newcommand{\len}[1]{\left|#1\right|}\) \(\newcommand{\bbar}{\overline{\bvec}}\) \(\newcommand{\bhat}{\widehat{\bvec}}\) \(\newcommand{\bperp}{\bvec^\perp}\) \(\newcommand{\xhat}{\widehat{\xvec}}\) \(\newcommand{\vhat}{\widehat{\vvec}}\) \(\newcommand{\uhat}{\widehat{\uvec}}\) \(\newcommand{\what}{\widehat{\wvec}}\) \(\newcommand{\Sighat}{\widehat{\Sigma}}\) \(\newcommand{\lt}{<}\) \(\newcommand{\gt}{>}\) \(\newcommand{\amp}{&}\) \(\definecolor{fillinmathshade}{gray}{0.9}\)1. Identify the anode and the cathode for the following electrochemical cells, and identify the oxidation or the reduction reaction at each electrode.
(a) Pt| FeCl2 (aq, 0.015), FeCl3 (aq, 0.045) || AgNO3 (aq, 0.1) | Ag
(b) Ag | AgBr(s), NaBr (aq, 1.0) || CdCl2 (aq, 0.05) | Cd
(c) Pb | PbSO4 (s), H2SO4 (aq, 1.5) || H2SO4 (aq, 2.0), PbSO4 (s) | PbO2
2. Calculate the potential for each electrochemical cell in problem 1. The values in parentheses are the activities of the associated species.
3. Calculate the activity of KI, x, in the following electrochemical cell if the potential is +0.294 V.
Ag | AgCl (s), NaCl (aq, 0.1) || KI (aq, x), I2 (s) | Pt
4. What reaction prevents us from using Zn as an electrode of the first kind in an acidic solution? Which other metals do you expect to behave in the same manner as Zn when immersed in an acidic solution?
5. Creager and colleagues designed a salicylate ion-selective electrode using a PVC membrane impregnated with tetraalkylammonium salicylate [Creager, S. E.; Lawrence, K. D.; Tibbets, C. R. J. Chem. Educ. 1995, 72, 274–276]. To determine the ion-selective electrode’s selectivity coefficient for benzoate, they prepared a set of salicylate calibration standards in which the concentration of benzoate was held constant at 0.10 M. Using the following data, determine the value of the selectivity coefficient.
| [salicylate] (M) | potential (mV) |
|---|---|
| 1.0 | 20.2 |
| \(1.0 \times 10^{-1}\) | 73.5 |
| \(1.0 \times 10^{-2}\) | 126 |
| \(1.0 \times 10^{-3}\) | 168 |
| \(1.0 \times 10^{-4}\) | 182 |
| \(1.0 \times 10^{-5}\) | 182 |
| \(1.0 \times 10^{-6}\) | 177 |
What is the maximum acceptable concentration of benzoate if you plan to use this ion-selective electrode to analyze a sample that contains as little as 10–5 M salicylate with an accuracy of better than 1%?
6. Watanabe and co-workers described a new membrane electrode for the determination of cocaine, a weak base alkaloid with a pKa of 8.64 [Watanabe, K.; Okada, K.; Oda, H.; Furuno, K.; Gomita, Y.; Katsu, T. Anal. Chim. Acta 1995, 316, 371–375]. The electrode’s response for a fixed concentration of cocaine is independent of pH in the range of 1–8, but decreases sharply above a pH of 8. Offer an explanation for this pH dependency.
7. Figure 11.2.14 shows a schematic diagram for an enzyme electrode that responds to urea by using a gas-sensing NH3 electrode to measure the amount of ammonia released following the enzyme’s reaction with urea. In turn, the NH3 electrode uses a pH electrode to monitor the change in pH due to the ammonia. The response of the urea electrode is given by equation 11.2.12. Beginning with equation 11.2.19, which gives the potential of a pH electrode, show that equation 11.2.12 for the urea electrode is correct.
8. Explain why the response of an NH3-based urea electrode (Figure 11.2.14 and equation 11.2.12) is different from the response of a urea electrode in which the enzyme is coated on the glass membrane of a pH electrode (Figure 11.2.15 and equation 11.2.13).
9. A potentiometric electrode for HCN uses a gas-permeable membrane, a buffered internal solution of 0.01 M KAg(CN)2, and a Ag2S ISE electrode that is immersed in the internal solution. Consider the equilibrium reactions that take place within the internal solution and derive an equation that relates the electrode’s potential to the concentration of HCN in the sample. To check your work, search on-line for US Patent 3859191 and consult Figure 2.
10. Mifflin and associates described a membrane electrode for the quantitative analysis of penicillin in which the enzyme penicillinase is immobilized in a polyacrylamide gel coated on the glass membrane of a pH electrode [Mifflin, T. E.; Andriano, K. M.; Robbins, W. B. J. Chem. Educ. 1984, 61, 638–639]. The following data were collected using a set of penicillin standards.
| [penicillin] (M) | potential (mV) |
|---|---|
| \(1.0 \times 10^{-2}\) | 220 |
| \(2.0 \times 10^{-3}\) | 204 |
| \(1.0 \times 10^{-3}\) | 190 |
| \(2.0 \times 10^{-4}\) | 153 |
| \(1.0 \times 10^{-4}\) | 135 |
| \(1.0 \times 10^{-5}\) | 96 |
| \(1.0 \times 10^{-6}\) | 80 |
(a) Over what range of concentrations is there a linear response?
(b) What is the calibration curve’s equation for this concentration range?
(c) What is the concentration of penicillin in a sample that yields a potential of 142 mV?
11. An ion-selective electrode can be placed in a flow cell into which we inject samples or standards. As the analyte passes through the cell, a potential spike is recorded instead of a steady-state potential. The concentration of K+ in serum has been determined in this fashion using standards prepared in a matrix of 0.014 M NaCl [Meyerhoff, M. E.; Kovach, P. M. J. Chem. Educ. 1983, 9, 766–768].
| [K+] (mM) | E (arb. units) | [K+] (mM) | E (arb. units) |
|---|---|---|---|
| 0.10 | 25.5 | 0.60 | 58.7 |
| 0.20 | 37.2 | 0.80 | 64.0 |
| 0.40 | 50.8 | 1.00 | 66.8 |
A 1.00-mL sample of serum is diluted to volume in a 10-mL volumetric flask and analyzed, giving a potential of 51.1 (arbitrary units). Report the concentration of K+ in the sample of serum.
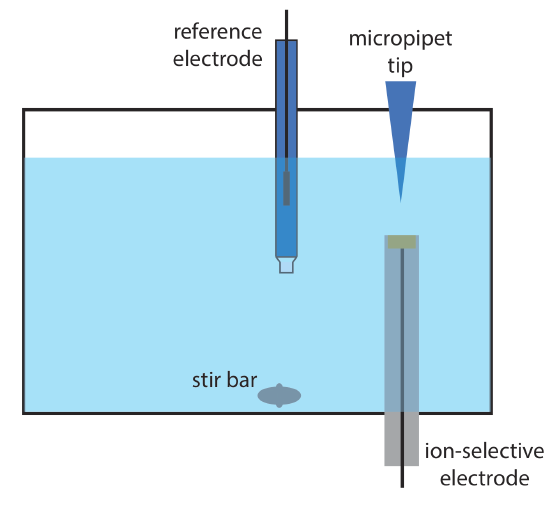
12. Wang and Taha described an interesting application of potentiometry, which they call batch injection [Wang, J.; Taha, Z. Anal. Chim. Acta 1991, 252, 215–221]. As shown in the figure below, an ion-selective electrode is placed in an inverted position in a large volume tank, and a fixed volume of a sample or a standard solution is injected toward the electrode’s surface using a micropipet. The response of the electrode is a spike in potential that is proportional to the analyte’s concentration. The following data were collected using a pH electrode and a set of pH standards.
| pH | potential (mV) |
|---|---|
| 2.0 | +300 |
| 3.0 | +240 |
| 4.0 | +168 |
| 5.0 | +81 |
| 6.0 | +35 |
| 8.0 | –92 |
| 9.0 | –168 |
| 10.0 | –235 |
| 11.0 | –279 |
Determine the pH of the following samples given the recorded peak potentials: tomato juice, 167 mV; tap water, –27 mV; coffee, 122 mV.
13. The concentration of \(\text{NO}_3^-\) in a water sample is determined by a one-point standard addition using a \(\text{NO}_3^-\) ion-selective electrode. A 25.00-mL sample is placed in a beaker and a potential of 0.102 V is measured. A 1.00-mL aliquot of a 200.0-mg/L standard solution of \(\text{NO}_3^-\) is added, after which the potential is 0.089 V. Report the mg \(\text{NO}_3^-\)/L in the water sample.
14. In 1977, when I was an undergraduate student at Knox College, my lab partner and I completed an experiment to determine the concentration of fluoride in tap water and the amount of fluoride in toothpaste. The data in this problem are from my lab notebook.
(a) To analyze tap water, we took three 25.0-mL samples and added 25.0 mL of TISAB to each. We measured the potential of each solution using a F– ISE and an SCE reference electrode. Next, we made five 1.00-mL additions of a standard solution of 100.0 ppm F– to each sample, and measured the potential after each addition, recording the potential three times.
| mL of standard added | potential (mV), replicate 1 | potential (mV), replicate 2 | potential (mV), replicate 3 |
|---|---|---|---|
| 0.00 | –79 | –82 | –83 |
| 1.00 | –119 | –119 | –118 |
| 2.00 | –133 | –133 | –133 |
| 3.00 | –142 | –142 | –142 |
| 4.00 | –149 | –148 | –148 |
| 5.00 | –154 | –153 | –153 |
Report the parts-per-million of F– in the tap water.
(b) To analyze the toothpaste, we measured 0.3619 g into a 100-mL volumetric flask, added 50.0 mL of TISAB, and diluted to volume with distilled water. After we ensured that the sample was thoroughly mixed, we transferred three 20.0-mL portions into separate beakers and measured the potential of each using a F– ISE and an SCE reference electrode. Next, we made five 1.00-mL additions of a standard solution of 100.0 ppm F– to each sample, and measured the potential after each addition, recording the potential three times.
| mL of standard added | potential (mV), replicate 1 | potential (mV), replicate 2 | potential (mV), replicate 3 |
| 0.00 | –55 | –54 | –55 |
| 1.00 | –82 | –82 | –83 |
| 2.00 | –94 | –94 | –94 |
| 3.00 | –102 | –103 | –102 |
| 4.00 | –108 | –108 | –109 |
| 5.00 | –112 | –112 | –113 |
Report the parts-per-million F– in the toothpaste.
15. You are responsible for determining the amount of KI in iodized salt and decide to use an I– ion-selective electrode. Describe how you would perform this analysis using external standards and how you would per-form this analysis using the method of standard additions.
16. Explain why each of the following decreases the analysis time in controlled-potential coulometry: a larger surface area for the working electrode; a smaller volume of solution; and a faster stirring rate.
17. The purity of a sample of picric acid, C6H3N3O7, is determined by controlled-potential coulometry, converting picric acid to triaminophenol, C6H9N3O.
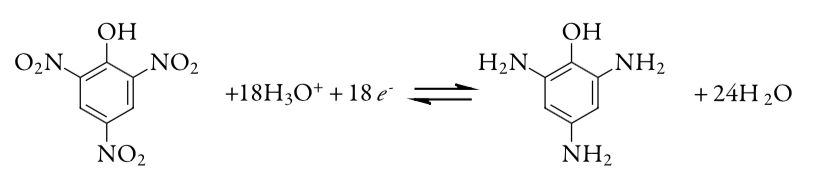
A 0.2917-g sample of picric acid is placed in a 1000-mL volumetric flask and diluted to volume. A 10.00-mL portion of this solution is transferred to a coulometric cell and sufficient water added so that the Pt cathode is immersed. An exhaustive electrolysis of the sample re-quires 21.67 C of charge. Report the purity of the picric acid.
18. The concentration of H2S in the drainage from an abandoned mine is determined by a coulometric titration using KI as a mediator and \(\text{I}_3^-\) as the titrant.
\[\text{H}_{2}\text{S}(a q)+\ \mathrm{I}_{3}^{-}(a q)+2 \mathrm{H}_{2} \mathrm{O}(l)\rightleftharpoons2 \mathrm{H}_{3} \mathrm{O}^{+}(a q)+3 \mathrm{I}^{-}(a q)+\mathrm{S}(s) \nonumber\]
A 50.00-mL sample of water is placed in a coulometric cell, along with an excess of KI and a small amount of starch as an indicator. Electrolysis is carried out at a constant current of 84.6 mA, requiring 386 s to reach the starch end point. Report the concentration of H2S in the sample in μg/mL.
19. One method for the determination of a given mass of H3AsO3 is a coulometric titration using \(\text{I}_3^-\) as a titrant. The relevant standard-state reactions and potentials are summarized here
\[\begin{aligned} \mathrm{H}_{3} \mathrm{AsO}_{4}(a q)+2 \mathrm{H}^{+}(a q)+2 \mathrm{e}^{-} &\rightleftharpoons \ \mathrm{H}_{3} \mathrm{AsO}_{3}(a q)+\ \mathrm{H}_{2} \mathrm{O}(l) \\ \mathrm{I}_{3}^{-}(a q)+2 \mathrm{e}^{-} &\rightleftharpoons 3 \mathrm{I}^{-}(a q) \end{aligned} \nonumber\]
with standard state reduction potentials of, respectively, +0.559 V and +0.536 V. Explain why the coulometric titration is carried out in a neutral solution (pH ≈ 7) instead of in a strongly acidic solution (pH < 0).
20. The production of adiponitrile, NC(CH2)4CN, from acrylonitrile, CH2=CHCN, is an important industrial process. A 0.594-g sample of acrylonitrile is placed in a 1-L volumetric flask and diluted to volume. An exhaustive controlled-potential electrolysis of a 1.00-mL portion of the diluted acrylonitrile requires 1.080 C of charge. What is the value of n for the reduction of acrylonitrile to adiponitrile?
21. The linear-potential scan hydrodynamic voltammogram for a mixture of Fe2+ and Fe3+ is shown in the figure below where il,a and il,c are the anodic and cathodic limiting currents.
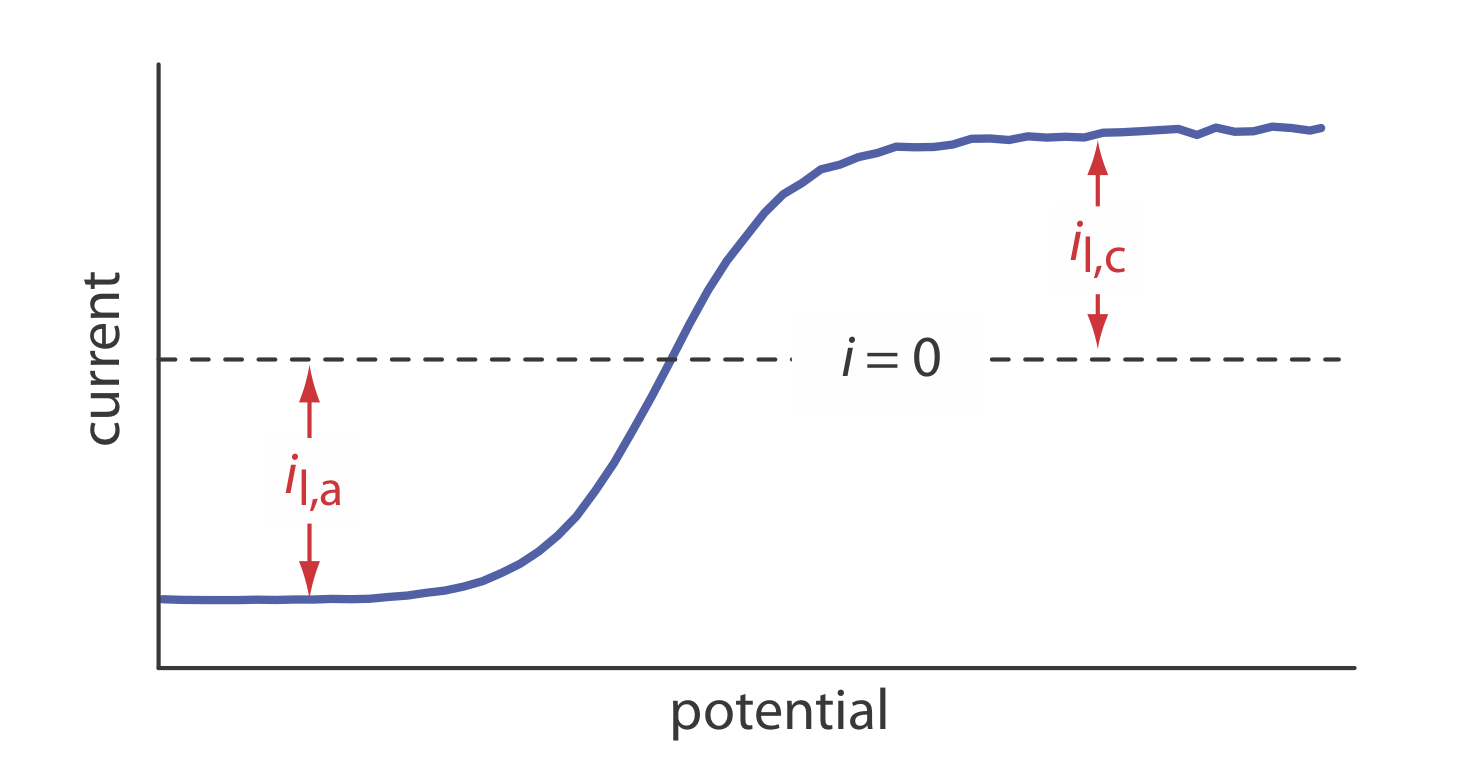
(a) Show that the potential is given by
\[E = E_{\text{Fe}^{3+}/\text{Fe}^{2+}}^{\circ} - 0.05916 \log \frac {K_{\text{Fe}^{3+}}} {K_{\text{Fe}^{2+}}} - 0.05916 \log \frac {i - i_{l,a}}{i_{l,c} - i} \nonumber\]
(b) What is the potential when i = 0 for a solution that is 0.100 mM Fe3+ and 0.050 mM Fe2+?
22. The amount of sulfur in aromatic monomers is determined by differential pulse polarography. Standard solutions are prepared for analysis by dissolving 1.000 mL of the purified monomer in 25.00 mL of an electrolytic solvent, adding a known amount of sulfur, deaerating, and measuring the peak current. The following results were obtained for a set of calibration standards.
| µg S added | peak current (µA) |
|---|---|
| 0 | 0.14 |
| 28 | 0.70 |
| 56 | 1.23 |
| 112 | 2.41 |
| 168 | 3.42 |
Analysis of a 1.000-mL sample, treated in the same manner as the standards, gives a peak current of 1.77 μA. Report the mg S/mL in the sample.
23. The purity of a sample of K3Fe(CN)6 is determined using linear-potential scan hydrodynamic voltammetry at a glassy carbon electrode. The following data were obtained for a set of external calibration standards.
| [K3Fe(CN)6] (mM) | limiting current (µA) |
|---|---|
| 2.0 | 127 |
| 4.0 | 252 |
| 6.0 | 376 |
| 8.0 | 500 |
| 10.0 | 624 |
A sample of impure K3Fe(CN)6 is prepared for analysis by diluting a 0.246-g portion to volume in a 100-mL volumetric flask. The limiting current for the sample is 444 μA. Report the purity of this sample of K3Fe(CN)6.
24. One method for determining whether an individual recently fired a gun is to look for traces of antimony in residue collected from the individual’s hands. Anodic stripping voltammetry at a mercury film electrode is ideally suited for this analysis. In a typical analysis a sample is collected from a suspect using a cotton-tipped swab wetted with 5% v/v HNO3. After returning to the lab, the swab is placed in a vial that contains 5.0 mL of 4 M HCl that is 0.02 M in hydrazine sulfate. After soaking the swab, a 4.0-mL portion of the solution is transferred to an electrochemical cell along with 100 μL of 0.01 M HgCl2. After depositing the thin film of mercury and the antimony, the stripping step gives a peak current of 0.38 μA. After adding a standard addition of 100 μL of \(5.00 \times 10^2\) ppb Sb, the peak current increases to 1.14 μA. How many nanograms of Sb were collected from the suspect’s hand?
25. Zinc is used as an internal standard in an analysis of thallium by differential pulse polarography. A standard solution of \(5.00 \times 10^{-5}\) M Zn2+ and \(2.50 \times 10^{-5}\) M Tl+ has peak currents of 5.71 μA and 3.19 μA, respectively. An 8.713-g sample of a zinc-free alloy is dissolved in acid, transferred to a 500-mL volumetric flask, and diluted to volume. A 25.0-mL portion of this solution is mixed with 25.0 mL of \(5.00 \times 10^{-4}\) M Zn2+. Analysis of this solution gives peak currents of 12.3 μA and of 20.2 μA for Zn2+ and Tl+, respectively. Report the %w/w Tl in the alloy.
26. Differential pulse voltammetry at a carbon working electrode is used to determine the concentrations of ascorbic acid and caffeine in drug formulations [Lau, O.; Luk, S.; Cheung, Y. Analyst 1989, 114, 1047–1051]. In a typical analysis a 0.9183-g tablet is crushed and ground into a fine powder. A 0.5630-g sample of this powder is transferred to a 100-mL volumetric flask, brought into solution, and diluted to volume. A 0.500-mL portion of this solution is then transferred to a voltammetric cell that contains 20.00 mL of a suitable supporting electrolyte. The resulting voltammogram gives peak currents of 1.40 μA and 3.88 μA for ascorbic acid and for caffeine, respectively. A 0.500-mL aliquot of a standard solution that contains 250.0 ppm ascorbic acid and 200.0 ppm caffeine is then added. A voltammogram of this solution gives peak currents of 2.80 μA and 8.02 μA for ascorbic acid and caffeine, respectively. Report the milligrams of ascorbic acid and milligrams of caffeine in the tablet.
27. Ratana-ohpas and co-workers described a stripping analysis method for determining tin in canned fruit juices [Ratana-ohpas, R.; Kanatharana, P.; Ratana-ohpas, W.; Kongsawasdi, W. Anal. Chim. Acta 1996, 333, 115–118]. Standards of 50.0 ppb Sn4+, 100.0 ppb Sn4+, and 150.0 ppb Sn4+ were analyzed giving peak currents (arbitrary units) of 83.0, 171.6, and 260.2, respectively. A 2.00-mL sample of lychee juice is mixed with 20.00 mL of 1:1 HCl/HNO3. A 0.500-mL portion of this mixture is added to 10 mL of 6 M HCl and the volume adjusted to 30.00 mL. Analysis of this diluted sample gave a signal of 128.2 (arbitrary units). Report the parts-per-million Sn4+ in the original sample of lychee juice.
28. Sittampalam and Wilson described the preparation and use of an amperometric sensor for glucose [Sittampalam, G.; Wilson, G. S. J. Chem. Educ. 1982, 59, 70–73]. The sensor is calibrated by measuring the steady-state current when it is immersed in standard solutions of glucose. A typical set of calibration data is shown here.
| [glucose] (mg/100 mL) | current (arb. units) |
|---|---|
| 2.0 | 17.2 |
| 4.0 | 32.9 |
| 6.0 | 52.1 |
| 8.0 | 68.0 |
| 10.0 | 85.8 |
A 2.00-mL sample is diluted to 10 mL in a volumetric flask and a steady-state current of 23.6 (arbitrary units) is measured. What is the concentration of glucose in the sample in mg/100 mL?
29. Differential pulse polarography is used to determine the concentrations of lead, thallium, and indium in a mixture. Because the peaks for lead and thallium, and for thallium and indium overlap, a simultaneous analysis is necessary. Peak currents (in arbitrary units) at –0.385 V, –0.455 V, and –0.557 V are measured for a single standard solution, and for a sample, giving the results shown in the following table. Report the mg/mL of Pb2+, Tl+ and In3+ in the sample.
| analyte | [standard] (µg/mL) | peak current at –0.385 V | peak current at –0.455 V | peak current at –0.557 V |
|---|---|---|---|---|
| Pb2+ | 1.0 | 26.1 | 2.9 | 0 |
| Tl+ | 2.0 | 7.8 | 23.5 | 3.2 |
| In3+ | 0.4 | 0 | 0 | 22.9 |
| sample | 60.6 | 28.8 | 54.1 | |
30. Abass and co-workers developed an amperometric biosensor for \(\text{NH}_4^+\) that uses the enzyme glutamate dehydrogenase to catalyze the following reaction
\[2 \text { - oxyglutarate }(a q)+ \ \mathrm{NH}_{4}^{+}(a q)+\mathrm{NADH}(a q)\rightleftharpoons\text { glutamate }(a q)+\ \mathrm{NAD}^{+}(a q)+\ \mathrm{H}_{2} \mathrm{O}(l) \nonumber\]
where NADH is the reduced form of nicotinamide adenine dinucleotide [Abass, A. K.; Hart, J. P.; Cowell, D. C.; Chapell, A. Anal. Chim. Acta 1988, 373, 1–8]. The biosensor actually responds to the concentration of NADH, however, the rate of the reaction depends on the concentration of \(\text{NH}_4^+\). If the initial concentrations of 2-oxyglutarate and NADH are the same for all samples and standards, then the signal is proportional to the concentration of \(\text{NH}_4^+\). As shown in the following table, the sensitivity of the method is dependent on pH.
| pH | sensitivity (nA S–1 M–1) |
|---|---|
| 6.2 | \(1.67 \times 10^3\) |
| 6.75 | \(5.00 \times 10^3\) |
| 7.3 | \(9.33 \times 10^3\) |
| 7.7 | \(1.04 \times 10^4\) |
| 8.3 | \(1.27 \times 10^4\) |
| 9.3 | \(2.67 \times 10^3\) |
Two possible explanations for the effect of pH on the sensitivity of this analysis are the acid–base chemistry of \(\text{NH}_4^+\) and the acid–base chemistry of the enzyme. Given that the pKa for \(\text{NH}_4^+\) is 9.244, explain the source of this pH-dependent sensitivity.
31. The speciation scheme for trace metals in Table 11.4.2 divides them into seven operationally defined groups by collecting and analyzing two samples following each of four treatments, requiring a total of eight samples and eight measurements. After removing insoluble particulates by filtration (treatment 1), the solution is analyzed for the concentration of ASV labile metals and for the total concentration of metals. A portion of the filtered solution is then passed through an ion-exchange column (treatment 2), and the concentrations of ASV metal and of total metal are determined. A second portion of the filtered solution is irradiated with UV light (treatment 3), and the concentrations of ASV metal and of total metal are measured. Finally, a third portion of the filtered solution is irradiated with UV light and passed through an ion-exchange column (treatment 4), and the concentrations of ASV labile metal and of total metal again are determined. The groups that are included in each measurement are summarized in the following table.
| treatment | groups removed by treatement | groups contributing to ASV-labile metals | groups contributing to total metals |
|---|---|---|---|
| 1 | none | I, II, III | I, II, III, IV, V, VI, VII |
| 2 | I, IV, V | II, III | II, III, V1, VII |
| 3 | none | I, II, III, IV, VI | I, II, III, IV, V, VI, VII |
| 4 | I, II, IV, V, VI | III | III, VII |
(a) Explain how you can use these eight measurements to determine the concentration of metals present in each of the seven groups identified in Table 11.4.2.
(b) Batley and Florence report the following results for the speciation of cadmium, lead, and copper in a sample of seawater [Batley, G. E.; Florence, T. M. Anal. Lett. 1976, 9, 379–388]. Determine the speciation of each metal in comment on your results.
|
measurement treatement: ASV-labile or total |
ppb Cd2+ | ppb Pb2+ | ppb Cu2+ |
|---|---|---|---|
| 1: ASV-labile | 0.24 | 0.39 | 0.26 |
| 2: total | 0.28 | 0.50 | 0.40 |
| 2: ASV-labile | 0.21 | 0.33 | 0.17 |
| 2: total | 0.26 | 0.43 | 0.24 |
| 3: ASV-labile | 0.26 | 0.37 | 0.33 |
| 3: total | 0.28 | 0.5 | 0.43 |
| 4: ASV-labile | 0.00 | 0.00 | 0.00 |
| 4: total | 0.02 | 0.12 | 0.10 |
32. The concentration of Cu2+ in seawater is determined by anodic stripping voltammetry at a hanging mercury drop electrode after first releasing any copper bound to organic matter. To a 20.00-mL sample of seawater is added 1 mL of 0.05 M HNO3 and 1 mL of 0.1% H2O2. The sample is irradiated with UV light for 8 hr and then diluted to volume in a 25-mL volumetric flask. Deposition of Cu2+ takes place at –0.3 V versus an SCE for 10 min, producing a peak current of 26.1 (arbitrary units). A second 20.00-mL sample of the seawater is treated identically, except that 0.1 mL of a 5.00 μM solution of Cu2+ is added, producing a peak current of 38.4 (arbitrary units). Report the concentration of Cu2+ in the seawater in mg/L.
33. Thioamide drugs are determined by cathodic stripping analysis [Davidson, I. E.; Smyth, W. F. Anal. Chem. 1977, 49, 1195–1198]. Deposition occurs at +0.05 V versus an SCE. During the stripping step the potential is scanned cathodically and a stripping peak is observed at –0.52 V. In a typical application a 2.00-mL sample of urine is mixed with 2.00 mL of a pH 4.78 buffer. Following a 2.00 min deposition, a peak current of 0.562 μA is measured. A 0.10-mL addition of a 5.00 μM solution of the drug is added to the same solution. A peak current of 0.837 μA is recorded using the same deposition and stripping conditions. Report the drug’s molar concentration in the urine sample.
34. The concentration of vanadium (V) in sea water is determined by adsorptive stripping voltammetry after forming a complex with catechol [van der Berg, C. M. G.; Huang, Z. Q. Anal. Chem. 1984, 56, 2383–2386]. The catechol-V(V) complex is deposited on a hanging mercury drop electrode at a potential of –0.1 V versus a Ag/AgCl reference electrode. A cathodic potential scan gives a stripping peak that is proportional to the concentration of V(V). The following standard additions are used to analyze a sample of seawater.
| [V (V)]added (M) | peak current (µA) |
|---|---|
|
\(2.0 \times 10^{-8}\) |
24 |
| \(4.0 \times 10^{-8}\) | 33 |
| \(8.0 \times 10^{-8}\) | 52 |
| \(1.2 \times 10^{-7}\) | 69 |
| \(1.8 \times 10^{-7}\) | 97 |
| \(2.8 \times 10^{-7}\) | 140 |
Determine the molar concentration of V (V) in the sample of sea water, assuming that the standard additions result in a negligible change in the sample’s volume.
35. The standard-state reduction potential for Cu2+ to Cu is +0.342 V versus the SHE. Given that Cu2+ forms a very stable complex with the ligand EDTA, do you expect that the standard-state reduction potential for Cu(EDTA)2– is greater than +0.342 V, less than +0.342 V, or equal to +0.342 V? Explain your reasoning.
36. The polarographic half-wave potentials (versus the SCE) for Pb2+ and for Tl+ in 1 M HCl are, respectively, –0.44 V and –0.45 V. In an electrolyte of 1 M NaOH, however, the half-wave potentials are –0.76 V for Pb2+ and –0.48 V for Tl+. Why does the change in electrolyte have such a significant effect on the half-wave potential for Pb2+, but not on the half-wave potential for Tl+?
37. The following data for the reduction of Pb2+ were collected by normal-pulse polarography.
| potential (V vs. SCE) | current (µA) |
|---|---|
| –0.345 | 0.16 |
| –0.370 | 0.98 |
| –0.383 | 2.05 |
| –0.393 | 3.13 |
| –0.409 | 4.62 |
| –0.420 | 5.16 |
The limiting current was 5.67 μA. Verify that the reduction reaction is reversible and determine values for n and E1/2. The half-wave potentials for the normal-pulse polarograms of Pb2+ in the presence of several different concentrations of OH– are shown in the following table.
| [OH–] (M) | \(E_{1/2}\) (V vs. SCE) | [OH–] (M) | \(E_{1/2}\) (V vs. SCE) |
|---|---|---|---|
| 0.050 | –0.646 | 0.150 | –0.689 |
| 0.100 | –0.673 | 0.300 | –0.715 |
Determine the stoichiometry of the Pb-hydroxide complex and its formation constant.
38. In 1977, when I was an undergraduate student at Knox College, my lab partner and I completed an experiment to study the voltammetric behavior of Cd2+ (in 0.1 M KNO3) and Ni2+ (in 0.2 M KNO3) at a dropping mercury electrode. The data in this problem are from my lab notebook. All potentials are relative to an SCE reference electrode.
| potential for Cd2+ (V) | current for Cd2+ (µA) | potential for Ni2+ (V) | current for Ni2+ (µA) |
|---|---|---|---|
| –0.60 | 4.5 | –1.07 | 1.90 |
| –0.58 | 3.4 | –1.05 | 1.75 |
| –0.56 | 2.1 | –1.03 | 1.50 |
| –0.54 | 0.6 | –1.02 | 1.25 |
| –0.52 | 0.2 | –1.00 | 1.00 |
The limiting currents for Cd2+ was 4.8 μA and that for Ni2+ was 2.0 μA. Evaluate the electrochemical reversibility for each metal ion and comment on your results.
39. Baldwin and co-workers report the following data from a cyclic voltammetry study of the electrochemical behavior of p-phenylenediamine in a pH 7 buffer [Baldwin, R. P.; Ravichandran, K.; Johnson, R. K. J. Chem. Educ. 1984, 61, 820–823]. All potentials are measured relative to an SCE.
| scan rate (mV/s) | Ep,a (V) | Ep,c (V) | ip,a (mA) | ip,c (mA) |
| 2 | 0.148 | 0.104 | 0.34 | 0.30 |
| 5 | 0.149 | 0.098 | 0.56 | 0.53 |
| 10 | 0.152 | 0.095 | 1.00 | 0.04 |
| 20 | 0.161 | 0.095 | 1.44 | 1.44 |
| 50 | 0.167 | 0.082 | 2.12 | 1.81 |
| 100 | 0.180 | 0.063 | 2.50 | 2.19 |
The initial scan is toward more positive potentials, leading to the oxidation reaction shown here.
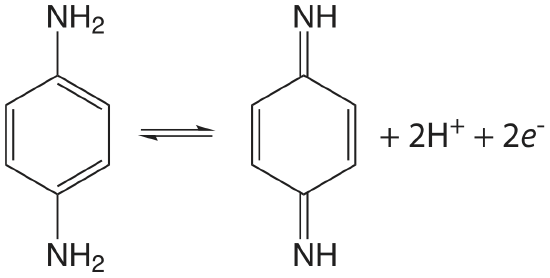
Use this data to show that the reaction is electrochemically irreversible. A reaction may show electrochemical irreversibility because of slow electron transfer kinetics or because the product of the oxidation reaction participates in a chemical reaction that produces an nonelectroactive species. Based on the data in this problem, what is the likely source of p-phenylenediamine’s electrochemical irreversibility?