
5.4: Gibbs Energy
- Page ID
- 191408

\( \newcommand{\vecs}[1]{\overset { \scriptstyle \rightharpoonup} {\mathbf{#1}} } \)
\( \newcommand{\vecd}[1]{\overset{-\!-\!\rightharpoonup}{\vphantom{a}\smash {#1}}} \)
\( \newcommand{\dsum}{\displaystyle\sum\limits} \)
\( \newcommand{\dint}{\displaystyle\int\limits} \)
\( \newcommand{\dlim}{\displaystyle\lim\limits} \)
\( \newcommand{\id}{\mathrm{id}}\) \( \newcommand{\Span}{\mathrm{span}}\)
( \newcommand{\kernel}{\mathrm{null}\,}\) \( \newcommand{\range}{\mathrm{range}\,}\)
\( \newcommand{\RealPart}{\mathrm{Re}}\) \( \newcommand{\ImaginaryPart}{\mathrm{Im}}\)
\( \newcommand{\Argument}{\mathrm{Arg}}\) \( \newcommand{\norm}[1]{\| #1 \|}\)
\( \newcommand{\inner}[2]{\langle #1, #2 \rangle}\)
\( \newcommand{\Span}{\mathrm{span}}\)
\( \newcommand{\id}{\mathrm{id}}\)
\( \newcommand{\Span}{\mathrm{span}}\)
\( \newcommand{\kernel}{\mathrm{null}\,}\)
\( \newcommand{\range}{\mathrm{range}\,}\)
\( \newcommand{\RealPart}{\mathrm{Re}}\)
\( \newcommand{\ImaginaryPart}{\mathrm{Im}}\)
\( \newcommand{\Argument}{\mathrm{Arg}}\)
\( \newcommand{\norm}[1]{\| #1 \|}\)
\( \newcommand{\inner}[2]{\langle #1, #2 \rangle}\)
\( \newcommand{\Span}{\mathrm{span}}\) \( \newcommand{\AA}{\unicode[.8,0]{x212B}}\)
\( \newcommand{\vectorA}[1]{\vec{#1}} % arrow\)
\( \newcommand{\vectorAt}[1]{\vec{\text{#1}}} % arrow\)
\( \newcommand{\vectorB}[1]{\overset { \scriptstyle \rightharpoonup} {\mathbf{#1}} } \)
\( \newcommand{\vectorC}[1]{\textbf{#1}} \)
\( \newcommand{\vectorD}[1]{\overrightarrow{#1}} \)
\( \newcommand{\vectorDt}[1]{\overrightarrow{\text{#1}}} \)
\( \newcommand{\vectE}[1]{\overset{-\!-\!\rightharpoonup}{\vphantom{a}\smash{\mathbf {#1}}}} \)
\( \newcommand{\vecs}[1]{\overset { \scriptstyle \rightharpoonup} {\mathbf{#1}} } \)
\(\newcommand{\longvect}{\overrightarrow}\)
\( \newcommand{\vecd}[1]{\overset{-\!-\!\rightharpoonup}{\vphantom{a}\smash {#1}}} \)
\(\newcommand{\avec}{\mathbf a}\) \(\newcommand{\bvec}{\mathbf b}\) \(\newcommand{\cvec}{\mathbf c}\) \(\newcommand{\dvec}{\mathbf d}\) \(\newcommand{\dtil}{\widetilde{\mathbf d}}\) \(\newcommand{\evec}{\mathbf e}\) \(\newcommand{\fvec}{\mathbf f}\) \(\newcommand{\nvec}{\mathbf n}\) \(\newcommand{\pvec}{\mathbf p}\) \(\newcommand{\qvec}{\mathbf q}\) \(\newcommand{\svec}{\mathbf s}\) \(\newcommand{\tvec}{\mathbf t}\) \(\newcommand{\uvec}{\mathbf u}\) \(\newcommand{\vvec}{\mathbf v}\) \(\newcommand{\wvec}{\mathbf w}\) \(\newcommand{\xvec}{\mathbf x}\) \(\newcommand{\yvec}{\mathbf y}\) \(\newcommand{\zvec}{\mathbf z}\) \(\newcommand{\rvec}{\mathbf r}\) \(\newcommand{\mvec}{\mathbf m}\) \(\newcommand{\zerovec}{\mathbf 0}\) \(\newcommand{\onevec}{\mathbf 1}\) \(\newcommand{\real}{\mathbb R}\) \(\newcommand{\twovec}[2]{\left[\begin{array}{r}#1 \\ #2 \end{array}\right]}\) \(\newcommand{\ctwovec}[2]{\left[\begin{array}{c}#1 \\ #2 \end{array}\right]}\) \(\newcommand{\threevec}[3]{\left[\begin{array}{r}#1 \\ #2 \\ #3 \end{array}\right]}\) \(\newcommand{\cthreevec}[3]{\left[\begin{array}{c}#1 \\ #2 \\ #3 \end{array}\right]}\) \(\newcommand{\fourvec}[4]{\left[\begin{array}{r}#1 \\ #2 \\ #3 \\ #4 \end{array}\right]}\) \(\newcommand{\cfourvec}[4]{\left[\begin{array}{c}#1 \\ #2 \\ #3 \\ #4 \end{array}\right]}\) \(\newcommand{\fivevec}[5]{\left[\begin{array}{r}#1 \\ #2 \\ #3 \\ #4 \\ #5 \\ \end{array}\right]}\) \(\newcommand{\cfivevec}[5]{\left[\begin{array}{c}#1 \\ #2 \\ #3 \\ #4 \\ #5 \\ \end{array}\right]}\) \(\newcommand{\mattwo}[4]{\left[\begin{array}{rr}#1 \amp #2 \\ #3 \amp #4 \\ \end{array}\right]}\) \(\newcommand{\laspan}[1]{\text{Span}\{#1\}}\) \(\newcommand{\bcal}{\cal B}\) \(\newcommand{\ccal}{\cal C}\) \(\newcommand{\scal}{\cal S}\) \(\newcommand{\wcal}{\cal W}\) \(\newcommand{\ecal}{\cal E}\) \(\newcommand{\coords}[2]{\left\{#1\right\}_{#2}}\) \(\newcommand{\gray}[1]{\color{gray}{#1}}\) \(\newcommand{\lgray}[1]{\color{lightgray}{#1}}\) \(\newcommand{\rank}{\operatorname{rank}}\) \(\newcommand{\row}{\text{Row}}\) \(\newcommand{\col}{\text{Col}}\) \(\renewcommand{\row}{\text{Row}}\) \(\newcommand{\nul}{\text{Nul}}\) \(\newcommand{\var}{\text{Var}}\) \(\newcommand{\corr}{\text{corr}}\) \(\newcommand{\len}[1]{\left|#1\right|}\) \(\newcommand{\bbar}{\overline{\bvec}}\) \(\newcommand{\bhat}{\widehat{\bvec}}\) \(\newcommand{\bperp}{\bvec^\perp}\) \(\newcommand{\xhat}{\widehat{\xvec}}\) \(\newcommand{\vhat}{\widehat{\vvec}}\) \(\newcommand{\uhat}{\widehat{\uvec}}\) \(\newcommand{\what}{\widehat{\wvec}}\) \(\newcommand{\Sighat}{\widehat{\Sigma}}\) \(\newcommand{\lt}{<}\) \(\newcommand{\gt}{>}\) \(\newcommand{\amp}{&}\) \(\definecolor{fillinmathshade}{gray}{0.9}\)Learning Objectives
- Define Gibbs free energy, and describe its relation to spontaneity
- Calculate free energy change for a process using free energies of formation for its reactants and products
- Calculate free energy change for a process using enthalpies of formation and the entropies for its reactants and products
- Explain how temperature affects the spontaneity of some processes
- Relate standard free energy changes to equilibrium constants
One of the challenges of using the second law of thermodynamics to determine if a process is spontaneous is that we must determine the entropy change for the system and the entropy change for the surroundings. An alternative approach involving a new thermodynamic property defined in terms of system properties only was introduced in the late nineteenth century by American mathematician Josiah Willard Gibbs. This new property is called the Gibbs free energy change (\(G\)) (or simply the free energy), and it is defined in terms of a system’s enthalpy and entropy as the following:
\[G=H−TS \nonumber\]
Free energy is a state function, and at constant temperature and pressure, the standard free energy change (ΔG°) may be expressed as the following:
\[ΔG=ΔH−TΔS \nonumber\]
(For simplicity’s sake, the subscript “sys” will be omitted henceforth.) We can understand the relationship between this system property and the spontaneity of a process by recalling the previously derived second law expression:
\[ΔS_\ce{univ}=ΔS+\dfrac{q_\ce{surr}}{T} \nonumber \]
The first law requires that \(q_{surr} = −q_{sys}\), and at constant pressure \(q_{sys} = ΔH\), and so this expression may be rewritten as the following:
\[ΔS_\ce{univ}=ΔS−\dfrac{ΔH}{T} \nonumber \]
ΔH is the enthalpy change of the system. Multiplying both sides of this equation by −T, and rearranging yields the following:
\[−TΔS_\ce{univ}=ΔH−TΔS \nonumber\]
Comparing this equation to the previous one for free energy change shows the following relation:
\[ΔG=−TΔS_\ce{univ} \label{6}\]
The free energy change is therefore a reliable indicator of the spontaneity of a process, being directly related to the previously identified spontaneity indicator, \(ΔS_{univ}\). Table \(\PageIndex{1}\) summarizes the relation between the spontaneity of a process and the arithmetic signs of these indicators.
| \(ΔS_{univ} > 0\) | ΔG < 0 | spontaneous |
| \(ΔS_{univ} < 0\) | ΔG > 0 | nonspontaneous |
| \(ΔS_{univ} = 0\) | ΔG = 0 | reversible (at equilibrium) |
Calculating Free Energy Change
Free energy is a state function, so its value depends only on the conditions of the initial and final states of the system that have undergone some change. A convenient and common approach to the calculation of free energy changes for physical and chemical reactions is by use of widely available compilations of standard state thermodynamic data. One method involves the use of standard enthalpies and entropies to compute standard free energy changes according to the following relation as demonstrated in Example \(\PageIndex{1}\).
\[ ΔG°=ΔH°−TΔS° \label{7}\]
Example \(\PageIndex{1}\): Evaluation of ΔG°
Change from ΔH° and ΔS° Use standard enthalpy and entropy data from Tables T1 or T2 to calculate the standard free energy change for the vaporization of water at room temperature (298 K). What does the computed value for ΔG° say about the spontaneity of this process?
Solution
The process of interest is the following:
\[\ce{H2O}(l)⟶\ce{H2O}(g) \label{\(\PageIndex{8}\)} \nonumber\]
The standard change in free energy may be calculated using the following equation:
\[ΔG^\circ_{298}=ΔH°−TΔS° \label{\(\PageIndex{9}\)} \nonumber\]
From Tables T1 or T2, here are the data:
| Substance | \(ΔH^\circ_\ce{f}\ce{(kJ/mol)}\) | \(S^\circ_{298}\textrm{(J/K⋅mol)}\) |
|---|---|---|
| H2O(l) | −286.83 | 70.0 |
| H2O(g) | −241.82 | 188.8 |
Combining at 298 K:
\[\begin{align*} ΔH°&=ΔH^\circ_{298}=ΔH^\circ_\ce{f}(\ce{H2O}(g))−ΔH^\circ_\ce{f}(\ce{H2O}(l)) \\[4pt] &=[−241.82\: kJ−(−285.83)]\:kJ/mol \\[4pt] &=44.01\: kJ/mol \\[4pt] ΔS° &=ΔS^\circ_{298}=S^\circ_{298}(\ce{H2O}(g))−S^\circ_{298}(\ce{H2O}(l)) \\[4pt] &=188.8\:J/mol⋅K−70.0\:J/K \\[4pt] &=118.8\:J/mol⋅K \end{align*}\]
then use Equation \ref{7}:
\[ΔG°=ΔH°−TΔS° \nonumber \]
Converting everything into kJ and combining at 298 K:
\[\begin{align*}ΔG^\circ_{298} &=ΔH°−TΔS° \\[4pt] &=44.01\: kJ/mol−(298\: K×118.8\:J/mol⋅K)×\dfrac{1\: kJ}{1000\: J} \end{align*}\]
\[\mathrm{44.01\: kJ/mol−35.4\: kJ/mol=8.6\: kJ/mol} \nonumber\]
At 298 K (25 °C) \(ΔG^\circ_{298}>0\), and so boiling is nonspontaneous (not spontaneous).
Exercise \(\PageIndex{1}\)
Use standard enthalpy and entropy data from Tables T1 or T2 to calculate the standard free energy change for the reaction shown here (298 K). What does the computed value for ΔG° say about the spontaneity of this process?
\[\ce{C2H6}(g)⟶\ce{H2}(g)+\ce{C2H4}(g) \nonumber\]
- Answer
-
\(ΔG^\circ_{298}=\mathrm{102.0\: kJ/mol}\); the reaction is nonspontaneous (not spontaneous) at 25 °C.
Free energy changes may also use the standard free energy of formation \( (ΔG^\circ_\ce{f})\), for each of the reactants and products involved in the reaction. The standard free energy of formation is the free energy change that accompanies the formation of one mole of a substance from its elements in their standard states. Similar to the standard enthalpies of formation, \( (ΔG^\circ_\ce{f})\) is by definition zero for elemental substances under standard state conditions. The approach to computing the free energy change for a reaction using this approach is the same as that demonstrated previously for enthalpy and entropy changes. For the reaction
\[m\ce{A}+n\ce{B}⟶x\ce{C}+y\ce{D},\]
the standard free energy change at room temperature may be calculated as
\[ \begin{align} ΔG^\circ_{298}&=ΔG° \\[4pt] &=∑νΔG^\circ_{298}(\ce{products})−∑νΔG^\circ_{298}(\ce{reactants})\\[4pt] &=[xΔG^\circ_\ce{f}(\ce{C})+yΔG^\circ_\ce{f}(\ce{D})]−[mΔG^\circ_\ce{f}(\ce{A})+nΔG^\circ_\ce{f}(\ce{B})]. \end{align}\]
Example \(\PageIndex{2}\): Calculation of \(ΔG^\circ_{298}\)
Consider the decomposition of yellow mercury(II) oxide.
\[\ce{HgO}(s,\,\ce{yellow})⟶\ce{Hg}(l)+ \ce{ 1/2 O2(g)} \nonumber\]
Calculate the standard free energy change at room temperature, \(ΔG^\circ_{298}\), using:
- standard free energies of formation and
- standard enthalpies of formation and standard entropies.
Do the results indicate the reaction to be spontaneous or nonspontaneous under standard conditions?
Solution
The required data are available in Tables T1 or T2 and are shown here.
| Compound | \(ΔG^\circ_\ce{f}\:\mathrm{(kJ/mol)}\) | \(ΔH^\circ_\ce{f}\:\mathrm{(kJ/mol)}\) | \(S^\circ_{298}\:\textrm{(J/K⋅mol)}\) |
|---|---|---|---|
| HgO (s, yellow) | −58.43 | −90.46 | 71.13 |
| Hg(l) | 0 | 0 | 75.9 |
| O2(g) | 0 | 0 | 205.2 |
(a) Using free energies of formation:
\[ \begin{align*} ΔG^\circ_{298}&=∑νGS^\circ_{298}(\ce{products})−∑νΔG^\circ_{298}(\ce{reactants}) \\[4pt] &=\left[1ΔG^\circ_{298}\ce{Hg}(l)+\dfrac{1}{2}ΔG^\circ_{298}\ce{O2}(g)\right]−1ΔG^\circ_{298}\ce{HgO}(s,\,\ce{yellow}) \\[4pt] & \mathrm{=\left[1\:mol(0\: kJ/mol)+\dfrac{1}{2}mol(0\: kJ/mol)\right]−1\: mol(−58.43\: kJ/mol)=58.43\: kJ/mol} \end{align*}\]
(b) Using enthalpies and entropies of formation:
\[\begin{align*}ΔH^\circ_{298}&=∑νΔH^\circ_{298}(\ce{products})−∑νΔH^\circ_{298}(\ce{reactants}) \\[4pt] &=\left[1ΔH^\circ_{298}\ce{Hg}(l)+\dfrac{1}{2}ΔH^\circ_{298}\ce{O2}(g)\right]−1ΔH^\circ_{298}\ce{HgO}(s,\,\ce{yellow}) \\[4pt] &\mathrm{=[1\: mol(0\: kJ/mol)+\dfrac{1}{2}mol(0\: kJ/mol)]−1\: mol(−90.46\: kJ/mol)=90.46\: kJ/mol} \\[4pt] ΔS^\circ_{298} &=∑νΔS^\circ_{298}(\ce{products})−∑νΔS^\circ_{298}(\ce{reactants}) \\[4pt] &=\left[1ΔS^\circ_{298}\ce{Hg}(l)+\dfrac{1}{2}ΔS^\circ_{298}\ce{O2}(g)\right]−1ΔS^\circ_{298}\ce{HgO}(s,\,\ce{yellow}) \\[4pt] & \mathrm{=\left[1\: mol(75.9\: J/mol\: K)+\dfrac{1}{2}mol(205.2\: J/mol\: K)\right]−1\: mol(71.13\: J/mol\: K)=107.4\: J/mol\: K} \end{align*}\]
then we can use Equation \ref7} directly:
\[\begin{align*}ΔG°&=ΔH°−TΔS°\\[4pt] &=\mathrm{90.46\: kJ−298.15\: K×107.4\: J/K⋅mol×\dfrac{1\: kJ}{1000\: J}} \\[4pt] &=\mathrm{(90.46−32.01)\:kJ/mol=58.45\: kJ/mol} \end{align*}\]
Both ways to calculate the standard free energy change at 25 °C give the same numerical value (to three significant figures), and both predict that the process is nonspontaneous (not spontaneous) at room temperature.
Exercise \(\PageIndex{2}\)
Calculate ΔG° using (a) free energies of formation and (b) enthalpies of formation and entropies (Tables T1 or T2). Do the results indicate the reaction to be spontaneous or nonspontaneous at 25 °C?
\[\ce{C2H4}(g)⟶\ce{H2}(g)+\ce{C2H2}(g) \nonumber\]
- Answer
-
−141.5 kJ/mol, nonspontaneous
Temperature Dependence of Spontaneity
As was previously demonstrated in this chapter’s section on entropy, the spontaneity of a process may depend upon the temperature of the system. Phase transitions, for example, will proceed spontaneously in one direction or the other depending upon the temperature of the substance in question. Likewise, some chemical reactions can also exhibit temperature dependent spontaneities. To illustrate this concept, the equation relating free energy change to the enthalpy and entropy changes for the process is considered:
\[ ΔG=ΔH−TΔS \]
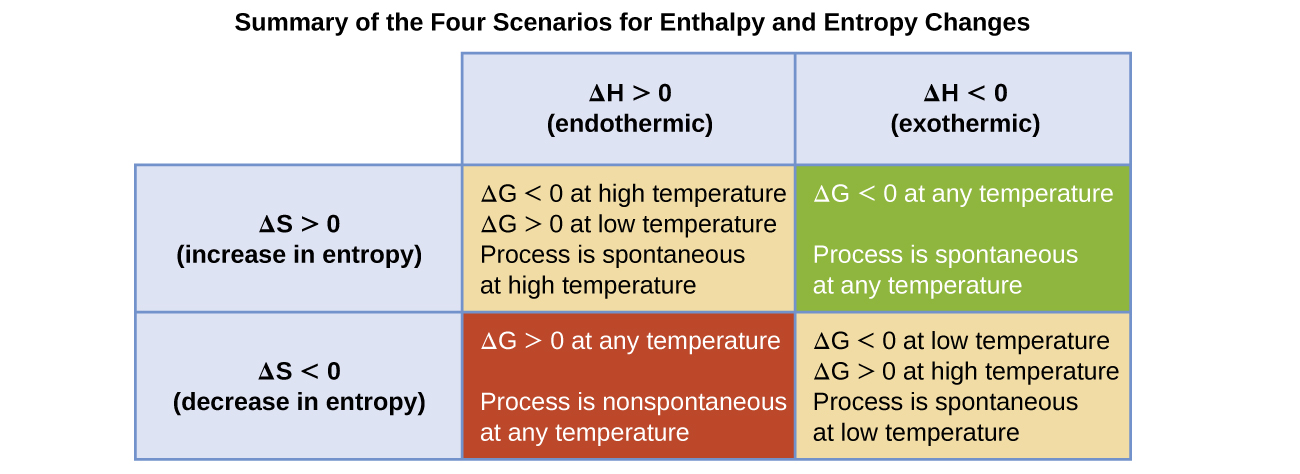
The spontaneity of a process, as reflected in the arithmetic sign of its free energy change, is then determined by the signs of the enthalpy and entropy changes and, in some cases, the absolute temperature. Since T is the absolute (kelvin) temperature, it can only have positive values. Four possibilities therefore exist with regard to the signs of the enthalpy and entropy changes:
- Both ΔH and ΔS are positive. This condition describes an endothermic process that involves an increase in system entropy. In this case, ΔG will be negative if the magnitude of the TΔS term is greater than ΔH. If the TΔS term is less than ΔH, the free energy change will be positive. Such a process is spontaneous at high temperatures and nonspontaneous at low temperatures.
- Both ΔH and ΔS are negative. This condition describes an exothermic process that involves a decrease in system entropy. In this case, ΔG will be negative if the magnitude of the TΔS term is less than ΔH. If the TΔS term’s magnitude is greater than ΔH, the free energy change will be positive. Such a process is spontaneous at low temperatures and nonspontaneous at high temperatures.
- ΔH is positive and ΔS is negative. This condition describes an endothermic process that involves a decrease in system entropy. In this case, ΔG will be positive regardless of the temperature. Such a process is nonspontaneous at all temperatures.
- ΔH is negative and ΔS is positive. This condition describes an exothermic process that involves an increase in system entropy. In this case, ΔG will be negative regardless of the temperature. Such a process is spontaneous at all temperatures.
These four scenarios are summarized in Figure \(\PageIndex{1}\).
Example \(\PageIndex{3}\): Predicting the Temperature Dependence of Spontaneity
The incomplete combustion of carbon is described by the following equation:
\[\ce{2C}(s)+\ce{O2}(g)⟶\ce{2CO}(g) \nonumber\]
How does the spontaneity of this process depend upon temperature?
Solution
Combustion processes are exothermic (\(ΔH < 0\)). This particular reaction involves an increase in entropy due to the accompanying increase in the amount of gaseous species (net gain of one mole of gas, \(ΔS > 0\)). The reaction is therefore spontaneous (\(ΔG < 0\)) at all temperatures.
Exercise \(\PageIndex{3}\)
Popular chemical hand warmers generate heat by the air-oxidation of iron:
How does the spontaneity of this process depend upon temperature?
- Answer
-
ΔH and ΔS are negative; the reaction is spontaneous at low temperatures.
When considering the conclusions drawn regarding the temperature dependence of spontaneity, it is important to keep in mind what the terms “high” and “low” mean. Since these terms are adjectives, the temperatures in question are deemed high or low relative to some reference temperature. A process that is nonspontaneous at one temperature but spontaneous at another will necessarily undergo a change in “spontaneity” (as reflected by its ΔG) as temperature varies. This is clearly illustrated by a graphical presentation of the free energy change equation, in which ΔG is plotted on the y axis versus T on the x axis:
\[ΔG=ΔH−TΔS\]
\[y=b+mx\]
Such a plot is shown in Figure \(\PageIndex{2}\). A process whose enthalpy and entropy changes are of the same arithmetic sign will exhibit a temperature-dependent spontaneity as depicted by the two yellow lines in the plot. Each line crosses from one spontaneity domain (positive or negative ΔG) to the other at a temperature that is characteristic of the process in question. This temperature is represented by the x-intercept of the line, that is, the value of T for which ΔG is zero:
\[ΔG=0=ΔH−TΔS\]
\[T=\dfrac{ΔH}{ΔS}\]
And so, saying a process is spontaneous at “high” or “low” temperatures means the temperature is above or below, respectively, that temperature at which ΔG for the process is zero. As noted earlier, this condition describes a system at equilibrium.

Example \(\PageIndex{4}\): Equilibrium Temperature for a Phase Transition
As defined in the chapter on liquids and solids, the boiling point of a liquid is the temperature at which its solid and liquid phases are in equilibrium (that is, when vaporization and condensation occur at equal rates). Use the information in Tables T1 or T2 to estimate the boiling point of water.
Solution
The process of interest is the following phase change:
When this process is at equilibrium, ΔG = 0, so the following is true:
\[0=ΔH°−TΔS°\hspace{40px}\ce{or}\hspace{40px}T=\dfrac{ΔH°}{ΔS°} \nonumber\]
Using the standard thermodynamic data from Tables T1 or T2,
ΔH°&=ΔH^\circ_\ce{f}(\ce{H2O}(g))−ΔH^\circ_\ce{f}(\ce{H2O}(l)) \nonumber\\
&=\mathrm{−241.82\: kJ/mol−(−285.83\: kJ/mol)=44.01\: kJ/mol} \nonumber
\end{align*}\]
\[\begin{align*}
ΔS°&=ΔS^\circ_{298}(\ce{H2O}(g))−ΔS^\circ_{298}(\ce{H2O}(l))
\nonumber\\
&=\mathrm{188.8\: J/K⋅mol−70.0\: J/K⋅mol=118.8\: J/K⋅mol}
\nonumber
\end{align*}\]
The accepted value for water’s normal boiling point is 373.2 K (100.0 °C), and so this calculation is in reasonable agreement. Note that the values for enthalpy and entropy changes data used were derived from standard data at 298 K (Tables T1 or T2.). If desired, you could obtain more accurate results by using enthalpy and entropy changes determined at (or at least closer to) the actual boiling point.
Exercise \(\PageIndex{4}\)
Use the information in Tables T1 or T2 to estimate the boiling point of CS2.
- Answer
-
313 K (accepted value 319 K)
Free Energy and Equilibrium
The free energy change for a process may be viewed as a measure of its driving force. A negative value for ΔG represents a finite driving force for the process in the forward direction, while a positive value represents a driving force for the process in the reverse direction. When ΔG is zero, the forward and reverse driving forces are equal, and so the process occurs in both directions at the same rate (the system is at equilibrium).
In the chapter on equilibrium the reaction quotient, Q, was introduced as a convenient measure of the status of an equilibrium system. Recall that Q is the numerical value of the mass action expression for the system, and that you may use its value to identify the direction in which a reaction will proceed in order to achieve equilibrium. When Q is lesser than the equilibrium constant, K, the reaction will proceed in the forward direction until equilibrium is reached and Q = K. Conversely, if Q > K, the process will proceed in the reverse direction until equilibrium is achieved.
The free energy change for a process taking place with reactants and products present under nonstandard conditions, ΔG, is related to the standard free energy change, ΔG°, according to this equation:
R is the gas constant (8.314 J/K mol), T is the kelvin or absolute temperature, and Q is the reaction quotient. We may use this equation to predict the spontaneity for a process under any given set of conditions as illustrated in Example \(\PageIndex{1}\).
Example \(\PageIndex{5}\): Calculating ΔG under Nonstandard Conditions
What is the free energy change for the process shown here under the specified conditions?
T = 25 °C, \(P_{\ce{N2}}=\mathrm{0.870\: atm}\), \(P_{\ce{H2}}=\mathrm{0.250\: atm}\), and \(P_{\ce{NH3}}=\mathrm{12.9\: atm}\)
Solution
Equation \ref{eq10A} relates free energy change to standard free energy change and reaction quotient and may be used directly:
\[\begin{align*} ΔG&=ΔG°+RT\ln Q \\[4pt] &=\mathrm{33.0\:\dfrac{kJ}{mol}+\left(8.314\:\dfrac{J}{mol\: K}×298\: K×\ln\dfrac{(0.250^3)×0.870}{12.9^2}\right)}\\[4pt] &=\mathrm{9680\:\dfrac{J}{mol}\:or\: 9.68\: kJ/mol} \end{align*}\]
Since the computed value for ΔG is positive, the reaction is nonspontaneous under these conditions.
Exercise \(\PageIndex{5}\)
Calculate the free energy change for this same reaction at 875 °C in a 5.00 L mixture containing 0.100 mol of each gas. Is the reaction spontaneous under these conditions?
- Answer
-
ΔG = −47 kJ; yes
For a system at equilibrium, Q = K and ΔG = 0, and the Equation \ref{eq10A} may be written as
\[ \underbrace{0=ΔG°+RT\ln K}_{\text{at equilibrium}}\]
\[ΔG°=−RT\ln K \label{eq4A}\]
or alternatively
This form of the equation provides a useful link between these two essential thermodynamic properties, and it can be used to derive equilibrium constants from standard free energy changes and vice versa. The relations between standard free energy changes and equilibrium constants are summarized in Table \(\PageIndex{1}\).
| K | ΔG° | Comments |
|---|---|---|
| < 1 | > 0 | Reactants are more abundant at equilibrium. |
| = 1 | = 0 | Reactants and products are equally abundant at equilibrium. |
| > 1 | < 0 | Products are more abundant at equilibrium. |
Example \(\PageIndex{6}\): Equilibrium Constant using Standard Free Energy Change
Given that the standard free energies of formation of Ag+(aq), Cl−(aq), and AgCl(s) are 77.1 kJ/mol, −131.2 kJ/mol, and −109.8 kJ/mol, respectively, calculate the solubility product, Ksp, for AgCl.
Solution
The reaction of interest is the following:
The standard free energy change for this reaction is first computed using standard free energies of formation for its reactants and products:
\[ \begin{align*} ΔG° =ΔG^\circ_{298} &=[ΔG^\circ_\ce{f}(\ce{Ag+}(aq))+ΔG^\circ_\ce{f}(\ce{Cl-}(aq))]−[ΔG^\circ_\ce{f}(\ce{AgCl}(s))] \\[4pt] &=[77.1\: kJ/mol−131.2\: kJ/mol]−[−109.8\: kJ/mol] \\[4pt] &=55.7\: kJ/mol \end{align*}\]
The equilibrium constant for the reaction may then be derived from its standard free energy change via Equation \ref{eq4B}:
\[\begin{align*} K_\ce{sp}&=e^{−\dfrac{ΔG°}{RT}}=\exp\left(−\dfrac{ΔG°}{RT}\right) \\[4pt] &=\mathrm{\exp\left(−\dfrac{55.7×10^3\:J/mol}{8.314\:J/mol⋅K×298.15\:K}\right)}\\&=\mathrm{\exp(−22.470)=e^{−22.470}=1.74×10^{−10}} \end{align*}\]
Exercise \(\PageIndex{6}\): dissociation of dinitrogen tetroxide
Use the thermodynamic data provided in Tables T1 or T2 to calculate the equilibrium constant for the dissociation of dinitrogen tetroxide at 25 °C.
\[\ce{NO}_{2(g)} \rightleftharpoons \ce{N_2O}_{4(g)} \nonumber\]
- Answer
-
K = 6.9
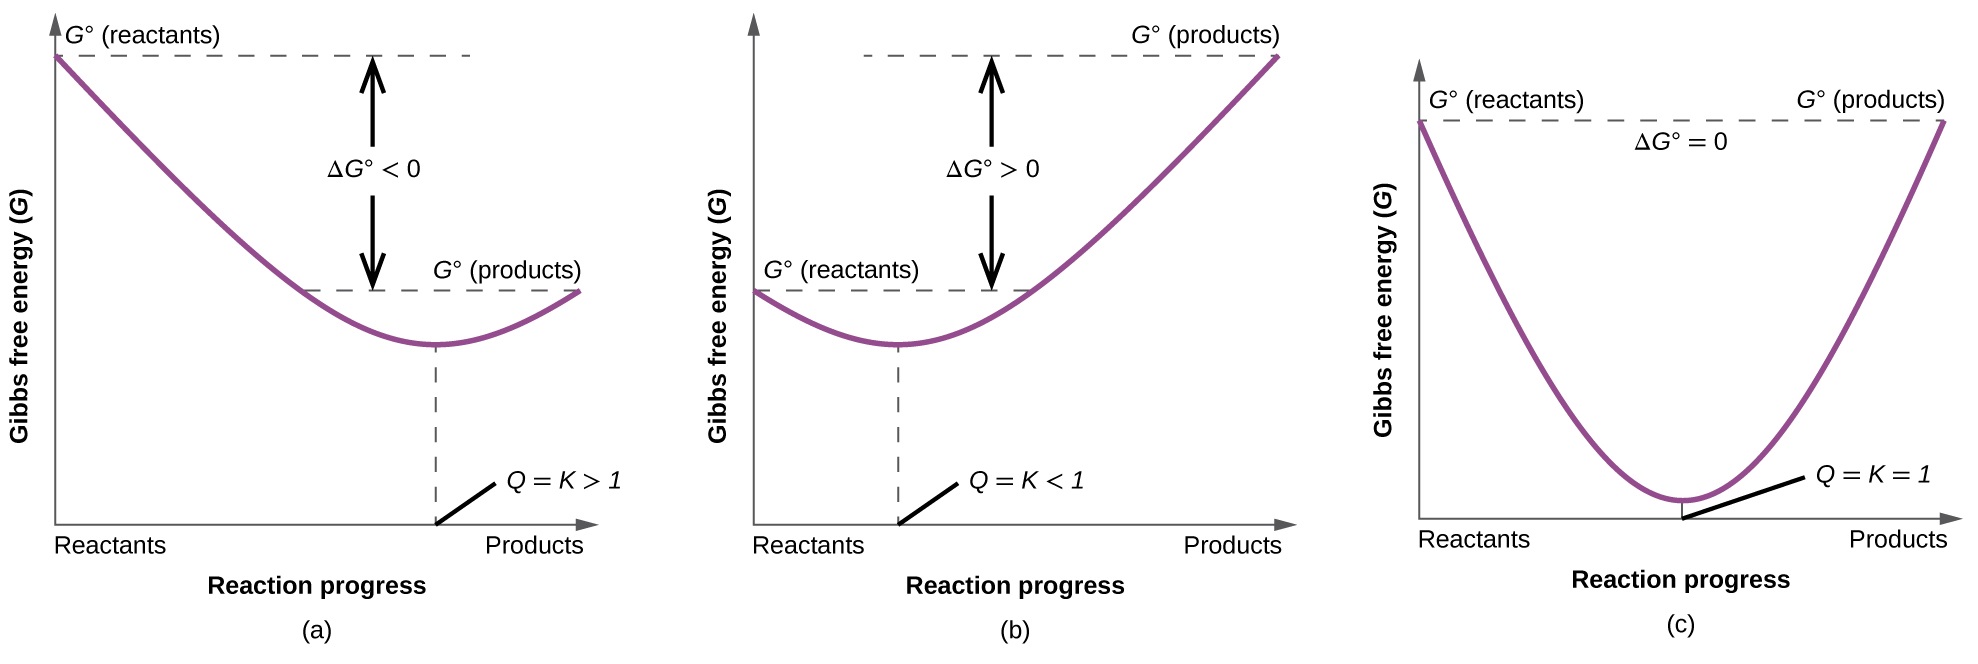
To further illustrate the relation between these two essential thermodynamic concepts, consider the observation that reactions spontaneously proceed in a direction that ultimately establishes equilibrium. As may be shown by plotting the free energy change versus the extent of the reaction (for example, as reflected in the value of Q), equilibrium is established when the system’s free energy is minimized (Figure \(\PageIndex{3}\)). If a system is present with reactants and products present in nonequilibrium amounts (Q ≠ K), the reaction will proceed spontaneously in the direction necessary to establish equilibrium.
Summary
Gibbs free energy (G) is a state function defined with regard to system quantities only and may be used to predict the spontaneity of a process. A negative value for ΔG indicates a spontaneous process; a positive ΔG indicates a nonspontaneous process; and a ΔG of zero indicates that the system is at equilibrium. A number of approaches to the computation of free energy changes are possible.
Key Equations
- ΔG = ΔH − TΔS
- ΔG = ΔG° + RT ln Q
- ΔG° = −RT ln K
Glossary
- Gibbs free energy change (G)
- thermodynamic property defined in terms of system enthalpy and entropy; all spontaneous processes involve a decrease in G
- standard free energy change (ΔG°)
- change in free energy for a process occurring under standard conditions (1 bar pressure for gases, 1 M concentration for solutions)
- standard free energy of formation \( (ΔG^\circ_\ce{f})\)
- change in free energy accompanying the formation of one mole of substance from its elements in their standard states
Contributors and Attributions
Paul Flowers (University of North Carolina - Pembroke), Klaus Theopold (University of Delaware) and Richard Langley (Stephen F. Austin State University) with contributing authors. Textbook content produced by OpenStax College is licensed under a Creative Commons Attribution License 4.0 license. Download for free at http://cnx.org/contents/85abf193-2bd...a7ac8df6@9.110).