
4.7: Protein Purification
- Page ID
- 234003

\( \newcommand{\vecs}[1]{\overset { \scriptstyle \rightharpoonup} {\mathbf{#1}} } \)
\( \newcommand{\vecd}[1]{\overset{-\!-\!\rightharpoonup}{\vphantom{a}\smash {#1}}} \)
\( \newcommand{\dsum}{\displaystyle\sum\limits} \)
\( \newcommand{\dint}{\displaystyle\int\limits} \)
\( \newcommand{\dlim}{\displaystyle\lim\limits} \)
\( \newcommand{\id}{\mathrm{id}}\) \( \newcommand{\Span}{\mathrm{span}}\)
( \newcommand{\kernel}{\mathrm{null}\,}\) \( \newcommand{\range}{\mathrm{range}\,}\)
\( \newcommand{\RealPart}{\mathrm{Re}}\) \( \newcommand{\ImaginaryPart}{\mathrm{Im}}\)
\( \newcommand{\Argument}{\mathrm{Arg}}\) \( \newcommand{\norm}[1]{\| #1 \|}\)
\( \newcommand{\inner}[2]{\langle #1, #2 \rangle}\)
\( \newcommand{\Span}{\mathrm{span}}\)
\( \newcommand{\id}{\mathrm{id}}\)
\( \newcommand{\Span}{\mathrm{span}}\)
\( \newcommand{\kernel}{\mathrm{null}\,}\)
\( \newcommand{\range}{\mathrm{range}\,}\)
\( \newcommand{\RealPart}{\mathrm{Re}}\)
\( \newcommand{\ImaginaryPart}{\mathrm{Im}}\)
\( \newcommand{\Argument}{\mathrm{Arg}}\)
\( \newcommand{\norm}[1]{\| #1 \|}\)
\( \newcommand{\inner}[2]{\langle #1, #2 \rangle}\)
\( \newcommand{\Span}{\mathrm{span}}\) \( \newcommand{\AA}{\unicode[.8,0]{x212B}}\)
\( \newcommand{\vectorA}[1]{\vec{#1}} % arrow\)
\( \newcommand{\vectorAt}[1]{\vec{\text{#1}}} % arrow\)
\( \newcommand{\vectorB}[1]{\overset { \scriptstyle \rightharpoonup} {\mathbf{#1}} } \)
\( \newcommand{\vectorC}[1]{\textbf{#1}} \)
\( \newcommand{\vectorD}[1]{\overrightarrow{#1}} \)
\( \newcommand{\vectorDt}[1]{\overrightarrow{\text{#1}}} \)
\( \newcommand{\vectE}[1]{\overset{-\!-\!\rightharpoonup}{\vphantom{a}\smash{\mathbf {#1}}}} \)
\( \newcommand{\vecs}[1]{\overset { \scriptstyle \rightharpoonup} {\mathbf{#1}} } \)
\(\newcommand{\longvect}{\overrightarrow}\)
\( \newcommand{\vecd}[1]{\overset{-\!-\!\rightharpoonup}{\vphantom{a}\smash {#1}}} \)
\(\newcommand{\avec}{\mathbf a}\) \(\newcommand{\bvec}{\mathbf b}\) \(\newcommand{\cvec}{\mathbf c}\) \(\newcommand{\dvec}{\mathbf d}\) \(\newcommand{\dtil}{\widetilde{\mathbf d}}\) \(\newcommand{\evec}{\mathbf e}\) \(\newcommand{\fvec}{\mathbf f}\) \(\newcommand{\nvec}{\mathbf n}\) \(\newcommand{\pvec}{\mathbf p}\) \(\newcommand{\qvec}{\mathbf q}\) \(\newcommand{\svec}{\mathbf s}\) \(\newcommand{\tvec}{\mathbf t}\) \(\newcommand{\uvec}{\mathbf u}\) \(\newcommand{\vvec}{\mathbf v}\) \(\newcommand{\wvec}{\mathbf w}\) \(\newcommand{\xvec}{\mathbf x}\) \(\newcommand{\yvec}{\mathbf y}\) \(\newcommand{\zvec}{\mathbf z}\) \(\newcommand{\rvec}{\mathbf r}\) \(\newcommand{\mvec}{\mathbf m}\) \(\newcommand{\zerovec}{\mathbf 0}\) \(\newcommand{\onevec}{\mathbf 1}\) \(\newcommand{\real}{\mathbb R}\) \(\newcommand{\twovec}[2]{\left[\begin{array}{r}#1 \\ #2 \end{array}\right]}\) \(\newcommand{\ctwovec}[2]{\left[\begin{array}{c}#1 \\ #2 \end{array}\right]}\) \(\newcommand{\threevec}[3]{\left[\begin{array}{r}#1 \\ #2 \\ #3 \end{array}\right]}\) \(\newcommand{\cthreevec}[3]{\left[\begin{array}{c}#1 \\ #2 \\ #3 \end{array}\right]}\) \(\newcommand{\fourvec}[4]{\left[\begin{array}{r}#1 \\ #2 \\ #3 \\ #4 \end{array}\right]}\) \(\newcommand{\cfourvec}[4]{\left[\begin{array}{c}#1 \\ #2 \\ #3 \\ #4 \end{array}\right]}\) \(\newcommand{\fivevec}[5]{\left[\begin{array}{r}#1 \\ #2 \\ #3 \\ #4 \\ #5 \\ \end{array}\right]}\) \(\newcommand{\cfivevec}[5]{\left[\begin{array}{c}#1 \\ #2 \\ #3 \\ #4 \\ #5 \\ \end{array}\right]}\) \(\newcommand{\mattwo}[4]{\left[\begin{array}{rr}#1 \amp #2 \\ #3 \amp #4 \\ \end{array}\right]}\) \(\newcommand{\laspan}[1]{\text{Span}\{#1\}}\) \(\newcommand{\bcal}{\cal B}\) \(\newcommand{\ccal}{\cal C}\) \(\newcommand{\scal}{\cal S}\) \(\newcommand{\wcal}{\cal W}\) \(\newcommand{\ecal}{\cal E}\) \(\newcommand{\coords}[2]{\left\{#1\right\}_{#2}}\) \(\newcommand{\gray}[1]{\color{gray}{#1}}\) \(\newcommand{\lgray}[1]{\color{lightgray}{#1}}\) \(\newcommand{\rank}{\operatorname{rank}}\) \(\newcommand{\row}{\text{Row}}\) \(\newcommand{\col}{\text{Col}}\) \(\renewcommand{\row}{\text{Row}}\) \(\newcommand{\nul}{\text{Nul}}\) \(\newcommand{\var}{\text{Var}}\) \(\newcommand{\corr}{\text{corr}}\) \(\newcommand{\len}[1]{\left|#1\right|}\) \(\newcommand{\bbar}{\overline{\bvec}}\) \(\newcommand{\bhat}{\widehat{\bvec}}\) \(\newcommand{\bperp}{\bvec^\perp}\) \(\newcommand{\xhat}{\widehat{\xvec}}\) \(\newcommand{\vhat}{\widehat{\vvec}}\) \(\newcommand{\uhat}{\widehat{\uvec}}\) \(\newcommand{\what}{\widehat{\wvec}}\) \(\newcommand{\Sighat}{\widehat{\Sigma}}\) \(\newcommand{\lt}{<}\) \(\newcommand{\gt}{>}\) \(\newcommand{\amp}{&}\) \(\definecolor{fillinmathshade}{gray}{0.9}\)Assays, Specific Activity, Initial Fractionation
A successful protein purification procedure can be nothing short of amazing. Whether you are starting off with a recombinant protein which is produced in E. coli, or trying to isolate a protein from some mammalian tissue, you are typically starting with gram quantities of a complex mixture of protein, nucleic acids, polysaccharide, etc. from which you may have to extract milligram (or microgram!) quantities of desired protein at high purity, and hopefully with high yield.
The first step in any purification is the development of a specific assay for the protein of interest. The specific assay can be based upon some unique characteristic of the protein of interest
- Enzymatic activity
- Immunological activity
- Physical characteristics (e.g. molecular mass, spectroscopic properties, etc.)
- Biological activity
- Ideally, an assay should be
- Specific (you don't want a false positive)
- rapid (you don't want to wait a week for the results)
- sensitive (you don't want to consume all your sample in order to assay it)
- quantitative (you need an accurate way to measure the quantity of your protein at each step in the purification)
Western Blotting
Antibodies can be used in a method called Western blotting, which is useful for determining levels of protein expression and for assaying proteins during purification. This method usually involves the following steps:
- A protein sample is subjected to polyacrylamide gel electrophoresis.
- After this the gel is placed over a sheet of nitrocellulose and the protein in the gel is electrophoretically transfered to the nitrocellulose.
- The nitrocellulose is then soaked in gelatin to "block" its ability to non-specifically bind proteins.
- The nitrocellulose is then incubated with the specific antibody for the protein of interest.
- The nitrocellulose is then incubated with a second antibody which is specific for the first antibody. For example, if the first antibody was raised in rabbits, the second antibody might be termed "goat anti-rabbit immunoglobulin". What this means is that rabbit immunoglobulins were used to elicit an antibody response in goats. The goat antibodies (polyclonal) will include those which recognize the conserved region in the rabbit antibodies. Since the Fc region is conserved, it will bind to any and all rabbit antibodies, including those on the nitrocellulose paper.
- The second antibody will typically have a covalently attached enzyme which, when provided with a chromogenic substrate, will cause a color reaction.
- Thus the molecular weight and amount of the desired protein can be characterized from a complex mixture (e.g. crude cell extract) of other proteins.
In a variation of the above, the protein sample may be blotted directly on a nitrocellulose paper (called a dot blot) without first running a gel. This may be desirable if, for example, the antibody is monoclonal and recognizes an epitope which is dependent upon native structure (which would be destroyed upon running an SDS PAGE).
In addition to their varied uses, antibodies can also be used to purify proteins.
- If relatively large amounts of an antibody can be obtained, they can be covalently attached to a chromatography resin (e.g. sephadex beads).
- If a crude cell extract is run over such a column, only the protein of interest should bind, and everything else will flow through.
- The bound protein can then be eluted. This is typically achieved by moderately low pH conditions (using acetic acid). As long as the protein of interest is not irreversibly denatured by such conditions, the method will work quite well.
- One potential pitfall involves that of monoclonal antibodies being utilized to purify mutant proteins. The regions of the protein comprising the epitope cannot be modified without destroying the ability of the antibody to bind. Thus, the use of monoclonal antibodies in a purification scheme may preclude its use in purifying certain mutants.
Protein purification can be thought of as a series of fractionation steps designed so that:
- The protein of interest is found almost exclusively in one fraction (and with good yield)
- A significant amount of the contaminants can be found in a different fraction
During purification you will need to monitor several parameters, including:
- Total sample volume
- Total sample protein (can be estimated by A280; 1.4 ~ 1.0 mg/ml)
- Units of activity of desired protein (based on specific assay)
This basic information will allow you to keep track of the following information during each step of purification:
- % yield for each purification step
- Specific activity of the desired protein (units/mg total protein)
- Purification enhancement of each step (e.g. "3.5x purification)
In designing a purification scheme you typically have to balance purification with yield.
- For example, it may be relatively straightforward to obtain 90% pure material with good yield.
- However, it may be difficult to improve that purity an additional few percentile with good yield.
- The planned application of the purified protein determines the target purity.
- If the protein is to be used to determine amino acid sequence information, maybe 90% is acceptable. However, if the material is to be used in clinical trials, 99.99+% may be the target purity.
Initial steps in purification
.png?revision=1&size=bestfit&width=499&height=283)
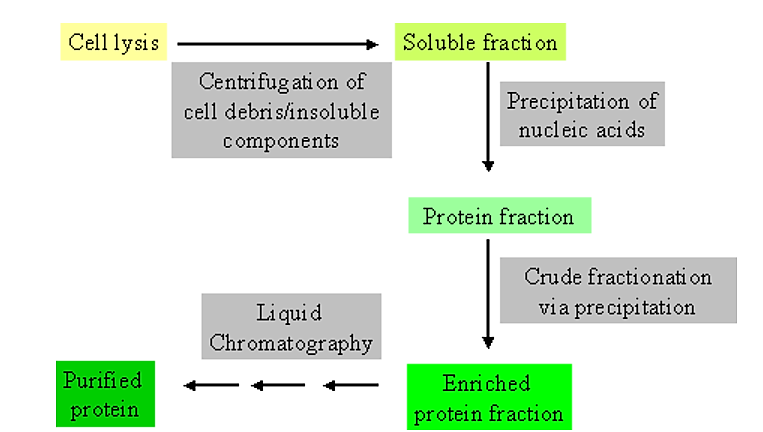
Figure 4.1.1: Purification steps
- It is extremely helpful to have some information not only on the general physical and chemical characteristics of the protein you are trying to purify, but also on the contaminating components.
- For example, many E. coli proteins are generally low molecular weight (<50,000 Da) and somewhat acidic in isoelectric point
Usually the initial steps in purification make use of general physical and/or chemical differences between soluble proteins and other cell components.
- For example, soluble proteins can be separated from general cellular debris, and intact cells, by centrifugation.
- Thus, cells are physically disrupted (via homogenization or a cell press) to allow release of cell contents. This is then followed by centrifugation to separate generally soluble components from those which are insoluble.
- It is at this point that data collection begins in order to monitor the purification.
Nucleic acids can sometimes be readily removed from the sample by the addition of large cationic compounds such as polyethylene imine, or streptomycin sulfate.
- The nucleic acids bind to these compounds via electrostatic interactions and the complex precipitates and can be removed via centrifugation.
- The same general result can be obtained by mixing in ion exchange resins which are anion exchangers (i.e. the resins contain cationic groups) and then filtering or centrifuging to remove. As with either method, it should be confirmed that the desired protein is not bound as well.
Crude fractionations of proteins can be achieved by adding various quantitites of precipitants such as ammonium sulfate, or polyethylene glycol (PEG).
- For this type of purification step an initial experiment is performed to monitor the fraction of overall protein, as well as desired protein, remaining in solution (and pellet) as a function of precipitant concentration.
|
Ammonium Sulfate (% saturated) |
0 |
10 |
20 |
30 |
40 |
50 |
60 |
70 |
80 |
90 |
|
Sample A280 |
1000 |
900 |
600 |
200 |
100 |
75 |
50 |
40 |
25 |
20 |
|
Activity assay(units) |
200 |
200 |
200 |
190 |
170 |
100 |
30 |
5 |
0 |
0 |
.png?revision=1&size=bestfit&width=587&height=406)
Figure 4.1.2: Protein activity as a function of precipitant concentration
- In this particular example we are in luck: at around 30% ammonium sulfate we can precipitate about 80% of the total protein concentration in our sample, yet our activity assay for our desired protein indicates that about 95% of our desired protein is still soluble.
- At 80% ammonium sulfate all of our desired protein has precipitated. Thus, from these results we would do the following:
- Add ammonium sulfate to our sample to a concentration of 30% saturation
- Centrifuge and discard the pellet
- Add ammonium sulfate to 80% saturation
- Centrifuge and keep the pellet. Resuspend the pellet in buffer to solubilize the protein.
- We would expect about a 5-fold purification with about 95% yield.
Column Chromatography - Ion exchange; Dialysis and Concentration
Column chromatography
After initial fractionation steps the typical procedure is to move to column chromatography.
- In column chromatography we have a glass tube (column) which is filled with a material ("resin") which has certain physical/chemical characteristics.
- These characteristics allow it to interact in various ways with different proteins.
- Some common types of chromatographic resins include:
- Ion exchange
- Hydrophobic
- Gel filtration
- Affinity
Ion exchange
Ion exchange resins contain charged groups.
- These may be acidic in nature (in which case the resin is a cation exchanger)
- or basic (in which case it is an anion exchanger).
- Cation and anion exchangers may be broken down further into weak and strong exchangers (reflecting binding affinity).
|
Type of exchanger |
Functional group |
Common name |
|---|---|---|
|
Weak cation exchanger |
carboxymethyl |
CM cellulose/sephadex |
|
Strong cation exchanger |
sulfopropyl |
SP sephadex |
|
Weak anion exchanger |
diethylaminoethyl |
DE cellulose/sephadex |
|
Strong anion exchanger |
quaternary amine |
QAE sephadex |
- Usually, samples are loaded under low ionic strength conditions and bound material is eluted using either a step or gradient elution of buffer with higher ionic strength.
- Generally speaking, a protein will bind to a cation exchange resin if the buffer pH is lower than the isoelectric point (pI) of the protein, and will bind to an anion exchange resin if the pH is higher than the pI.
.png?revision=1&size=bestfit&width=594&height=416)
Figure 4.1.3: Protein binding to resins
- Knowledge of the pI of the protein is therefore helpful in designing a purification protocol using ion exchange resins (however, you can always simply try different resins to see which works best).
Generally speaking, ion exchange columns are short and fat in dimensions.
Elution of proteins from ion exchange resins
- Proteins bound to ion exchange resins are bound via non-covalent ionic (salt-bridge) interactions. We can compete for these ionic binding sites on the resin with other ionic groups, namely, salts
- There are two general types of methods when eluting with a salt solution: 1. Gradient elution and 2. Step elution
- A gradient elution refers to a smooth transition of salt concentration (from low to high) in the elution buffer. Weakly binding proteins elute first, and stronger binding proteins elute last (i.e. they require higher salt concentrations in the buffer to compete them off the column)
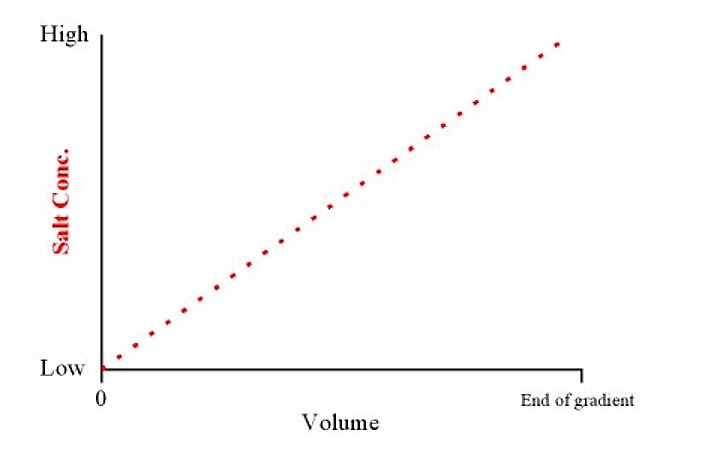
- A gradient salt concentration can be made using a gradient maker. In its simplest form, this consists of two containers (must be the same shape) connected by a siphon (or tube at the bottom). One container contains the low salt buffer, and the other contains high salt buffer. The buffer is withdrawn from the low salt container:
.png?revision=1&size=bestfit&width=396&height=344)
Figure 4.1.4: Gradient maker
- This will produce a linear gradient from low to high salt concentrations over the total volume of the gradient
.png?revision=1&size=bestfit&width=443&height=278)
Figure 4.1.5: Salt concentration and volume
- If we know the concentration range of salt over which a protein of interest will elute we can simply elute with a buffer containing that concentration of salt. This is known as a step elution.
- Step elutions are generally faster to run, and elute the protein in a smaller overall volume than with gradient elutions. They generally work best when contaminants elute at a significantly different salt concentration than the protein of interest
.png?revision=1&size=bestfit&width=461&height=286)
Figure 4.1.6: Step elution
Note that after ion exchange chromatography the protein of interest will be in a buffer with a potentially high salt concentration. This must be taken into account before proceeding with the next step in the purification scheme
Dialysis
- After an ammonium sulfate precipitation step, or an ion exchange chromatography step, the protein of interest may be in a high salt buffer. This may be undesirable for several reasons. How do we get rid of salt in our sample?
- One of the most common methods is that of dialysis
- The method of dialysis makes use of semi-permeable membranes. In the simplest example, this membrane is manufactured in the form of tubing (looking much like a sausage casing)
- The main feature of this membrane is that it is porous. However, the pore size is such that while small salt ions can freely pass through the membrane, larger protein molecules cannot (i.e. they are retained). Thus, dialysis membranes are characterized by the molecular mass of the smallest typical globular protein which it will retain.
- This is commonly referred to as the cutoff of the tubing (e.g. Spectrapore #6 dialysis tubing has a cutoff of 1,000 Daltons, meaning that a 1,000 Dalton protein will be retained by the tubing but that smaller molecular mass solutes will pass through the tubing)
- Dialysis proceeds by placing a high salt sample in dialysis tubing (i.e. the dialysis "bag") and putting it into the desired low salt buffer:
.png?revision=1&size=bestfit&width=339&height=337)
Figure 4.1.7: Dialysis
- Over time the concentration of low molecular mass solutes within the bag, and in the low salt buffer, will come achieve equilibrium. In practical terms (for the above case) salt molecules will diffuse out of the bag into the low salt buffer:
.png?revision=1&size=bestfit&width=442&height=404)
Figure 4.1.8: Salt diffusion
- At equilibrium the salt concentration of the sample can be calculated as follows:
$$\frac {(sample \: volume) \times (sample \: salt \: concentration) + (buffer \: volume) \times (buffer \: salt \: concentration)}{total \:volume} = final \:salt \: concentration$$
Note
Often the buffer salt concentration is 0 M
- The buffer volume for the dialysis is a function of the required final concentration of salt in the sample
Example 4.1.1:
Dialysis example
We have a 10ml protein sample from an ion exchange column elution pool which contains 1.0M NaCl. For our next step in the purification we can have no more than 1mM NaCl in the sample.
.png?revision=1&size=bestfit&width=709&height=258)
Therefore, the required buffer volume would be (total vol - sample vol) = 9.990 L (or ~ 10 L)
- Thus, if we dialyzed 10mls of sample (with 1.0M NaCl conc) in 10 L of water after equilibrium the NaCl concentration in the sample would be 1.0 mM.
- Note that in the above example this would commonly be referred to as a "1:1,000" dialysis.
- Suppose that we don't want to make up 10 L of buffer? We can actually achieve the same results with two sequential "1:32" dialyses (i.e. the square root of the 1:1,000 dialysis - in other words, two sequential 1:32 dialyses is equivalent to a single 1:1,000 dialysis):
First dialysis versus 310 ml of buffer: sample NaCl conc will be (10*1.0)/(320) = 31 mM
Second dialysis versus 310 ml of buffer: sample NaCl conc will be (10*0.031)/(320) = 0.97 mM
Thus, instead of making 10 L of buffer, we could make only 620 ml and achieve the same results with two dialysis steps
- In this case, removing the salt would take twice as long, i.e. we need to perform two dialysis steps. How long does dialysis take?
A useful rule of thumb is that for most types of dialysis tubing the dialysis is 80% compete after four hours
- One consequence of dialysis to watch out for is that while salt ions are moving out of the bag, water molecules are moving into the bag. Thus the volume of sample may actually increase (the bag will swell) and, therefore, the protein concentration will decrease
- In the extreme case, the bag may actually swell to the point of rupture. Therefore, it is a good idea not to fill the bag completely, but leave a void to allow for potential swelling.
Concentration
- What if our protein sample is too dilute for our needs? How can we concentrate our samples?
- One common method is, again, to use a semi-permeable membrane for this purpose.
- A very simple method is to place our sample in a dialysis bag and coat it with a high molecular weight solute which can readily be dissolved by the buffer.
- For example, polyethylene glycols and polyvinyl pyrolidones can have very large molecular masses (i.e. 20,000 Da). These compounds are also readily dissolved in water. If our sample in a dialysis bag is coated with dry forms of the above polymers, water will leave the dialysis bag (it can go through the pores) and hydrate the polymers. The result is a decrease in volume of buffer in the dialysis bag (the protein will be concentrated).
- In another variation, the semi-permeable membrane is manufactured into a flat disk and placed at the bottom of a container which holds our sample. In one method the container is pressurized and forces buffer out of the container (protein is retained and is concentrated). In another method, the vessel is centrifuged and the centripetal force achieves the same goal as pressure in the previous example.
For both dialysis and concentration, it is essential that the membrane does not interact with the protein (i.e. has no affinity for, and will not bind, the protein)
- With the pressure type concentrators, dialysis and concentration can be achieved in tandem. For example, the sample can be concentrated and then buffer added to the sample. The sample is then concentrated again. Every time buffer is added the salt concentration is reduced. After repeated cycles of this, the salt concentration is at the desired level and the sample is concentrated to the desired final volume.
Gel Filtration, Affinity and Hydrophobic resins; Preparation of Resin, Plumbing
Gel filtration
Gel filtration does not rely on any chemical interaction with the protein, rather it is based on a physical property of the protein - that being the effective molecular radius (which relates to mass for most typical globular proteins).
- Gel filtration resin can be thought of as beads which contain pores of a defined size range.
- Large proteins which cannot enter these pores pass around the outside of the beads.
- Smaller proteins which can enter the pores of the beads have a longer, tortuous path before they exit the bead.
- Thus, a sample of proteins passing through a gel filtration column will separate based on molecular size: the big ones will elute first and the smallest ones will elute last (and "middle" sized proteins will elute in the middle).
.png?revision=1&size=bestfit&width=406&height=356)
Figure 4.1.9: Gel filtration
- If your protein is unusually "small" or "large"in comparison to contaminating proteins then gel filtration may work quite well.
Where will a protein elute in a gel filtration experiment?
- There are two extremes in the separation profile of a gel filtration column.
- There is a critical molecular mass (large mass) which will be completely excluded from the gel filtration beads. All solutes in the sample which are equal to, or larger, than this critical size will behave identically: they will all eluted in the excluded volume of the column
- There is a critical molecular mass (small mass) which will be completely included within the pores of the gel filtration beads. All solutes in the sample which are equal to, or smaller, than this critical size will behave identically: they will all eluted in the included volume of the column
- Solutes between these two ranges of molecular mass will elute between the excluded and included volumes
.png?revision=1&size=bestfit&width=377&height=278)
Figure 4.1.10: Excluded vs. included volume
As a general rule of thumb, the excluded volume (Vo) is approximately equal to one third of the column volume, the included volume is approximately equal to two thirds of the column volume
- In gel filtration the resolution is a function of column length (the longer the better)
- However, one drawback is related to the maximum sample volume which can be loaded. The larger the volume of sample loaded, the more the overlap between separated peaks. Generally speaking, the sample size one can load is limited to about 3-5% of the total column volume.
- Thus, gel filtration is best saved for the end stages of a purification ,when the sample can be readily concentrated to a small volume.
- Gel filtration can also be used to remove salts from the sample, due to its ability to separate "small" from "large" components.
- Finally, gel filtration can be among the most "gentle" purification methods due to the lack of chemical interaction with the resin.
Affinity chromatography
Affinity chromatography is a general term which applies to a wide range of chromatographic media. It can be basically thought of as some inert resin to which has been attached some compound which has a specific affinity for your protein of interest.
- Thus, a specific antibody attached to an inert resin would be a type of affinity chromatography.
- Other examples might include: a protease inhibitor attached to some matrix, designed to bind a specific protease
- a cofactor bound to some matrix, designed to bind to a particular enzyme
- a metal ion bound to a matrix, designed to chelate a protein with a metal binding site, and so on.
In each case, the type of resins used and the method of attachment may vary, as will the method of elution. One generalization regarding method of elution is that the bound ligand can be competed off of the column's functional group by including in the elution buffer a high concentration of the free functional group. For example, if the functional group of the column is a cofactor, then the bound protein can be competed off the column by passing a buffer containing a high concentration of cofactor (or cofactor analog) through the column.
Other methods of elution include changing the buffer conditions such that the protein is no longer in the native state (since it is the native state which confers the structure required for the specific binding interaction). This can be achieved by changing pH or by adding denaturing agents such as urea or guanidine.
With affinity chromatography, typically the purification achieved in a single step can be dramatic - on the order of several thousand fold. Single step purifications with specific affinity columns are not unheard - in fact it is an ideal goal of purification - a matrix which recognizes only the protein of interest and none other.
Hydrophobic resins
Hydrophobic resins contain a non-polar functional group, such as an alkane or aromatic group.
- Many proteins are able to sequester such groups on their surface and this exclusion from solvent provides the basis of the binding energy (i.e. the "hydrophobic effect").
- This interaction is enhanced by increasing ionic strength, such that proteins may bind under high salt conditions and elute under low salt conditions.
- As such these columns may be used to not only provide purification, but to desalt samples (for example after an initial ammonium sulfate precipitation).
- It is usually not possible to predict in advance which particular resin will bind a given protein, this is usually determined empirically. However, the longer the alkane, or the larger the aromatic compound, the stronger the binding typically will be.
Due to the nature of hydrophobic interactions and ionic strength, hydrophobic chromatography and ion exchange chromatography can be conveniently used sequentially. For example, after ion exchange the protein is in high salt conditions, thus it can be loaded directly onto a hydrophobic column. Conversely, a hydrophobic column is eluted in low salt, which is a requirement for binding to an ion exchange resin.
A distinction should be noted between hydrophobic interaction chromatorgraphy and reverse phase chromatography
- Hydrophobic interaction chromatography is performed in aqueous solvent conditions and changes in ionic strength are used to elute the column. The protein typically binds in the native state via hydrophobic groups located on the surface of the protein. The native state is retained during the elution conditions
- Reverse phase chromatography utilizes a hydrophobic solvent (typically acetonitrile) and the binding of a ligand is a function of the phase partition between the hydrophobic nature of the solvent and column functional group. Proteins are typically denatured in such solvents and bind due to the hydrophobic nature of the entire polypeptide sequence. Since the majority of hydrophobic groups are located in the core of globular proteins, the binding is related to the denaturation of the protein and the accessibility of these groups to the column functional groups. Proteins can be purified using reverse phase chromatography, but usually must be refolded in some way to regain functionality (i.e. the native state)
Preparation of resins
The steps in preparing a chromatographic resin typically involve:
- Hydration of resin
- Decanting fines
- Equilibrating the resin and preparing a slurry
- Degassing the slurry
- Resins come either dry or preswollen. If they are dry they need to be hydrated. This is usually accomplished by mixing the dry resin with buffer and letting it hydrate slowly overnight (or faster at higher temperatures
- After the resin has hydrated and settled, very fine particles will settle at the top. These "fines" slow the flow rate of the packed resin. The settled resin is therefore carefully decanted to discard these fines.
- The resin is then equilibrated in the buffer to be used for the analysis. Equilibration usually involves pH'ing the resin, or buffer exchanges. Never use a stir bar when pH'ing the resin (it can mechanically shear the resin and produce fines), rather stir the resin slurry with a stir rod.
- After the equilibrated resin has settled, an equal volume of buffer is added to produce a 50% slurry of resin. This is usually "thin" enough to allow air bubbles to escape when packing the column.
- Finally, the slurry is degassed prior to packing the column. This will help minimize the formation of air bubbles.
Packing the column
Low pressure columns are typically packed using gravity.
- Add a small amount of buffer to the bottom of the column.
- Place a packing reservoir on the top of the column. Since we will be using a 50% slurry we will have a volume which is 2x the column volume and its best to pour the resin in all at one time. Thus, the packing reservoir should have a volume equal to, or greater, than the column volume.
- Carefully pour the resin slurry into the packing reservoir/column, avoiding the introduction of air bubbles as much as possible
- Let the column sit for about 5 minutes to allow large air bubbles to escape
- Open the column valve at the bottom and allow the column to pack under gravity
- Note the top of the resin bed. It will move down as the column packs. When the column is packed the top of the resin bed will no longer move down.
Plumbing
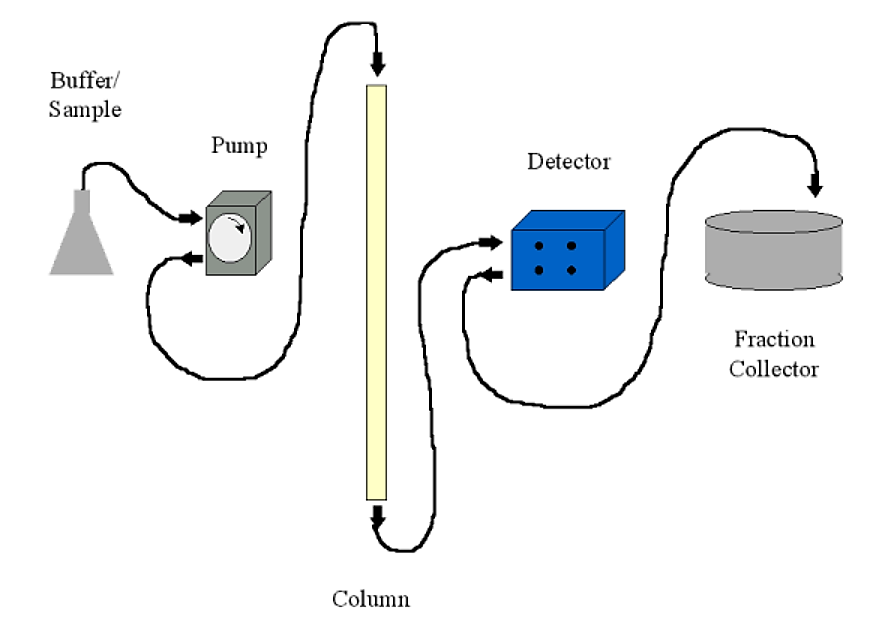
Chromatography systems may be run using only gravity and a beaker to collect the appropriate fraction. Most common systems, however, will include the following:
- A pump. Usually a peristaltic pump with variable flow rate and a communications port for a controller. The pump is usually set up to push buffer through the column, rather than sucking buffer out of the column (which can cause a low pressure condition with production of air bubbles)
- A detector. This is typically a UV (A280) detector. Most detectors are of the two-cell type - meaning that you can have plain buffer as a blank in the detector while analyzing your column fractions. The detector sends the absorbance information to a chart recorder to be displayed (printed)
- A fraction collector. This allows you to collect fractions either by number of drops (~30 per ml) or by time. In conjunction with a controllable pump, time collection translates to volume. The fraction collector will typically have an communications port to output a signal when it changes fractions and to receive commands from the detector/controller on some sophisticated systems.
- A chart recorder. This will print a continuous trace of the detector output and the fraction collector event marker (signalling when a fraction changes). Fractions can also be read individually on a UV spectrophotometer if a chart recorder is unavailable.
.png?revision=1&size=bestfit&width=609&height=438)
Figure 4.1.11: Chromatography setup
- If a gravity system is used, a safety loop should be installed to prevent the column from drying up if the buffer is used up when the column is unattended
.png?revision=1&size=bestfit&width=497&height=351)
Figure 4.1.12: Safety loop
Note that the bottom of the safety loop is lower than the outlet to the fraction collector.
Running the Experiment, Resolving Peaks
The following represents an example of a low pressure liquid chromatography (ion exchange resin) experiment.
Sample:
- Volume = 90 mls
- A280 = 1.8
- Total A280 = 162
Column:
- DE-52 (diethylaminoethyl cellulose; anion exchange)
- Size = 1.0 x 12.7 cm
- Volume =
.png?revision=1&size=bestfit&width=143&height=36) = 40 mL
= 40 mL
Fraction Collector:
- 10 mls / fraction (~300 drops/fraction)
The chromatogram for this experiment looked like this:
.png?revision=1&size=bestfit&width=448&height=315)
Figure 4.1.13: Chromatogram
The following events took place during this chromatography run:
1. Note the tick marks on the chromatogram.
- The "event" marker from the fraction collector notifies the chart recorder when a tube change takes place.
- The experiment begins with the tick next to the '0' on the x-axis ("tick 0"); this indicates the start of fraction (tube) number 1.
- The next tick mark ("tick 1") indicates the end of fraction number 1, and the start of fraction number 2.
- Thus, fractions span the gap between the tick marks.
2. The sample loading is begun at tick 0.
3. Sometime during fraction 5 we begin to notice the absorbence of the column effluent increasing
- It has taken about (5 fractions x 10mls per fraction) or 50 mls from the start of loading until the detector notes any absorbance.
- This compares well with the fact that the column volume is about 40 mls and there is some volume associated with the tubing going in and out of the column.
- Thus, this 'delay' from sample load to sample detection is the dead volume of the system
4. Obviously, some material is not binding to the resin during the loading step. This is the flow-through. Is this some component of the sample which does not have affinity for the resin, or, does it represent that we have exceeded the capacity of the resin?
- If we have exceeded the capacity of the resin, then the flow-through will have an A280 similar to the sample being loaded
- Also, prior to exceeding the capacity, the flow-through will have some characteristic A280 which will then transition to another A280 (that of the loaded sample), resulting in a double-plateau chromatogram.
- In the above experiment the flow-through plateaus around A280=0.5 or about 25% of the absorbance of the load. This would seem to indicate that a component, or component(s), representing one quarter of our sample, does not have affinity for the resin in the column
5. Around fraction 9 we begin to wash the column
- This makes sense because 9 fractions x 10mls per fraction = 90 mls have loaded and this is equivalent to our original sample volume (i.e. all the sample has loaded)
- The column is typically washed using the same buffer conditions in the protein sample
6. Around fraction 14 we note the A280 begins to decrease
- This makes sense given that we determined the dead volume of the system to be approximately 50 mls or 5 fractions. Thus, a wash which was begun at fraction 9 is observed to decrease the absorbance around fraction 14
- We continue washing the column until the A280 approaches 0 (baseline). In other words, all of the non-binding material in the sample has been washed away
7. After the A280 comes back down to baseline we begin our elution protocol. In this particular experiment we will use a linear gradient of increasing salt (NaCl) concentration (in wash buffer) to compete off the material bound to the ion exchange resin.
8. Our elution has produced two peaks: a small peak centered around fraction 42 and a larger peak centered around fraction 50
- We will have to assay each peak (and the flow through) to find out where our protein of interest has gone
- The two elution peaks are fairly well resolved. We could combine fractions 40-44 and call that "peak 1", and combine fractions 46-55 and call that "peak 2".
9. Is there any material left on the column? The integrated areas (i.e. summing the A280's of each fraction in a pool) of the flow-through, peak 1 and peak 2 are as follows
- Flow through: 4
- Peak 1: 2
- Peak 2: 10
- This gives a total integrated area of 16. Each fraction is 10 mls, so this gives a total A280 = 16 x 10 = 160 which is quite close to the total A280 of our loaded sample.
- In other words, it looks like our chromatogram is accounting for all the components in our original sample.
10. If our protein of interest was actually peak 1 (and if our yield was 100%), then this column has provided an eight fold purification ( 2 x 10 / 162).
Resolving peaks
- Contaminating peaks will not necessarily be completely separated from the peak which contains our protein of interest
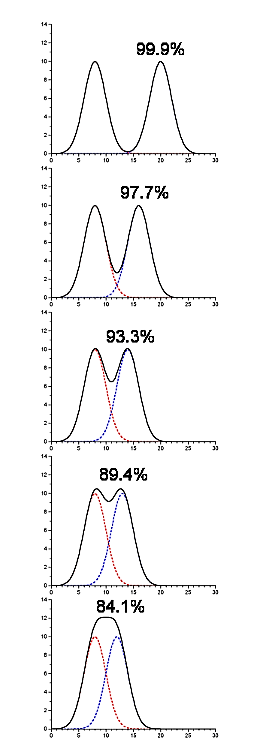
- In the following picture there are two components being resolved, and they are present in equimolar amounts (thus, the starting purity is 50%). The yield and purity are listed for the situation where we were to pool each peak by splitting at the midpoint between them (in this particular example the yield and purity are identical in each case)
.png?revision=1)
Figure 4.1.14: Contaminating peaks
- This gives you some idea of the amount of cross-contamination in each peak as a function of their separation from one another.
- Software to fit gaussians to a chromatogram can provide this type of information
Pooling for purity verses yield
Usually, you will probably be pooling fractions in such a way as to maximize the recovery of your protein of interest. However, you always have the option of pooling to increase purity, and if you have lots of protein to work with this may allow you to achieve the desired purity with fewer steps. Here's an example of how it's done:
.png?revision=1&size=bestfit&width=335&height=552)
Figure 4.1.15: Yield vs. purity
- These are all the same chromatogram, however, we can pool them differently to get better purity (at the expense of yield
- The blue peak is the peak of interest and it is not resolved from a contaminating peak (in red).
- The vertical line represents the left-most fraction we use to pool the peak (we pool all fractions to the right of the vertical line to get our protein of interest)
- In the last panel we see that we can achieve about 98.8% purity if we are willing to part with half our protein!
Monitoring the purification
There are several criteria. One criteria is that we cannot improve upon the specific activity of our sample. This value refers to the functional activity of our sample in relationship to the total protein concentration of the sample.
- In the initial stages of purification this value will be low (not much activity in relationship to the total amount of protein).
- This value will increase after each purification step as we remove other proteins from the sample.
- At some point the specific activity will plateau, and by definition, if it is pure we cannot increase the specific activity.
- There may be a published value for the specific activity which we can compare ours to.
Also, each step of the purification should be monitored by gel electrophoresis.
- In the initial stages of purification we will probably see a variety of bands, of various molecular weights, on our gel.
- After the different purification steps, we should see the disappearance of certain bands concomitant with the increasing concentration of a certain band (or bands) representing our protein.
- If we have successfully purified our protein (and if it is a single polypeptide) we should arrive at a constant specific activity and a single band on a gel.
- Analytical methods like HPLC or densitometer scanning of a stained gel can give us a quantitative idea of the purity of our final sample.
The following chart represents the typical data one would monitor during a purification:
|
|
|
|
|
|
|
|---|---|---|---|---|---|
| Crude cell lysate |
|
|
|
||
| 30-70% Ammonium sulfate cut |
|
|
|
|
|
| DEAE Sephadex pool |
|
|
|
|
|
| CM Sephadex pool |
|
|
|
|
|
| Phenyl Sepharose pool |
|
|
|
|
|
| Gel Filtration pool |
|
|
|
|
|
| Affinity resin type #1 pool |
|
|
|
|
|
| Affinity resin type #2 pool |
|
|
|
|
|
| Total purification |
|
||||
| Total yield (%) |
|
||||