8.4: Particulate Gravimetry
- Page ID
- 220728
\( \newcommand{\vecs}[1]{\overset { \scriptstyle \rightharpoonup} {\mathbf{#1}} } \)
\( \newcommand{\vecd}[1]{\overset{-\!-\!\rightharpoonup}{\vphantom{a}\smash {#1}}} \)
\( \newcommand{\id}{\mathrm{id}}\) \( \newcommand{\Span}{\mathrm{span}}\)
( \newcommand{\kernel}{\mathrm{null}\,}\) \( \newcommand{\range}{\mathrm{range}\,}\)
\( \newcommand{\RealPart}{\mathrm{Re}}\) \( \newcommand{\ImaginaryPart}{\mathrm{Im}}\)
\( \newcommand{\Argument}{\mathrm{Arg}}\) \( \newcommand{\norm}[1]{\| #1 \|}\)
\( \newcommand{\inner}[2]{\langle #1, #2 \rangle}\)
\( \newcommand{\Span}{\mathrm{span}}\)
\( \newcommand{\id}{\mathrm{id}}\)
\( \newcommand{\Span}{\mathrm{span}}\)
\( \newcommand{\kernel}{\mathrm{null}\,}\)
\( \newcommand{\range}{\mathrm{range}\,}\)
\( \newcommand{\RealPart}{\mathrm{Re}}\)
\( \newcommand{\ImaginaryPart}{\mathrm{Im}}\)
\( \newcommand{\Argument}{\mathrm{Arg}}\)
\( \newcommand{\norm}[1]{\| #1 \|}\)
\( \newcommand{\inner}[2]{\langle #1, #2 \rangle}\)
\( \newcommand{\Span}{\mathrm{span}}\) \( \newcommand{\AA}{\unicode[.8,0]{x212B}}\)
\( \newcommand{\vectorA}[1]{\vec{#1}} % arrow\)
\( \newcommand{\vectorAt}[1]{\vec{\text{#1}}} % arrow\)
\( \newcommand{\vectorB}[1]{\overset { \scriptstyle \rightharpoonup} {\mathbf{#1}} } \)
\( \newcommand{\vectorC}[1]{\textbf{#1}} \)
\( \newcommand{\vectorD}[1]{\overrightarrow{#1}} \)
\( \newcommand{\vectorDt}[1]{\overrightarrow{\text{#1}}} \)
\( \newcommand{\vectE}[1]{\overset{-\!-\!\rightharpoonup}{\vphantom{a}\smash{\mathbf {#1}}}} \)
\( \newcommand{\vecs}[1]{\overset { \scriptstyle \rightharpoonup} {\mathbf{#1}} } \)
\( \newcommand{\vecd}[1]{\overset{-\!-\!\rightharpoonup}{\vphantom{a}\smash {#1}}} \)
\(\newcommand{\avec}{\mathbf a}\) \(\newcommand{\bvec}{\mathbf b}\) \(\newcommand{\cvec}{\mathbf c}\) \(\newcommand{\dvec}{\mathbf d}\) \(\newcommand{\dtil}{\widetilde{\mathbf d}}\) \(\newcommand{\evec}{\mathbf e}\) \(\newcommand{\fvec}{\mathbf f}\) \(\newcommand{\nvec}{\mathbf n}\) \(\newcommand{\pvec}{\mathbf p}\) \(\newcommand{\qvec}{\mathbf q}\) \(\newcommand{\svec}{\mathbf s}\) \(\newcommand{\tvec}{\mathbf t}\) \(\newcommand{\uvec}{\mathbf u}\) \(\newcommand{\vvec}{\mathbf v}\) \(\newcommand{\wvec}{\mathbf w}\) \(\newcommand{\xvec}{\mathbf x}\) \(\newcommand{\yvec}{\mathbf y}\) \(\newcommand{\zvec}{\mathbf z}\) \(\newcommand{\rvec}{\mathbf r}\) \(\newcommand{\mvec}{\mathbf m}\) \(\newcommand{\zerovec}{\mathbf 0}\) \(\newcommand{\onevec}{\mathbf 1}\) \(\newcommand{\real}{\mathbb R}\) \(\newcommand{\twovec}[2]{\left[\begin{array}{r}#1 \\ #2 \end{array}\right]}\) \(\newcommand{\ctwovec}[2]{\left[\begin{array}{c}#1 \\ #2 \end{array}\right]}\) \(\newcommand{\threevec}[3]{\left[\begin{array}{r}#1 \\ #2 \\ #3 \end{array}\right]}\) \(\newcommand{\cthreevec}[3]{\left[\begin{array}{c}#1 \\ #2 \\ #3 \end{array}\right]}\) \(\newcommand{\fourvec}[4]{\left[\begin{array}{r}#1 \\ #2 \\ #3 \\ #4 \end{array}\right]}\) \(\newcommand{\cfourvec}[4]{\left[\begin{array}{c}#1 \\ #2 \\ #3 \\ #4 \end{array}\right]}\) \(\newcommand{\fivevec}[5]{\left[\begin{array}{r}#1 \\ #2 \\ #3 \\ #4 \\ #5 \\ \end{array}\right]}\) \(\newcommand{\cfivevec}[5]{\left[\begin{array}{c}#1 \\ #2 \\ #3 \\ #4 \\ #5 \\ \end{array}\right]}\) \(\newcommand{\mattwo}[4]{\left[\begin{array}{rr}#1 \amp #2 \\ #3 \amp #4 \\ \end{array}\right]}\) \(\newcommand{\laspan}[1]{\text{Span}\{#1\}}\) \(\newcommand{\bcal}{\cal B}\) \(\newcommand{\ccal}{\cal C}\) \(\newcommand{\scal}{\cal S}\) \(\newcommand{\wcal}{\cal W}\) \(\newcommand{\ecal}{\cal E}\) \(\newcommand{\coords}[2]{\left\{#1\right\}_{#2}}\) \(\newcommand{\gray}[1]{\color{gray}{#1}}\) \(\newcommand{\lgray}[1]{\color{lightgray}{#1}}\) \(\newcommand{\rank}{\operatorname{rank}}\) \(\newcommand{\row}{\text{Row}}\) \(\newcommand{\col}{\text{Col}}\) \(\renewcommand{\row}{\text{Row}}\) \(\newcommand{\nul}{\text{Nul}}\) \(\newcommand{\var}{\text{Var}}\) \(\newcommand{\corr}{\text{corr}}\) \(\newcommand{\len}[1]{\left|#1\right|}\) \(\newcommand{\bbar}{\overline{\bvec}}\) \(\newcommand{\bhat}{\widehat{\bvec}}\) \(\newcommand{\bperp}{\bvec^\perp}\) \(\newcommand{\xhat}{\widehat{\xvec}}\) \(\newcommand{\vhat}{\widehat{\vvec}}\) \(\newcommand{\uhat}{\widehat{\uvec}}\) \(\newcommand{\what}{\widehat{\wvec}}\) \(\newcommand{\Sighat}{\widehat{\Sigma}}\) \(\newcommand{\lt}{<}\) \(\newcommand{\gt}{>}\) \(\newcommand{\amp}{&}\) \(\definecolor{fillinmathshade}{gray}{0.9}\)Precipitation and volatilization gravimetric methods require that the analyte, or some other species in the sample, participates in a chemical reaction. In a direct precipitation gravimetric analysis, for example, we convert a soluble analyte into an insoluble form that precipitates from solution. In some situations, however, the analyte already is present in a particulate form that is easy to separate from its liquid, gas, or solid matrix. When such a separation is possible, we can determine the analyte’s mass without relying on a chemical reaction.
A particulate is any tiny portion of matter, whether it is a speck of dust, a globule of fat, or a molecule of ammonia. For particulate gravimetry we simply need a method to collect the particles and a balance to measure their mass.
Theory and Practice
There are two methods for separating a particulate analyte from its matrix. The most common method is filtration, in which we separate solid particulates from their gas, liquid, or solid matrix. A second method, which is useful for gas particles, solutes, and solids, is an extraction.
Filtration
To separate solid particulates from their matrix we use gravity or apply suction from a vacuum pump or an aspirator to pull the sample through a filter. The type of filter we use depends upon the size of the solid particles and the sample’s matrix. Filters for liquid samples are constructed from a variety of materials, including cellulose fibers, glass fibers, cellulose nitrate, and polytetrafluoroethylene (PTFE). Particle retention depends on the size of the filter’s pores. Cellulose fiber filter papers range in pore size from 30 μm to 2–3 μm. Glass fiber filters, manufactured using chemically inert borosilicate glass, are available with pore sizes between 2.5 μm and 0.3 μm. Membrane filters, which are made from a variety of materials, including cellulose nitrate and PTFE, are available with pore sizes from 5.0 μm to 0.1 μm.
For additional information, see our earlier discussion in this chapter on filtering precipitates, and the discussion in Chapter 7 of separations based on size.
Solid aerosol particulates are collected using either a single-stage or a multiple-stage filter. In a single-stage system, we pull the gas through a single filter, which retains particles larger than the filter’s pore size. To collect samples from a gas line, we place the filter directly in the line. Atmospheric gases are sampled with a high volume sampler that uses a vacuum pump to pull air through the filter at a rate of approximately 75 m3/h. In either case, we can use the same filtering media for liquid samples to collect aerosol particulates. In a multiple-stage system, a series of filtering units separates the particles into two or more size ranges.
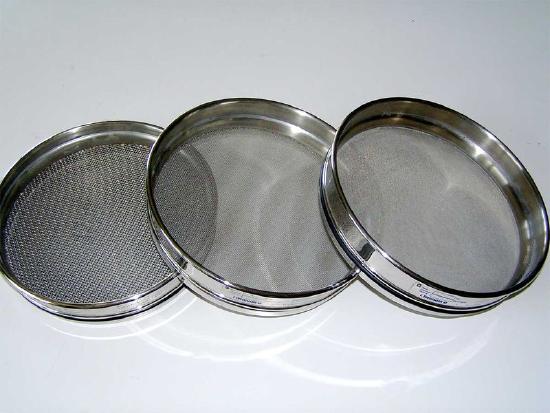
The particulates in a solid matrix are separated by size using one or more sieves (Figure \(\PageIndex{1}\)). Sieves are available in a variety of mesh sizes, ranging from approximately 25 mm to 40 μm. By stacking together sieves of different mesh size, we can isolate particulates into several narrow size ranges. Using the sieves in Figure \(\PageIndex{1}\), for example, we can separate a solid into particles with diameters >1700 μm, with diameters between 1700 μm and 500 μm, with diameters between 500 μm and 250 μm, and those with a diameter <250 μm.

Extraction
Filtering limits particulate gravimetry to solid analytes that are easy to separate from their matrix. We can extend particulate gravimetry to the analysis of gas phase analytes, solutes, and solids that are difficult to filter if we extract them with a suitable solvent. After the extraction, we evaporate the solvent and determine the analyte’s mass. Alternatively, we can determine the analyte indirectly by measuring the change in the sample’s mass after we extract the analyte.
For a more detailed review of extractions, particularly solid-phase extractions, see Chapter 7.
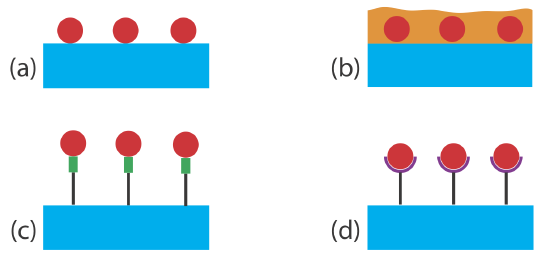
Another method for extracting an analyte from its matrix is by adsorption onto a solid substrate, by absorption into a thin polymer film or chemical film coated on a solid substrate, or by chemically binding to a suitable receptor that is covalently bound to a solid substrate (Figure \(\PageIndex{2}\)). Adsorption, absorption, and binding occur at the interface between the solution that contains the analyte and the substrate’s surface, the thin film, or the receptor. Although the amount of extracted analyte is too small to measure using a conventional balance, it can be measured using a quartz crystal microbalance.

The measurement of mass using a quartz crystal microbalance takes advantage of the piezoelectric effect [(a) Ward, M. D.; Buttry, D. A. Science 1990, 249, 1000–1007; (b) Grate, J. W.; Martin, S. J. ; White, R. M. Anal. Chem. 1993, 65, 940A–948A; (c) Grate, J. W.; Martin, S. J. ; White, R. M. Anal. Chem. 1993, 65, 987A–996A.]. The application of an alternating electrical field across a quartz crystal induces an oscillatory vibrational motion in the crystal. Every quartz crystal vibrates at a characteristic resonant frequency that depends on the crystal’s properties, including the mass per unit area of any material coated on the crystal’s surface. The change in mass following adsorption, absorption, or binding of the analyte is determined by monitoring the change in the quartz crystal’s characteristic resonant frequency. The exact relationship between the change in frequency and mass is determined by a calibration curve.
If you own a wristwatch, there is a good chance that its operation relies on a quartz crystal. The piezoelectric properties of quartz were discovered in 1880 by Paul-Jacques Currie and Pierre Currie. Because the oscillation frequency of a quartz crystal is so precise, it quickly found use in the keeping of time. The first quartz clock was built in 1927 at the Bell Telephone labs, and Seiko introduced the first quartz wristwatches in 1969.
Quantitative Applications
Particulate gravimetry is important in the environmental analysis of water, air, and soil samples. The analysis for suspended solids in water samples, for example, is accomplished by filtering an appropriate volume of a well-mixed sample through a glass fiber filter and drying the filter to constant weight at 103–105oC.
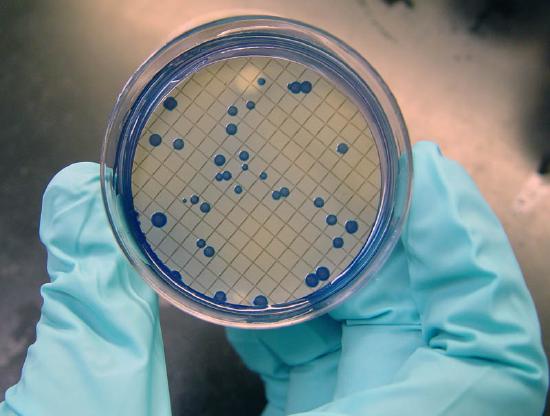
The microbiological testing of water also uses particulate gravimetry. One example is the analysis for coliform bacteria in which an appropriate volume of sample is passed through a sterilized 0.45-μm membrane filter. The filter is placed on a sterilized absorbent pad that is saturated with a culturing medium and incubated for 22–24 hours at 35 ± 0.5oC. Coliform bacteria are identified by the presence of individual bacterial colonies that form during the incubation period (Figure \(\PageIndex{3}\)). As with qualitative applications of precipitation gravimetry, the signal in this case is a visual observation of the number of colonies rather than a measurement of mass.

Total airborne particulates are determined using a high-volume air sampler equipped with either a cellulose fiber or a glass fiber filter. Samples from urban environments require approximately 1 h of sampling time, but samples from rural environments require substantially longer times.
Grain size distributions for sediments and soils are used to determine the amount of sand, silt, and clay in a sample. For example, a grain size of 2 mm serves as the boundary between gravel and sand. The grain size for the sand–silt and the silt–clay boundaries are 1/16 mm and 1/256 mm, respectively.
Several standard quantitative analytical methods for agricultural products are based on measuring the sample’s mass following a selective solvent extraction. For example, the crude fat content in chocolate is determined by extracting with ether for 16 hours in a Soxhlet extractor. After the extraction is complete, the ether is allowed to evaporate and the residue is weighed after drying at 100oC. This analysis also can be accomplished indirectly by weighing a sample before and after extracting with supercritical CO2.
Quartz crystal microbalances equipped with thin film polymer films or chemical coatings have found numerous quantitative applications in environmental analysis. Methods are reported for the analysis of a variety of gaseous pollutants, including ammonia, hydrogen sulfide, ozone, sulfur dioxide, and mercury. Biochemical particulate gravimetric sensors also have been developed. For example, a piezoelectric immunosensor has been developed that shows a high selectivity for human serum albumin, and is capable of detecting microgram quantities [Muratsugu, M.; Ohta, F.; Miya, Y.; Hosokawa, T.; Kurosawa, S.; Kamo, N.; Ikeda, H. Anal. Chem. 1993, 65, 2933–2937].
Quantitative Calculations
The result of a quantitative analysis by particulate gravimetry is just the ratio, using appropriate units, of the amount of analyte relative to the amount of sample.
A 200.0-mL sample of water is filtered through a pre-weighed glass fiber filter. After drying to constant weight at 105oC, the filter is found to have increased in mass by 48.2 mg. Determine the sample’s total suspended solids.
Solution
One ppm is equivalent to one mg of analyte per liter of solution; thus, the total suspended solids for the sample is
\[\frac{48.2 \ \mathrm{mg} \text { solids }}{0.2000 \ \mathrm{L} \text { sample }}=241 \ \mathrm{ppm} \text { solids } \nonumber\]
Evaluating Particulate Gravimetry
The scale of operation and the detection limit for particulate gravimetry can be extended beyond that of other gravimetric methods by increasing the size of the sample taken for analysis. This usually is impracticable for other gravimetric methods because it is difficult to manipulate a larger sample through the individual steps of the analysis. With particulate gravimetry, however, the part of the sample that is not analyte is removed when filtering or extracting. Consequently, particulate gravimetry easily is extended to the analysis of trace-level analytes.
Except for methods that rely on a quartz crystal microbalance, particulate gravimetry uses the same balances as other gravimetric methods, and is capable of achieving similar levels of accuracy and precision. Because particulate gravimetry is defined in terms of the mass of the particle themselves, the sensitivity of the analysis is given by the balance’s sensitivity. Selectivity, on the other hand, is determined either by the filter’s pore size or by the properties of the extracting phase. Because it requires a single step, particulate gravimetric methods based on filtration generally require less time, labor and capital than other gravimetric methods.


