
13.13: Uses of ¹H NMR Spectroscopy
- Page ID
- 67299
\( \newcommand{\vecs}[1]{\overset { \scriptstyle \rightharpoonup} {\mathbf{#1}} } \)
\( \newcommand{\vecd}[1]{\overset{-\!-\!\rightharpoonup}{\vphantom{a}\smash {#1}}} \)
\( \newcommand{\id}{\mathrm{id}}\) \( \newcommand{\Span}{\mathrm{span}}\)
( \newcommand{\kernel}{\mathrm{null}\,}\) \( \newcommand{\range}{\mathrm{range}\,}\)
\( \newcommand{\RealPart}{\mathrm{Re}}\) \( \newcommand{\ImaginaryPart}{\mathrm{Im}}\)
\( \newcommand{\Argument}{\mathrm{Arg}}\) \( \newcommand{\norm}[1]{\| #1 \|}\)
\( \newcommand{\inner}[2]{\langle #1, #2 \rangle}\)
\( \newcommand{\Span}{\mathrm{span}}\)
\( \newcommand{\id}{\mathrm{id}}\)
\( \newcommand{\Span}{\mathrm{span}}\)
\( \newcommand{\kernel}{\mathrm{null}\,}\)
\( \newcommand{\range}{\mathrm{range}\,}\)
\( \newcommand{\RealPart}{\mathrm{Re}}\)
\( \newcommand{\ImaginaryPart}{\mathrm{Im}}\)
\( \newcommand{\Argument}{\mathrm{Arg}}\)
\( \newcommand{\norm}[1]{\| #1 \|}\)
\( \newcommand{\inner}[2]{\langle #1, #2 \rangle}\)
\( \newcommand{\Span}{\mathrm{span}}\) \( \newcommand{\AA}{\unicode[.8,0]{x212B}}\)
\( \newcommand{\vectorA}[1]{\vec{#1}} % arrow\)
\( \newcommand{\vectorAt}[1]{\vec{\text{#1}}} % arrow\)
\( \newcommand{\vectorB}[1]{\overset { \scriptstyle \rightharpoonup} {\mathbf{#1}} } \)
\( \newcommand{\vectorC}[1]{\textbf{#1}} \)
\( \newcommand{\vectorD}[1]{\overrightarrow{#1}} \)
\( \newcommand{\vectorDt}[1]{\overrightarrow{\text{#1}}} \)
\( \newcommand{\vectE}[1]{\overset{-\!-\!\rightharpoonup}{\vphantom{a}\smash{\mathbf {#1}}}} \)
\( \newcommand{\vecs}[1]{\overset { \scriptstyle \rightharpoonup} {\mathbf{#1}} } \)
\( \newcommand{\vecd}[1]{\overset{-\!-\!\rightharpoonup}{\vphantom{a}\smash {#1}}} \)
\(\newcommand{\avec}{\mathbf a}\) \(\newcommand{\bvec}{\mathbf b}\) \(\newcommand{\cvec}{\mathbf c}\) \(\newcommand{\dvec}{\mathbf d}\) \(\newcommand{\dtil}{\widetilde{\mathbf d}}\) \(\newcommand{\evec}{\mathbf e}\) \(\newcommand{\fvec}{\mathbf f}\) \(\newcommand{\nvec}{\mathbf n}\) \(\newcommand{\pvec}{\mathbf p}\) \(\newcommand{\qvec}{\mathbf q}\) \(\newcommand{\svec}{\mathbf s}\) \(\newcommand{\tvec}{\mathbf t}\) \(\newcommand{\uvec}{\mathbf u}\) \(\newcommand{\vvec}{\mathbf v}\) \(\newcommand{\wvec}{\mathbf w}\) \(\newcommand{\xvec}{\mathbf x}\) \(\newcommand{\yvec}{\mathbf y}\) \(\newcommand{\zvec}{\mathbf z}\) \(\newcommand{\rvec}{\mathbf r}\) \(\newcommand{\mvec}{\mathbf m}\) \(\newcommand{\zerovec}{\mathbf 0}\) \(\newcommand{\onevec}{\mathbf 1}\) \(\newcommand{\real}{\mathbb R}\) \(\newcommand{\twovec}[2]{\left[\begin{array}{r}#1 \\ #2 \end{array}\right]}\) \(\newcommand{\ctwovec}[2]{\left[\begin{array}{c}#1 \\ #2 \end{array}\right]}\) \(\newcommand{\threevec}[3]{\left[\begin{array}{r}#1 \\ #2 \\ #3 \end{array}\right]}\) \(\newcommand{\cthreevec}[3]{\left[\begin{array}{c}#1 \\ #2 \\ #3 \end{array}\right]}\) \(\newcommand{\fourvec}[4]{\left[\begin{array}{r}#1 \\ #2 \\ #3 \\ #4 \end{array}\right]}\) \(\newcommand{\cfourvec}[4]{\left[\begin{array}{c}#1 \\ #2 \\ #3 \\ #4 \end{array}\right]}\) \(\newcommand{\fivevec}[5]{\left[\begin{array}{r}#1 \\ #2 \\ #3 \\ #4 \\ #5 \\ \end{array}\right]}\) \(\newcommand{\cfivevec}[5]{\left[\begin{array}{c}#1 \\ #2 \\ #3 \\ #4 \\ #5 \\ \end{array}\right]}\) \(\newcommand{\mattwo}[4]{\left[\begin{array}{rr}#1 \amp #2 \\ #3 \amp #4 \\ \end{array}\right]}\) \(\newcommand{\laspan}[1]{\text{Span}\{#1\}}\) \(\newcommand{\bcal}{\cal B}\) \(\newcommand{\ccal}{\cal C}\) \(\newcommand{\scal}{\cal S}\) \(\newcommand{\wcal}{\cal W}\) \(\newcommand{\ecal}{\cal E}\) \(\newcommand{\coords}[2]{\left\{#1\right\}_{#2}}\) \(\newcommand{\gray}[1]{\color{gray}{#1}}\) \(\newcommand{\lgray}[1]{\color{lightgray}{#1}}\) \(\newcommand{\rank}{\operatorname{rank}}\) \(\newcommand{\row}{\text{Row}}\) \(\newcommand{\col}{\text{Col}}\) \(\renewcommand{\row}{\text{Row}}\) \(\newcommand{\nul}{\text{Nul}}\) \(\newcommand{\var}{\text{Var}}\) \(\newcommand{\corr}{\text{corr}}\) \(\newcommand{\len}[1]{\left|#1\right|}\) \(\newcommand{\bbar}{\overline{\bvec}}\) \(\newcommand{\bhat}{\widehat{\bvec}}\) \(\newcommand{\bperp}{\bvec^\perp}\) \(\newcommand{\xhat}{\widehat{\xvec}}\) \(\newcommand{\vhat}{\widehat{\vvec}}\) \(\newcommand{\uhat}{\widehat{\uvec}}\) \(\newcommand{\what}{\widehat{\wvec}}\) \(\newcommand{\Sighat}{\widehat{\Sigma}}\) \(\newcommand{\lt}{<}\) \(\newcommand{\gt}{>}\) \(\newcommand{\amp}{&}\) \(\definecolor{fillinmathshade}{gray}{0.9}\)Objective
After completing this section, you should be able to use data from 1H NMR spectra to distinguish between two (or more) possible structures for an unknown organic compound.
There will be cases in which you already know what the structure might be. In these cases:
- You should draw attention to pieces of data that most strongly support your expected structure. This approach will demonstrate evaluative understanding of the data; that means you can look at data and decide what parts are more crucial than others.
- You should also draw attention to negative results: that is, peaks that might be there if this spectrum matched another, possible structure, but that are in fact missing.
One of the most complicated problems to deal with is the analysis of a mixture. This situation is not uncommon when students run reactions in lab and analyse the data.
- Sometimes the spectra show a little starting material mixed in with the product.
- Sometimes solvents show up in the spectrum.
- As you might expect, the minor component usually shows up as smaller peaks in the spectrum. If there are fewer molecules present, then there are usually fewer protons to absorb in the spectrum.
- In this case, you should probably make two completely separate sets of data tables for your analysis, one for each compound, or else one for the main compound and one for impurities.
Remember that integration ratios are really only meaningful within a single compound. If your NMR sample contains some benzene (C6H6) and some acetone (CH3COCH3), and there is a peak at 7.15 that integrates to 1 proton and a peak at 2.10 ppm integrating to 6 protons, it might mean there are 6 protons in acetone and 1 in benzene, but you can tell that isn't true by looking at the structure. There must be six times as many acetone molecules as benzene molecules in the sample.
There are six protons in the benzene, and they should all show up near 7 ppm. There are six protons in acetone, and they should all show up near 2 ppm. Assuming that small integral of 1H for the benzene is really supposed to be 6H, then the large integral of 6H for the acetone must also represent six times as many hydrogens, too. It would be 36 H. There are only six hydrogens in acetone, so it must represent six times as many acetone molecules as there are benzenes.
Similarly, if you have decided that you can identify two sets of peaks in the 1H spectrum, analysing them in different tables makes it easy to keep the integration analysis completely separate too ; 1 H in one table will not be the same size integral as 1 H in the other table unless the concentrations of the two compounds in the sample are the same.
However, comparing the ratio of two integrals for two different compounds can give you the ratio of the two compounds in solution, just as we could determine the ratio of benzene to acetone in the mixture described above.
We will look at two examples of sample mixtures that could arise in lab. Results like these are pretty common events in the labIn the first example, a student tried to carry out the following reaction, a borohydride reduction of an aldehyde. The borohydride should give a hydride anion to the C=O carbon; washing with water should then supply a proton to the oxygen, giving an alcohol.
Her reaction produced the following spectrum.
(simulated data)
From this data, she produced the table below.
Notice how she calculated that ratio. She found a peak in molecule 1, the aldehyde, that she was pretty sure corresponded to the aldehydic hydrogen, the H attached to the C=O; in other words, the CH=O. She found another peak from molecule 2, the alcohol, that she was pretty sure represented the two hydrogens on the carbon attached to oxygen, the CH2-O.
The integrals for those two peaks are equal. They are both 2H in her table. However, she notes that within each molecule, the first integral really represents 1H and the second represents 2H. That means there must be twice as many of molecule 1 as there are molecule 2. That way, there would be 2 x CH=O, and its integral would be the same as the 1 x CH2-O in the other molecule.
One way to approach this kind of problem is to:
- choose one peak from each of the two compounds you want to compare.
- decide how many hydrogens each peak is supposed to represent in a molecule. Is it supposed to be a CH2, a CH, a CH3?
- divide the integral value for that peak by that number of hydrogens it is supposed to represent in a molecule.
- compare the two answers (integral A / ideal # H) vs (integral B / ideal # H).
- the ratio of those two answers is the ratio of the two molecules in the sample.
So there is twice as much aldehyde as alcohol in the mixture. In terms of these two compounds alone, she has 33% alcohol and 66% aldehyde. That's ( 1/(1+2) ) x100% for the alcohol, and ( 2/(1+2) ) x100% for the aldehyde. That calculation just represents the amount of individual component divided by the total of the components she wants to compare.
There are a number of things to take note of here.
- Her reaction really didn't work very well. She still has majority starting material, not product.
- She will get a good grade on this lab. Although the experiment didn't work well, she has good data, and she has analyzed it very clearly.
- She has separated her data table into different sections for different compounds. Sometimes that makes it easier to analyze things.
- She has noted the actual integral data (she may have measured the integral with a ruler) and also converted it into a more convenient ratio, based on the integral for a peak that she felt certain about.
- She went one step further, and indicated the internal integration ratio within each individual compound.
- She calculated the % completion of the reaction using the integral data for the reactant and product, and she made clear what part of the data she used for that calculation. A similar procedure could be done if a student were just trying to separate two components in a mixture rather than carry out a reaction.
- She also calculated the overall purity of the mixture, including a solvent impurity that she failed to remove.
- However, CHCl3 is not included in her analysis of purity. CHCl3 really isn't part of her sample; it was just present in the NMR solvent, so it doesn't represent anything in the material she ended up with at the end of lab.
Another student carried out a similar reaction, shown below. He also finished the reaction by washing with water, but because methanol is soluble in water, he had to extract his product out of the water. He chose to use dichloromethane for that purpose.
He obtained the following data.

From this data, he constructed the following table.
There are some things to learn about this table, too.
- Does the integration ratio really match the integral data? Or is this just wishful thinking?
- This table might reflect what he wants to see in the data. But what else could be in the data?
- CHCl3 is often seen in NMR spectra if CDCl3 is used for the NMR sample. It's there, at 7.2 ppm.
- "Leftover" or residual solvent is very common in real lab data. There it is, CH2Cl2 from the extraction, at 5.4 ppm.
- What about water? Sometimes people don't dry their solutions properly before evaporating the solvent. There is probably water around 1.5 to 1.6 ppm here.
This student might not get a very good grade; the sample does not even show up in the spectrum, so he lost it somewhere. But his analysis is also poor, so he will really get a terrible grade.
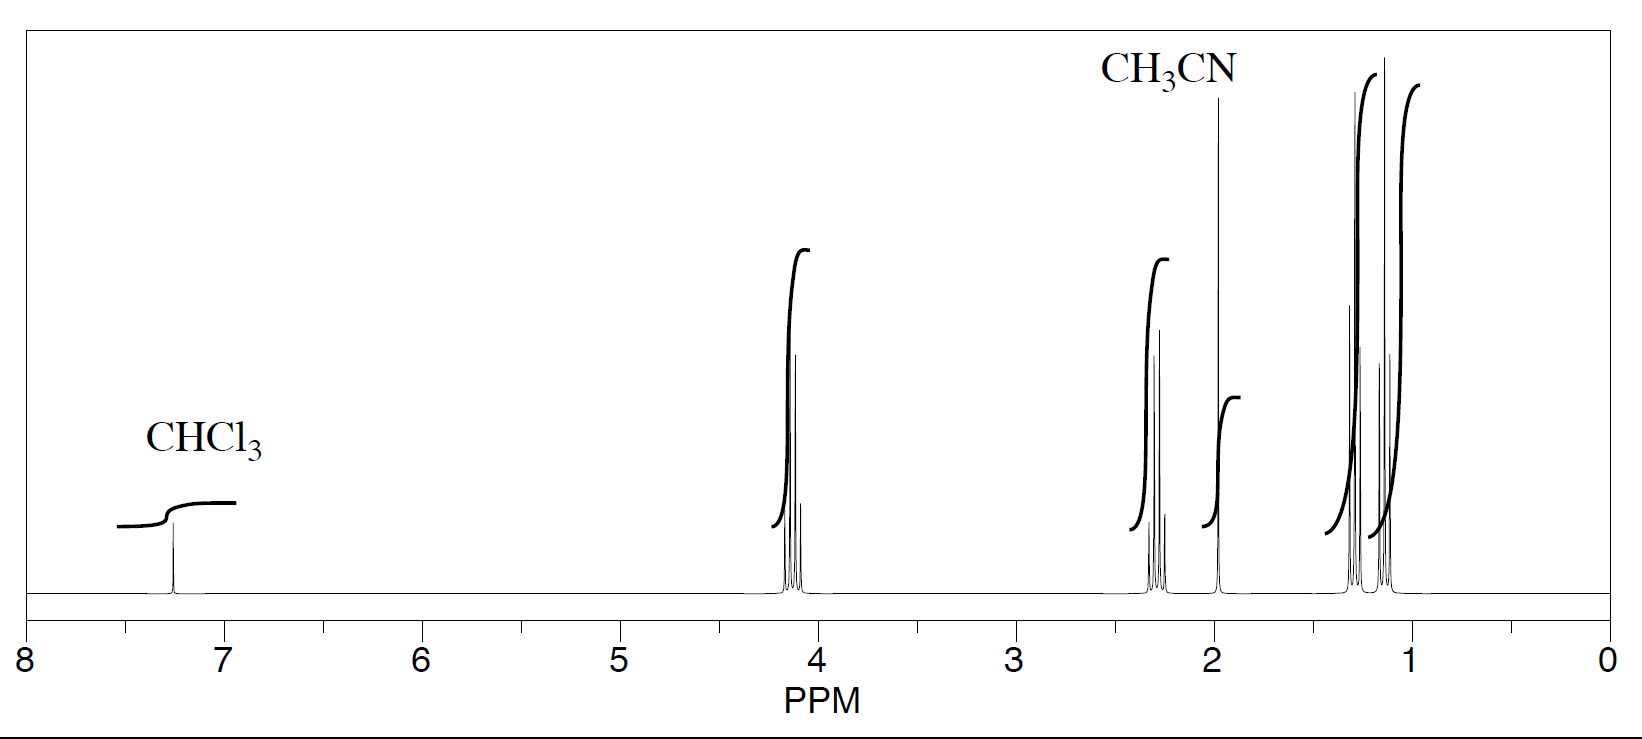
Three students performed a synthesis of a fragrant ester, ethyl propanoate, CH3CH2CO2CH2CH3. During their reactions, they each used a different solvent. The students were able to see peaks in the NMR spectrum for ethyl propanoate, as well as peaks for chloroform (CHCl3, in the CDCl3 they used to make their NMR samples).
- See the first student's spectrum:
-
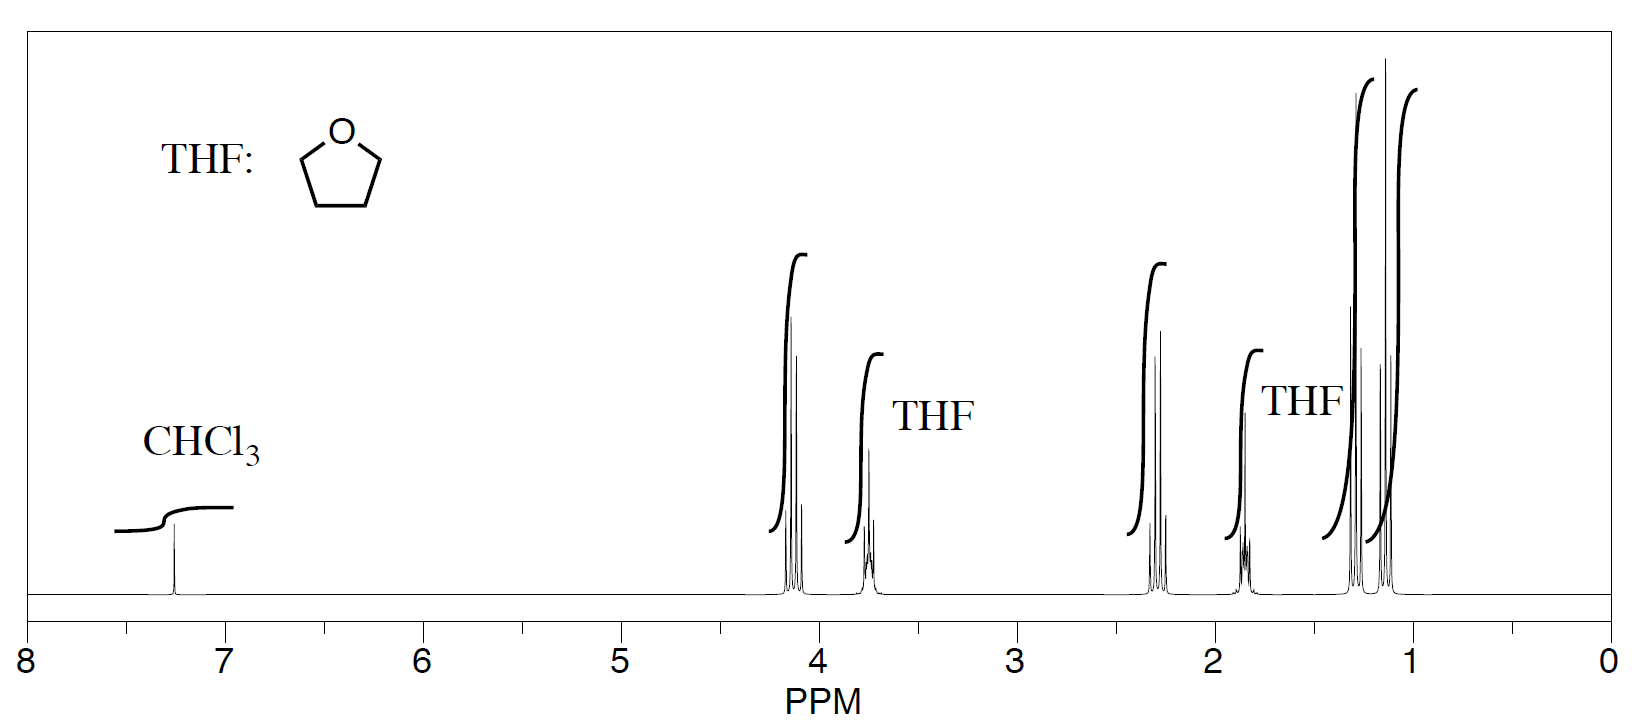
- See the second student's spectrum:
-
- See the third student's spectrum:
-
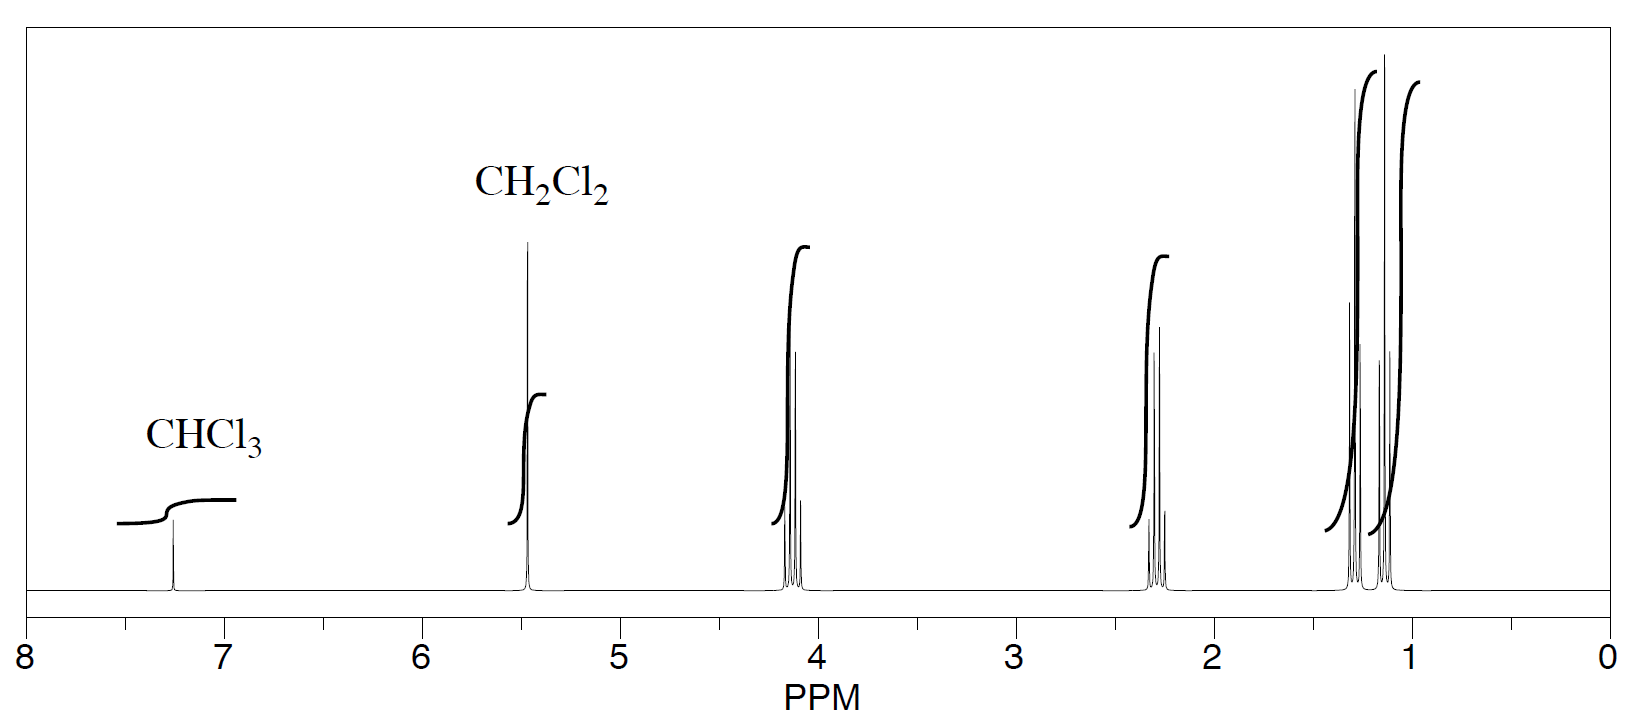
They were also able to determine that they had some leftover solvent in their samples by consulting a useful table of solvent impurities in NMR (which they found in Goldberg et. al., Organometallics 2010, 29, 2176-2179).
- What is the ratio of leftover solvent to ethyl propanoate in each sample?
- What is the percent of each sample that is leftover solvent
Exercise
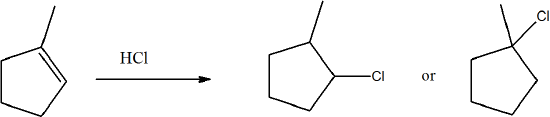
How can H1 NMR determine products? For example, how can you tell the difference between the products of this reaction?
- Answer
-
Yes, you are able to determine the difference in the spectra. For the 2-chloro compound will have multiple quartets while the 1-chloro compound will only have a quintet and a triplet for the signals in the ring.
Additional NMR Examples
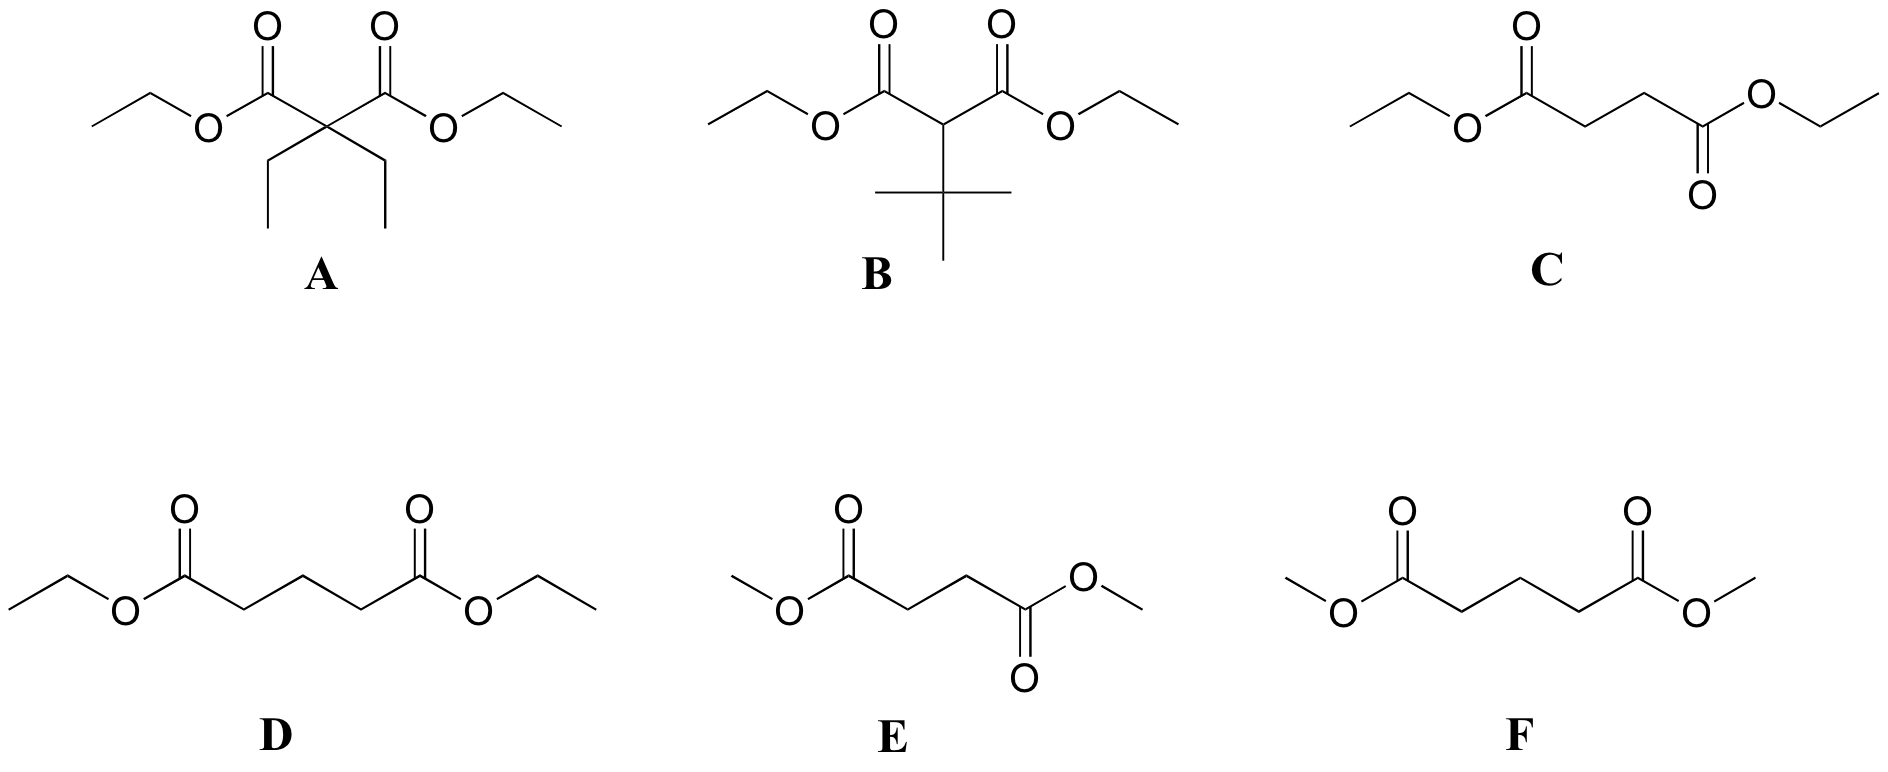
Match spectra 1-6 below to their corresponding structures A-F.
Structures:
Spectrum 1
| δ | splitting | integration |
| 4.13 | q | 2 |
| 2.45 | t | 2 |
| 1.94 | quintet | 1 |
| 1.27 | t | 3 |
Spectrum 2
| δ | splitting | integration |
| 3.68 | s | 3 |
| 2.99 | t | 2 |
| 1.95 | quintet | 1 |
Spectrum 3
| δ | splitting | integration |
| 4.14 | q | 1 |
| 2.62 | s | 1 |
| 1.26 | t | 1.5 |
Spectrum 4
| δ | splitting | integration |
| 4.14 | q | 4 |
| 3.22 | s | 1 |
| 1.27 | t | 6 |
| 1.13 | s | 9 |
Spectrum 5
| δ | splitting | integration |
| 4.18 | q | 1 |
| 1.92 | q | 1 |
| 1.23 | t | 1.5 |
| 0.81 | t | 1.5 |
Spectrum 6
| δ | splitting | integration |
| 3.69 | s | 1.5 |
| 2.63 | s | 1 |
Solution:
Spectrum 1: structure D
Spectrum 2: structure F
Spectrum 3: structure C
Spectrum 4: structure B
Spectrum 5: structure A
Spectrum 6: structure E
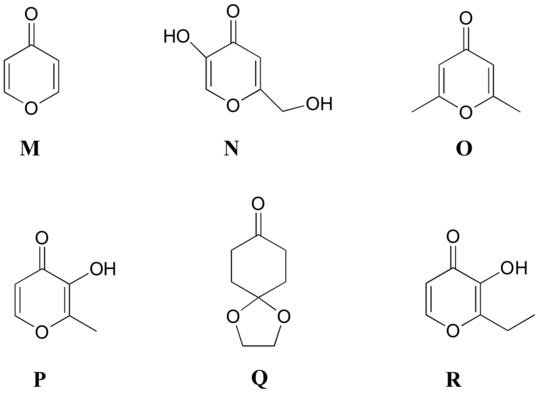
Match the 1H-NMR spectra 13-18 below to their corresponding structures M-R .
Structures:
Spectrum 13
| δ | splitting | integration |
| 8.15 | d | 1 |
| 6.33 | d | 1 |
Spectrum 14
| δ | splitting | integration |
| 6.05 | s | 1 |
| 2.24 | s | 3 |
Spectrum 15
| δ | splitting | integration |
| 8.57 | s (b) | 1 |
| 7.89 | d | 1 |
| 6.30 | d | 1 |
| 2.28 | s | 3 |
Spectrum 16
| δ | splitting | integration |
| 9.05 | s (b) | 1 |
| 8.03 | s | 1 |
| 6.34 | s | 1 |
| 5.68 | s (b) | 1 |
| 4.31 | s | 2 |
Spectrum 17
| δ | splitting | integration |
| 7.76 | d | 1 |
| 7.57 | s (b) | 1 |
| 6.44 | d | 1 |
| 2.78 | q | 2 |
| 1.25 | t | 3 |
Spectrum 18
| δ | splitting | integration |
| 4.03 | s | 1 |
| 2.51 | t | 1 |
| 2.02 | t | 1 |
Solution:
Spectrum 13: structure M
Spectrum 14: structure O
Spectrum 15: structure P
Spectrum 16: structure N
Spectrum 17: structure R
Spectrum 18: structure Q
Match the 1H-NMR spectra 31-36 below to their corresponding structures GG-LL
Structures:

Spectrum 31
| δ | splitting | integration |
| 6.98 | d | 1 |
| 6.64 | d | 1 |
| 6.54 | s | 1 |
| 4.95 | s | 1 |
| 2.23 | s | 3 |
| 2.17 | s | 3 |
Spectrum 32
| δ | splitting | integration |
| 7.08 | d | 1 |
| 6.72 | d | 1 |
| 6.53 | s | 1 |
| 4.81 | s | 1 |
| 3.15 | 7-tet | 1 |
| 2.24 | s | 3 |
| 1.22 | d | 6 |
Spectrum 33
| δ | splitting | integration |
| 7.08 | d | 2 |
| 6.71 | d | 2 |
| 6.54 | s | 1 |
| 3.69 | s | 3 |
| 3.54 | s | 2 |
Spectrum 34
| δ | splitting | integration |
| 9.63 | s | 1 |
| 7.45 | d | 2 |
| 6.77 | d | 2 |
| 3.95 | q | 2 |
| 2.05 | s | 3 |
| 1.33 | t | 3 |
Spectrum 35
| δ | splitting | integration |
| 9.49 | s | 1 |
| 7.20 | d | 2 |
| 6.49 | d | 2 |
| 4.82 | s | 2 |
| 1.963 | s | 3 |
Spectrum 36
| δ | splitting | integration |
| 9.58 | s(b) | 1 |
| 9.31 | s | 1 |
| 7.36 | d | 1 |
| 6.67 | s | 1 |
| 6.55 | d | 1 |
| 2.21 | s | 3 |
| 2.11 | s | 3 |
Solution:
Spectrum 31: structure HH
Spectrum 32: structure KK
Spectrum 33: structure LL
Spectrum 34: structure GG
Spectrum 35: structure JJ
Spectrum 36: structure II
You obtain the following data for an unknown sample. Deduce its structure.
Combustion Analysis: C (69.7%); H (11.7%)
1H-NMR:

Mass Spectrometry:

Solution: The structure is 3-methyl-2-butanone.
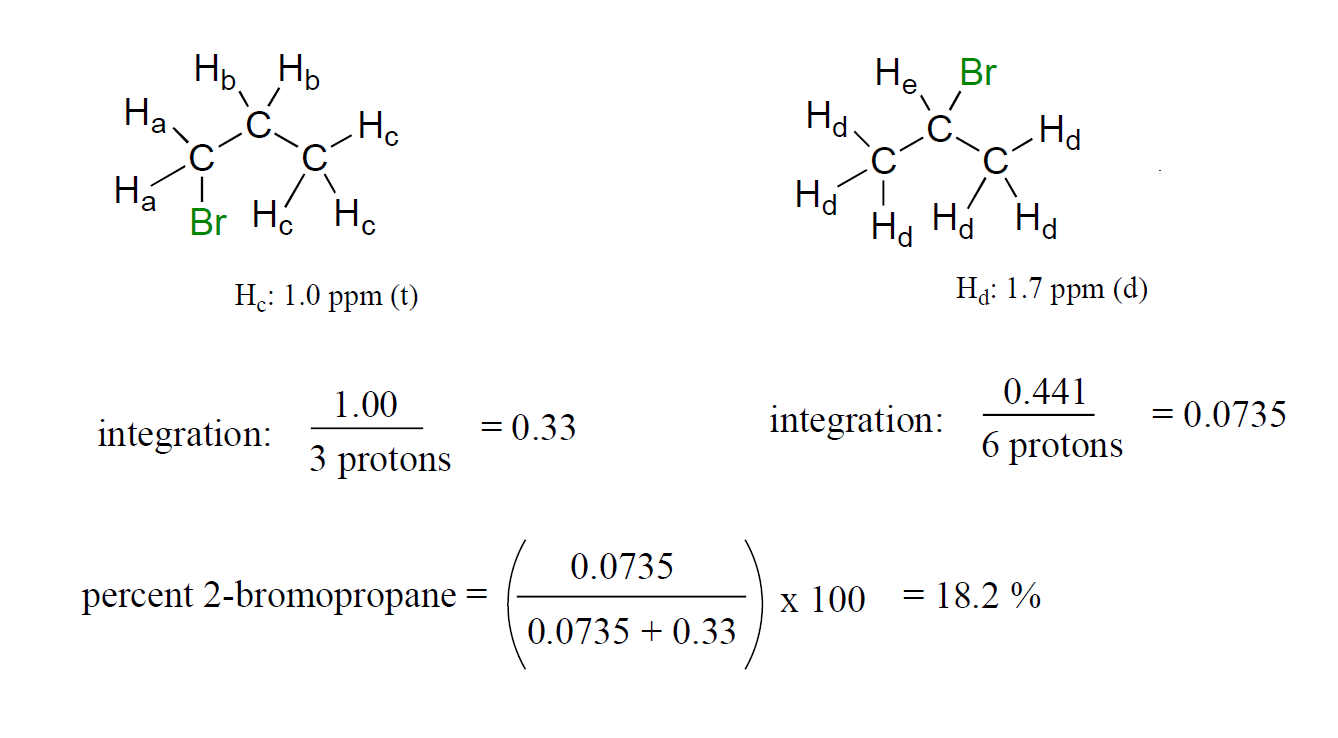
You take a 1H-NMR spectrum of a sample that comes from a bottle of 1-bromopropane. However, you suspect that the bottle might be contaminated with 2-bromopropane. The NMR spectrum shows the following peaks:
| δ | splitting | integration |
| 4.3 | septet | 0.0735 |
| 3.4 | triplet | 0.661 |
| 1.9 | sextet | 0.665 |
| 1.7 | doublet | 0.441 |
| 1.0 | triplet | 1.00 |
How badly is the bottle contaminated? Specifically, what percent of the molecules in the bottle are 2-bromopropane?
Solution:
First, assign the peaks.
1-bromopropane: Ha is the triplet at 3.4 ppm, Hb is the sextet at 1.9 ppm, Hc is the triplet at 1.0 ppm.
2-bromopropane: Hd is the doublet at 1.7 ppm, He is the septet at 4.3 ppm.
Now, just add up the integrations for each molecule and figure the percentage.
1-bromopropane: 0.661 + 0.665 + 1.00 = 2.326.
2-bromopropane: 0.0735 + 0.441 = 0.5145.
Percent 2-bromopropane is (0.5145)*100 / (0.5145 + 2.326) = 18.1%.
Notice that even if some peaks overlapped, you could still get this number as long as you could integrate one signal on each molecule: you could, for example, do the samecalculation (and get the same result) by comparing integrations of Hc and Hd signals, and just scale based on the fact that the Hc signal represents three protons while the Hd signal represents six protons.
Contributors and Attributions
Dr. Dietmar Kennepohl FCIC (Professor of Chemistry, Athabasca University)
Prof. Steven Farmer (Sonoma State University)
Organic Chemistry With a Biological Emphasis by Tim Soderberg (University of Minnesota, Morris)
Chris P Schaller, Ph.D., (College of Saint Benedict / Saint John's University)