
Fluorescence
- Page ID
- 1766
\( \newcommand{\vecs}[1]{\overset { \scriptstyle \rightharpoonup} {\mathbf{#1}} } \)
\( \newcommand{\vecd}[1]{\overset{-\!-\!\rightharpoonup}{\vphantom{a}\smash {#1}}} \)
\( \newcommand{\dsum}{\displaystyle\sum\limits} \)
\( \newcommand{\dint}{\displaystyle\int\limits} \)
\( \newcommand{\dlim}{\displaystyle\lim\limits} \)
\( \newcommand{\id}{\mathrm{id}}\) \( \newcommand{\Span}{\mathrm{span}}\)
( \newcommand{\kernel}{\mathrm{null}\,}\) \( \newcommand{\range}{\mathrm{range}\,}\)
\( \newcommand{\RealPart}{\mathrm{Re}}\) \( \newcommand{\ImaginaryPart}{\mathrm{Im}}\)
\( \newcommand{\Argument}{\mathrm{Arg}}\) \( \newcommand{\norm}[1]{\| #1 \|}\)
\( \newcommand{\inner}[2]{\langle #1, #2 \rangle}\)
\( \newcommand{\Span}{\mathrm{span}}\)
\( \newcommand{\id}{\mathrm{id}}\)
\( \newcommand{\Span}{\mathrm{span}}\)
\( \newcommand{\kernel}{\mathrm{null}\,}\)
\( \newcommand{\range}{\mathrm{range}\,}\)
\( \newcommand{\RealPart}{\mathrm{Re}}\)
\( \newcommand{\ImaginaryPart}{\mathrm{Im}}\)
\( \newcommand{\Argument}{\mathrm{Arg}}\)
\( \newcommand{\norm}[1]{\| #1 \|}\)
\( \newcommand{\inner}[2]{\langle #1, #2 \rangle}\)
\( \newcommand{\Span}{\mathrm{span}}\) \( \newcommand{\AA}{\unicode[.8,0]{x212B}}\)
\( \newcommand{\vectorA}[1]{\vec{#1}} % arrow\)
\( \newcommand{\vectorAt}[1]{\vec{\text{#1}}} % arrow\)
\( \newcommand{\vectorB}[1]{\overset { \scriptstyle \rightharpoonup} {\mathbf{#1}} } \)
\( \newcommand{\vectorC}[1]{\textbf{#1}} \)
\( \newcommand{\vectorD}[1]{\overrightarrow{#1}} \)
\( \newcommand{\vectorDt}[1]{\overrightarrow{\text{#1}}} \)
\( \newcommand{\vectE}[1]{\overset{-\!-\!\rightharpoonup}{\vphantom{a}\smash{\mathbf {#1}}}} \)
\( \newcommand{\vecs}[1]{\overset { \scriptstyle \rightharpoonup} {\mathbf{#1}} } \)
\(\newcommand{\longvect}{\overrightarrow}\)
\( \newcommand{\vecd}[1]{\overset{-\!-\!\rightharpoonup}{\vphantom{a}\smash {#1}}} \)
\(\newcommand{\avec}{\mathbf a}\) \(\newcommand{\bvec}{\mathbf b}\) \(\newcommand{\cvec}{\mathbf c}\) \(\newcommand{\dvec}{\mathbf d}\) \(\newcommand{\dtil}{\widetilde{\mathbf d}}\) \(\newcommand{\evec}{\mathbf e}\) \(\newcommand{\fvec}{\mathbf f}\) \(\newcommand{\nvec}{\mathbf n}\) \(\newcommand{\pvec}{\mathbf p}\) \(\newcommand{\qvec}{\mathbf q}\) \(\newcommand{\svec}{\mathbf s}\) \(\newcommand{\tvec}{\mathbf t}\) \(\newcommand{\uvec}{\mathbf u}\) \(\newcommand{\vvec}{\mathbf v}\) \(\newcommand{\wvec}{\mathbf w}\) \(\newcommand{\xvec}{\mathbf x}\) \(\newcommand{\yvec}{\mathbf y}\) \(\newcommand{\zvec}{\mathbf z}\) \(\newcommand{\rvec}{\mathbf r}\) \(\newcommand{\mvec}{\mathbf m}\) \(\newcommand{\zerovec}{\mathbf 0}\) \(\newcommand{\onevec}{\mathbf 1}\) \(\newcommand{\real}{\mathbb R}\) \(\newcommand{\twovec}[2]{\left[\begin{array}{r}#1 \\ #2 \end{array}\right]}\) \(\newcommand{\ctwovec}[2]{\left[\begin{array}{c}#1 \\ #2 \end{array}\right]}\) \(\newcommand{\threevec}[3]{\left[\begin{array}{r}#1 \\ #2 \\ #3 \end{array}\right]}\) \(\newcommand{\cthreevec}[3]{\left[\begin{array}{c}#1 \\ #2 \\ #3 \end{array}\right]}\) \(\newcommand{\fourvec}[4]{\left[\begin{array}{r}#1 \\ #2 \\ #3 \\ #4 \end{array}\right]}\) \(\newcommand{\cfourvec}[4]{\left[\begin{array}{c}#1 \\ #2 \\ #3 \\ #4 \end{array}\right]}\) \(\newcommand{\fivevec}[5]{\left[\begin{array}{r}#1 \\ #2 \\ #3 \\ #4 \\ #5 \\ \end{array}\right]}\) \(\newcommand{\cfivevec}[5]{\left[\begin{array}{c}#1 \\ #2 \\ #3 \\ #4 \\ #5 \\ \end{array}\right]}\) \(\newcommand{\mattwo}[4]{\left[\begin{array}{rr}#1 \amp #2 \\ #3 \amp #4 \\ \end{array}\right]}\) \(\newcommand{\laspan}[1]{\text{Span}\{#1\}}\) \(\newcommand{\bcal}{\cal B}\) \(\newcommand{\ccal}{\cal C}\) \(\newcommand{\scal}{\cal S}\) \(\newcommand{\wcal}{\cal W}\) \(\newcommand{\ecal}{\cal E}\) \(\newcommand{\coords}[2]{\left\{#1\right\}_{#2}}\) \(\newcommand{\gray}[1]{\color{gray}{#1}}\) \(\newcommand{\lgray}[1]{\color{lightgray}{#1}}\) \(\newcommand{\rank}{\operatorname{rank}}\) \(\newcommand{\row}{\text{Row}}\) \(\newcommand{\col}{\text{Col}}\) \(\renewcommand{\row}{\text{Row}}\) \(\newcommand{\nul}{\text{Nul}}\) \(\newcommand{\var}{\text{Var}}\) \(\newcommand{\corr}{\text{corr}}\) \(\newcommand{\len}[1]{\left|#1\right|}\) \(\newcommand{\bbar}{\overline{\bvec}}\) \(\newcommand{\bhat}{\widehat{\bvec}}\) \(\newcommand{\bperp}{\bvec^\perp}\) \(\newcommand{\xhat}{\widehat{\xvec}}\) \(\newcommand{\vhat}{\widehat{\vvec}}\) \(\newcommand{\uhat}{\widehat{\uvec}}\) \(\newcommand{\what}{\widehat{\wvec}}\) \(\newcommand{\Sighat}{\widehat{\Sigma}}\) \(\newcommand{\lt}{<}\) \(\newcommand{\gt}{>}\) \(\newcommand{\amp}{&}\) \(\definecolor{fillinmathshade}{gray}{0.9}\)Fluorescence, a type of luminescence, occurs in gas, liquid or solid chemical systems. Fluorescence is brought about by absorption of photons in the singlet ground state promoted to a singlet excited state. The spin of the electron is still paired with the ground state electron, unlike phosphorescence. As the excited molecule returns to ground state, it involves the emission of a photon of lower energy, which corresponds to a longer wavelength, than the absorbed photon.
Introduction
The energy loss is due to vibrational relaxation while in the excited state. Fluorescent bands center at wavelengths longer than the resonance line. This shift toward longer wavelengths is called a Stokes shift. Excited states are short-lived with a lifetime at about 10-8 seconds. Molecular structure and chemical environment affect whether or not a substance luminesces. When luminescence does occur, molecular structure and chemical environment determine the intensity of emission. Generally molecules that fluoresce are conjugated systems. Fluorescence occurs when an atom or molecules relaxes through vibrational relaxation to its ground state after being electrically excited. The specific frequencies of excitation and emission are dependent on the molecule or atom.
\[ S_0 + h\nu_{ex} = S_1 \]
where
- \(h\nu\) is a photon energy with
- \(h\) is Planck's constant and
- \(\nu\) is the frequency of light,
- \(S_0\) is the ground state of the fluorophore and
- \(S_1\) is its first electronically excited state.
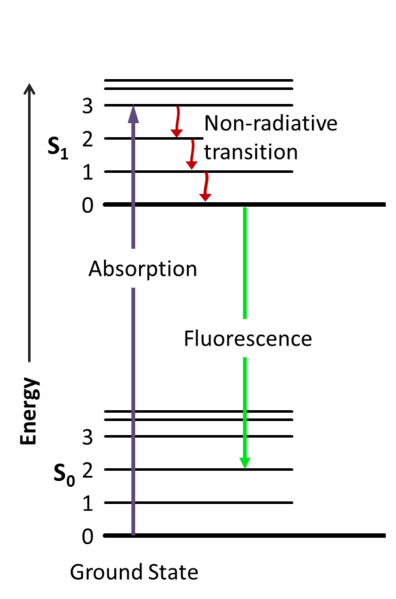
Figure 1 is a Jablonski energy diagram representing fluorescence. The purple arrow represents the absorption of light. The green arrow represents vibrational relaxation from singlet excited state, S2 to S1. This process is a non-radiative relaxation in which the excitation energy is dispersed as vibrations or heat to the solvent, and no photon is emitted. The yellow arrow represents fluorescence to the singlet ground state, So.
The fluorescence quantum yield ((\Phi\)) gives the efficiency of the fluorescence process. It is the ratio of photons emitted to photons absorbed.
\[ \Phi = \dfrac{\text{ # emitted photons }}{\text{ # absorbed photons }} \label{Eq0} \]
If every photon absorbed results in a photon emitted. The maximum fluorescence quantum yield is 1.0, and compounds with quantum yields of 0.10 are still considered fluorescent. Another way to define the fluorescence quantum yield is by the excited state decay rates:
\[ \Phi = \dfrac{k_f}{\sum_i k_i} \label{Eq1}\]
where \(k_f\) is the rate of spontaneous emission of radiation and the denominator is the sum of all rates of excited state decay for each deactivation process (ie phosphorescence, intersystem crossing, internal conversion…). The fluorescence lifetime is the average time the molecule remains in its excited state before emitting a photon. Fluorescence typically follows first-order kinetics:
\[ [S_1] = [S_1]_o e^{- t/\tau} \label{Eq2}\]
where
- \([S_1]\) is the concentration of excited state molecules at time \(t\),
- \([S_1]_0\) is the initial concentration and \(\tau\) is the decay rate.
Various radiative and non-radiative processes can de-populate the excited state so the total decay rate is the sum over all rates:
\[ \tau_{tot}= \tau_{rad} + \tau_{nrad} \label{Eq3}\]
where \( \tau_{tot} \) is the total decay rate, \( \tau_{rad} \) the radiative decay rate and \(\tau_{nrad} \) the non-radiative decay rate. If the rate of spontaneous emission or any of the other rates are fast, the lifetime is short. The average lifetime of fluorescent compounds that emit photons with energies from the UV to near infrared are within the range of 0.5 to 20 nanoseconds.
The fluorescence intensity, \(I_F\) is proportional to the amount of light absorbed and the fluorescence quantum yield, \(\Phi\)
\[I_f=kI_o \phi [1-(10^{-εbc})] \label{Eq4}\]
where
- \(k\) is a proportionality constant attributed to the instrument
- \(I_o\( is the incident light intensity
- \(\epsilon\) is the molar absorptivity,
- \(b\) is the path length, and
- \(c\) is the concentration of the substrate.
If dilute solutions are used so that less than 2% of the excitation energy is absorbed, then an approximation can be made so that
\[10^{x} \approx 1+x + ...\]
so Equation \(\ref{Eq4}\) can be simplified to
\[I_f=kI_o\Phi [εbc] \label{Eq4a}\]
This relationship shows that fluorescence intensity is proportional to concentration.
Fluorescence rarely results from absorption of UV-radiation of wavelengths shorter than 250 nm because this type of radiation is sufficiently energetic to cause deactivation of the excited state by predissociation or dissociation. Most organic molecules have at least some bonds that can be ruptured by energies of this strength. Consequently, fluorescence due to \(\\sigma^* \rightarrow \sigma\) transitions is rarely observed. Instead such emission is confined to the less energetic \(\pi^* \rightarrow \pi\) and \(\pi^* \rightarrow n\) processes. Fluorescence commonly occurs from a transition from the lowest vibrational level of the first excited electronic state to the one of the vibrational levels of the electronic ground state. Quantum yield (\(\Phi\)) is greater for \(\pi^* \rightarrow \pi\) transition because these excited states show short average lifetimes (larger \(k_f\)) and because deactivation processes that compete with fluorescence is not as likely to happen. Molar absorptivity of π → π* transitions is 100-1000 fold greater. The average lifetime is 10-7 to 10-9 seconds for ?, ?* states and 10-5 to 10-7 seconds for n, π* states.
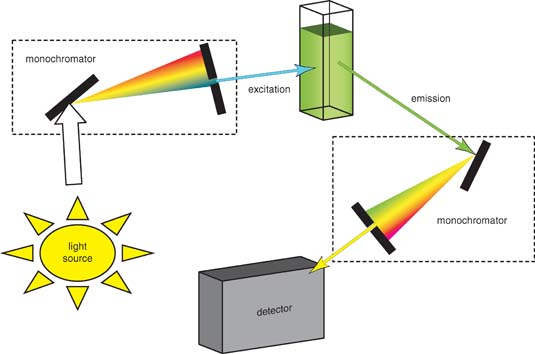
Figure 2 is a schematic of a typical filter fluorometer that uses a source beam for fluorescence excitation and a pair of photomultiplier tubes as transducers. The source beam is split near the source into a reference beam and a sample beam. The reference beam is attenuated by the aperture disk so that its intensity is roughly the same as the fluorescence intensity. Both beams pass through the primary filter, with the reference beam being reflected to the reference photomultiplier tube. The sample beam is focused on the sample by a pair of lenses and causes fluorescence emission. The emitted radiation passes through a second filter and then is focused on the sample photomultiplier tube. The electrical outputs from the two transducers are then processed by an analog to digital converter to compute the ratio of the sample to reference intensities, which can then be used for qualitative and quantitative analysis. To obtain an emission spectrum, the excitation monochromator is fixed and the emission monochromator varies. To obtain an excitation spectrum, the excitation monochromator varies while the emission monochromator is fixed.
Fluorescence spectroscopy can be used to measure the concentration of a compound because the fluorescence intensity is linearly proportional to the concentration of the fluorescent molecule. Fluorescent molecules can also be used as tags. For example, fluorescence in situ hybridization (FISH) is a method of determining what genes are present in an organism's genome. Single stranded DNA encoding a gene of interest is covalently bonded to a fluorescent molecule and washed over the organism's chromosome, binding to its complementary sequence. The presence and placement of the gene in the organism then fluoresces when shined with ultraviolet light. Green fluorescence protein (GFP) is used in molecular biology to monitor the activity of proteins. The gene encoding GFP can be inserted next to a gene encoding a protein that will be studied. When the genes are expressed, the protein will be attached to GFP and can be identified in the cell by its fluorescence.