
2.1.3: Rate vs. Concentration Proportionalities
- Page ID
- 9614

\( \newcommand{\vecs}[1]{\overset { \scriptstyle \rightharpoonup} {\mathbf{#1}} } \)
\( \newcommand{\vecd}[1]{\overset{-\!-\!\rightharpoonup}{\vphantom{a}\smash {#1}}} \)
\( \newcommand{\id}{\mathrm{id}}\) \( \newcommand{\Span}{\mathrm{span}}\)
( \newcommand{\kernel}{\mathrm{null}\,}\) \( \newcommand{\range}{\mathrm{range}\,}\)
\( \newcommand{\RealPart}{\mathrm{Re}}\) \( \newcommand{\ImaginaryPart}{\mathrm{Im}}\)
\( \newcommand{\Argument}{\mathrm{Arg}}\) \( \newcommand{\norm}[1]{\| #1 \|}\)
\( \newcommand{\inner}[2]{\langle #1, #2 \rangle}\)
\( \newcommand{\Span}{\mathrm{span}}\)
\( \newcommand{\id}{\mathrm{id}}\)
\( \newcommand{\Span}{\mathrm{span}}\)
\( \newcommand{\kernel}{\mathrm{null}\,}\)
\( \newcommand{\range}{\mathrm{range}\,}\)
\( \newcommand{\RealPart}{\mathrm{Re}}\)
\( \newcommand{\ImaginaryPart}{\mathrm{Im}}\)
\( \newcommand{\Argument}{\mathrm{Arg}}\)
\( \newcommand{\norm}[1]{\| #1 \|}\)
\( \newcommand{\inner}[2]{\langle #1, #2 \rangle}\)
\( \newcommand{\Span}{\mathrm{span}}\) \( \newcommand{\AA}{\unicode[.8,0]{x212B}}\)
\( \newcommand{\vectorA}[1]{\vec{#1}} % arrow\)
\( \newcommand{\vectorAt}[1]{\vec{\text{#1}}} % arrow\)
\( \newcommand{\vectorB}[1]{\overset { \scriptstyle \rightharpoonup} {\mathbf{#1}} } \)
\( \newcommand{\vectorC}[1]{\textbf{#1}} \)
\( \newcommand{\vectorD}[1]{\overrightarrow{#1}} \)
\( \newcommand{\vectorDt}[1]{\overrightarrow{\text{#1}}} \)
\( \newcommand{\vectE}[1]{\overset{-\!-\!\rightharpoonup}{\vphantom{a}\smash{\mathbf {#1}}}} \)
\( \newcommand{\vecs}[1]{\overset { \scriptstyle \rightharpoonup} {\mathbf{#1}} } \)
\( \newcommand{\vecd}[1]{\overset{-\!-\!\rightharpoonup}{\vphantom{a}\smash {#1}}} \)
\(\newcommand{\avec}{\mathbf a}\) \(\newcommand{\bvec}{\mathbf b}\) \(\newcommand{\cvec}{\mathbf c}\) \(\newcommand{\dvec}{\mathbf d}\) \(\newcommand{\dtil}{\widetilde{\mathbf d}}\) \(\newcommand{\evec}{\mathbf e}\) \(\newcommand{\fvec}{\mathbf f}\) \(\newcommand{\nvec}{\mathbf n}\) \(\newcommand{\pvec}{\mathbf p}\) \(\newcommand{\qvec}{\mathbf q}\) \(\newcommand{\svec}{\mathbf s}\) \(\newcommand{\tvec}{\mathbf t}\) \(\newcommand{\uvec}{\mathbf u}\) \(\newcommand{\vvec}{\mathbf v}\) \(\newcommand{\wvec}{\mathbf w}\) \(\newcommand{\xvec}{\mathbf x}\) \(\newcommand{\yvec}{\mathbf y}\) \(\newcommand{\zvec}{\mathbf z}\) \(\newcommand{\rvec}{\mathbf r}\) \(\newcommand{\mvec}{\mathbf m}\) \(\newcommand{\zerovec}{\mathbf 0}\) \(\newcommand{\onevec}{\mathbf 1}\) \(\newcommand{\real}{\mathbb R}\) \(\newcommand{\twovec}[2]{\left[\begin{array}{r}#1 \\ #2 \end{array}\right]}\) \(\newcommand{\ctwovec}[2]{\left[\begin{array}{c}#1 \\ #2 \end{array}\right]}\) \(\newcommand{\threevec}[3]{\left[\begin{array}{r}#1 \\ #2 \\ #3 \end{array}\right]}\) \(\newcommand{\cthreevec}[3]{\left[\begin{array}{c}#1 \\ #2 \\ #3 \end{array}\right]}\) \(\newcommand{\fourvec}[4]{\left[\begin{array}{r}#1 \\ #2 \\ #3 \\ #4 \end{array}\right]}\) \(\newcommand{\cfourvec}[4]{\left[\begin{array}{c}#1 \\ #2 \\ #3 \\ #4 \end{array}\right]}\) \(\newcommand{\fivevec}[5]{\left[\begin{array}{r}#1 \\ #2 \\ #3 \\ #4 \\ #5 \\ \end{array}\right]}\) \(\newcommand{\cfivevec}[5]{\left[\begin{array}{c}#1 \\ #2 \\ #3 \\ #4 \\ #5 \\ \end{array}\right]}\) \(\newcommand{\mattwo}[4]{\left[\begin{array}{rr}#1 \amp #2 \\ #3 \amp #4 \\ \end{array}\right]}\) \(\newcommand{\laspan}[1]{\text{Span}\{#1\}}\) \(\newcommand{\bcal}{\cal B}\) \(\newcommand{\ccal}{\cal C}\) \(\newcommand{\scal}{\cal S}\) \(\newcommand{\wcal}{\cal W}\) \(\newcommand{\ecal}{\cal E}\) \(\newcommand{\coords}[2]{\left\{#1\right\}_{#2}}\) \(\newcommand{\gray}[1]{\color{gray}{#1}}\) \(\newcommand{\lgray}[1]{\color{lightgray}{#1}}\) \(\newcommand{\rank}{\operatorname{rank}}\) \(\newcommand{\row}{\text{Row}}\) \(\newcommand{\col}{\text{Col}}\) \(\renewcommand{\row}{\text{Row}}\) \(\newcommand{\nul}{\text{Nul}}\) \(\newcommand{\var}{\text{Var}}\) \(\newcommand{\corr}{\text{corr}}\) \(\newcommand{\len}[1]{\left|#1\right|}\) \(\newcommand{\bbar}{\overline{\bvec}}\) \(\newcommand{\bhat}{\widehat{\bvec}}\) \(\newcommand{\bperp}{\bvec^\perp}\) \(\newcommand{\xhat}{\widehat{\xvec}}\) \(\newcommand{\vhat}{\widehat{\vvec}}\) \(\newcommand{\uhat}{\widehat{\uvec}}\) \(\newcommand{\what}{\widehat{\wvec}}\) \(\newcommand{\Sighat}{\widehat{\Sigma}}\) \(\newcommand{\lt}{<}\) \(\newcommand{\gt}{>}\) \(\newcommand{\amp}{&}\) \(\definecolor{fillinmathshade}{gray}{0.9}\)To determine the value of the exponent in a rate equation term, we need to see how the rate varies with the concentration of the substance. For a single-reactant decomposition reaction of the form
A → products
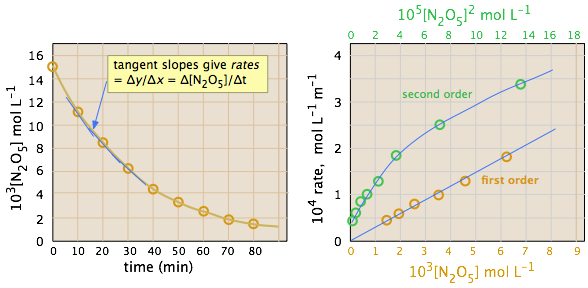
in which the rate is –d[A]/dt, we simply plot [A] as function of time, draw tangents at various intervals, and see how the slopes of these tangents (the instantaneous rates) depend on [A].
- If doubling the concentration of A doubles the rate, then the reaction is first-order in A.
- If doubling the concentration results in a four-fold rate increase, the reaction is second-order in A.
Use the tabulated experimental data to determine the order of the reaction
\[2 N_2O_5 \rightarrow 4 NO_2 + O_2 \nonumber \]
| Time (min) | p(N2O5) | [N2O5] mol L-1 |
Rate ( mol L-1 min-1) |
|---|---|---|---|
| 0 | 301.6 | 0.0152 | |
| 10 | 224.8 | 0.0113 | 3.4 × 10⁻⁴ |
| 20 | 166.7 | 0.0084 | 2.5 |
| 30 | 123.2 | 0.0062 | 1.8 |
| 40 | 92.2 | 0.0046 | 1.3 |
| 69.1 | 69.1 | 0.0035 | 1.0 |
Solution
The ideal gas law can be used to convert the partial pressures of \(N_2O_5\) to molar concentrations. These are then plotted (left) to follow their decrease with time. The rates are computed from the slopes of the tangents (blue lines) and their values plotted as a function of \([N_2O_5]\) and \([N_2O_5]^2\). It is apparent that the rates are directly proportional to \([N_2O_5]^1\), indicating that this is a first-order reaction.
Initial Rate Method
When there is more than one reactant, the method described above is rarely practical, since the concentrations of the different reactants will generally fall at different rates, depending on the stoichiometry. Instead, we measure only the rate near the beginning of the reaction, before the concentrations have had time to change significantly. The experiment is then repeated with a different starting concentration of the reactant in question, but keeping the concentrations of any others the same. After the order with respect to one component is found, another series of trials is conducted in which the order of another component is found.

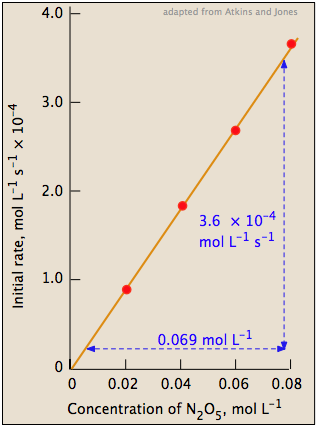
The slope of this plot gives the value of the rate constant (Figure 1; right).

rate = (5.2 × 10⁻³) [N2O5] mol L–1 s–1
A study of the gas-phase reduction of nitric oxide by hydrogen
\[2 NO + 2 H_2 \rightarrow N_2 + 2 H_2O \nonumber \]
yielded the following initial-rate data (all pressures in torr):
| experiment | P(NO) | P(H2) |
initial rate (torr s–1) |
|
|
359 | 300 | 1.50 |
|
|
300 | 300 | 1.03 |
|
|
152 | 300 | 0.25 |
|
|
300 | 289 | 1.00 |
|
|
300 | 205 | 0.71 |
|
|
200 | 147 | 0.51 |
Find the order of the reaction with respect to each component.
Solution
In looking over this data, take note of the following:
- The six runs recorded here fall into two groups, in which the initial pressures of H2 and of NO, respectively, are held constant.
- All the data are expressed in pressures, rather than in concentrations. We can do this because the reactants are gases, whose concentrations are directly proportional to their partial pressures when T and V are held constant. And since we are only interested in comparing the ratios of pressures and rates, the units cancel out and don't matter. It is far easier experimentally to adjust and measure pressures than concentrations.
Experiments 2 and 3: Reduction of the initial partial pressure of NO by a factor of about 2 (300/152) results in a reduction of the initial rate by a factor of about 4, so the reaction is second-order in nitric oxide.
Experiments 4 and 6: Reducing the initial partial pressure of hydrogen by a factor of approximately 2 (289/147) causes a similar reduction in the initial rate, so the reaction is first-order in hydrogen.
The rate law is thus
\[ \text{rate} = k[NO]^2[H_2]. \nonumber \]
Dealing with multiple reactants: the isolation method
It is not always practical to determine orders of two or more reactants by the method illustrated in the preceding example. Fortunately, there is another way to accomplish the same task: we can use excess concentrations of all the reactants except the one we wish to investigate. For example, suppose the reaction is
\[\ce{A + B + C → products} \nonumber \]
and we need to find the order with respect to [B] in the rate law. If we set [B]o to 0.020 M and let [A]o = [C]o = 2.00M, then if the reaction goes to completion, the change in [A] and [C] will also be 0.020 M which is only 1 percent of their original values. This will often be smaller than the experimental error in determining the rates, so it can be neglected. By "flooding" the reaction mixture with one or more reactants, we are effectively isolating the one in which we are interested.
Contributors and Attributions
Stephen Lower, Professor Emeritus (Simon Fraser U.) Chem1 Virtual Textbook