
13.3: Unequal Spacings in Vibration-Rotation Spectra
- Page ID
- 2416
\( \newcommand{\vecs}[1]{\overset { \scriptstyle \rightharpoonup} {\mathbf{#1}} } \)
\( \newcommand{\vecd}[1]{\overset{-\!-\!\rightharpoonup}{\vphantom{a}\smash {#1}}} \)
\( \newcommand{\id}{\mathrm{id}}\) \( \newcommand{\Span}{\mathrm{span}}\)
( \newcommand{\kernel}{\mathrm{null}\,}\) \( \newcommand{\range}{\mathrm{range}\,}\)
\( \newcommand{\RealPart}{\mathrm{Re}}\) \( \newcommand{\ImaginaryPart}{\mathrm{Im}}\)
\( \newcommand{\Argument}{\mathrm{Arg}}\) \( \newcommand{\norm}[1]{\| #1 \|}\)
\( \newcommand{\inner}[2]{\langle #1, #2 \rangle}\)
\( \newcommand{\Span}{\mathrm{span}}\)
\( \newcommand{\id}{\mathrm{id}}\)
\( \newcommand{\Span}{\mathrm{span}}\)
\( \newcommand{\kernel}{\mathrm{null}\,}\)
\( \newcommand{\range}{\mathrm{range}\,}\)
\( \newcommand{\RealPart}{\mathrm{Re}}\)
\( \newcommand{\ImaginaryPart}{\mathrm{Im}}\)
\( \newcommand{\Argument}{\mathrm{Arg}}\)
\( \newcommand{\norm}[1]{\| #1 \|}\)
\( \newcommand{\inner}[2]{\langle #1, #2 \rangle}\)
\( \newcommand{\Span}{\mathrm{span}}\) \( \newcommand{\AA}{\unicode[.8,0]{x212B}}\)
\( \newcommand{\vectorA}[1]{\vec{#1}} % arrow\)
\( \newcommand{\vectorAt}[1]{\vec{\text{#1}}} % arrow\)
\( \newcommand{\vectorB}[1]{\overset { \scriptstyle \rightharpoonup} {\mathbf{#1}} } \)
\( \newcommand{\vectorC}[1]{\textbf{#1}} \)
\( \newcommand{\vectorD}[1]{\overrightarrow{#1}} \)
\( \newcommand{\vectorDt}[1]{\overrightarrow{\text{#1}}} \)
\( \newcommand{\vectE}[1]{\overset{-\!-\!\rightharpoonup}{\vphantom{a}\smash{\mathbf {#1}}}} \)
\( \newcommand{\vecs}[1]{\overset { \scriptstyle \rightharpoonup} {\mathbf{#1}} } \)
\( \newcommand{\vecd}[1]{\overset{-\!-\!\rightharpoonup}{\vphantom{a}\smash {#1}}} \)
\(\newcommand{\avec}{\mathbf a}\) \(\newcommand{\bvec}{\mathbf b}\) \(\newcommand{\cvec}{\mathbf c}\) \(\newcommand{\dvec}{\mathbf d}\) \(\newcommand{\dtil}{\widetilde{\mathbf d}}\) \(\newcommand{\evec}{\mathbf e}\) \(\newcommand{\fvec}{\mathbf f}\) \(\newcommand{\nvec}{\mathbf n}\) \(\newcommand{\pvec}{\mathbf p}\) \(\newcommand{\qvec}{\mathbf q}\) \(\newcommand{\svec}{\mathbf s}\) \(\newcommand{\tvec}{\mathbf t}\) \(\newcommand{\uvec}{\mathbf u}\) \(\newcommand{\vvec}{\mathbf v}\) \(\newcommand{\wvec}{\mathbf w}\) \(\newcommand{\xvec}{\mathbf x}\) \(\newcommand{\yvec}{\mathbf y}\) \(\newcommand{\zvec}{\mathbf z}\) \(\newcommand{\rvec}{\mathbf r}\) \(\newcommand{\mvec}{\mathbf m}\) \(\newcommand{\zerovec}{\mathbf 0}\) \(\newcommand{\onevec}{\mathbf 1}\) \(\newcommand{\real}{\mathbb R}\) \(\newcommand{\twovec}[2]{\left[\begin{array}{r}#1 \\ #2 \end{array}\right]}\) \(\newcommand{\ctwovec}[2]{\left[\begin{array}{c}#1 \\ #2 \end{array}\right]}\) \(\newcommand{\threevec}[3]{\left[\begin{array}{r}#1 \\ #2 \\ #3 \end{array}\right]}\) \(\newcommand{\cthreevec}[3]{\left[\begin{array}{c}#1 \\ #2 \\ #3 \end{array}\right]}\) \(\newcommand{\fourvec}[4]{\left[\begin{array}{r}#1 \\ #2 \\ #3 \\ #4 \end{array}\right]}\) \(\newcommand{\cfourvec}[4]{\left[\begin{array}{c}#1 \\ #2 \\ #3 \\ #4 \end{array}\right]}\) \(\newcommand{\fivevec}[5]{\left[\begin{array}{r}#1 \\ #2 \\ #3 \\ #4 \\ #5 \\ \end{array}\right]}\) \(\newcommand{\cfivevec}[5]{\left[\begin{array}{c}#1 \\ #2 \\ #3 \\ #4 \\ #5 \\ \end{array}\right]}\) \(\newcommand{\mattwo}[4]{\left[\begin{array}{rr}#1 \amp #2 \\ #3 \amp #4 \\ \end{array}\right]}\) \(\newcommand{\laspan}[1]{\text{Span}\{#1\}}\) \(\newcommand{\bcal}{\cal B}\) \(\newcommand{\ccal}{\cal C}\) \(\newcommand{\scal}{\cal S}\) \(\newcommand{\wcal}{\cal W}\) \(\newcommand{\ecal}{\cal E}\) \(\newcommand{\coords}[2]{\left\{#1\right\}_{#2}}\) \(\newcommand{\gray}[1]{\color{gray}{#1}}\) \(\newcommand{\lgray}[1]{\color{lightgray}{#1}}\) \(\newcommand{\rank}{\operatorname{rank}}\) \(\newcommand{\row}{\text{Row}}\) \(\newcommand{\col}{\text{Col}}\) \(\renewcommand{\row}{\text{Row}}\) \(\newcommand{\nul}{\text{Nul}}\) \(\newcommand{\var}{\text{Var}}\) \(\newcommand{\corr}{\text{corr}}\) \(\newcommand{\len}[1]{\left|#1\right|}\) \(\newcommand{\bbar}{\overline{\bvec}}\) \(\newcommand{\bhat}{\widehat{\bvec}}\) \(\newcommand{\bperp}{\bvec^\perp}\) \(\newcommand{\xhat}{\widehat{\xvec}}\) \(\newcommand{\vhat}{\widehat{\vvec}}\) \(\newcommand{\uhat}{\widehat{\uvec}}\) \(\newcommand{\what}{\widehat{\wvec}}\) \(\newcommand{\Sighat}{\widehat{\Sigma}}\) \(\newcommand{\lt}{<}\) \(\newcommand{\gt}{>}\) \(\newcommand{\amp}{&}\) \(\definecolor{fillinmathshade}{gray}{0.9}\)We find that real rovibrational spectra do not exhibit the equal spacing expectations from the treatment in the previous section and look more like the idealized spectrum in Figure 13.3.1 . As energy increases, the R-branch lines become increasingly similar in energy (i.e., the lines move closer together) and as energy decreases, the P-branch lines become increasingly dissimilar in energy (i.e. the lines move farther apart). This is attributable to two phenomena: rotational-vibrational coupling and centrifugal distortion.
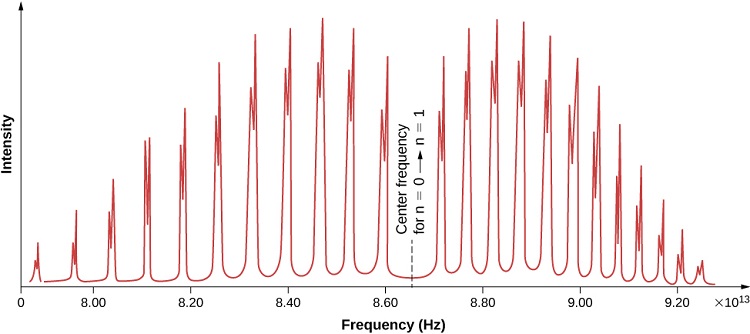
Experimental data shows that the P branch has closer spaces between the lines as the frequencies decrease while R branch has further spaces between the lines as the frequencies increase. On the spectrum, R region is on the left and P region is on the right separated by a large gap in between. There are other graphs show differently, but the regions can be labeled using their spacing characteristic discussed below.
Vibration-Rotation Interaction
Consider the rotational constant for a rigid rotator \(\tilde{B}=h/8\pi^2c\mu R_e^2\) where \(\tilde{B}\) is the rotational constant, and \(R_e^2\) is the bond length. It is clear from the equation that \(\tilde{B}\) depends on \(R_e^2\) in a inverse manner, so \(\tilde{B}\) will decrease as \(R_e^2\) increase, and vice versa.
Vibrational state and the bond length also possess a relationship, and that is bond length, \(R_e^2\), will increase as the vibrational state, \(v\) increases. High vibrational states have large vibrational amplitudes (the amplitude can be visualized as the distance from one side to the other on the harmonic-oscillator parabola, and higher states has greater distance). On a potential graph, imagine a diatomic molecule with one of the atom fixed at the origin, the bond is along the x-axis, and the molecule vibrate toward and away from the origin along x-axis. The range at how much the bond can stretch or squeeze depend on the vibrational amplitude. So, at high vibrational state (thus high amplitude), the bond can squeeze in and stretch out more (just a little more) on the regular harmonic-oscillator potential, but it can stretch out greatly on an anharmonic oscillator. That's why bond length increase with vibrational state.
The two relationship established above
- \(\tilde{B} \propto R_e^2\) (inversely proportional)
and
- \(R_e^2 \propto v\) (directly proportional)
Therefore,
- \(\tilde{B} \propto v\) (inversely proportional)
The rotational constant dependent on the vibrational state is denoted as \(\tilde{B}_v\), and the dependence of \(\tilde{B}\) on \(v\) is the vibrational-rotational interaction.
Let's calculate the frequencies of R and P Branches with vibrational dependent rotational constants. The energies of the rigid rotator-harmonic oscillator is
\[\tilde{E}_{v, J} = G(v) + F(J) = \tilde{\nu} (v+\dfrac{1}{2}) + \tilde{B} J (J+1) \nonumber \]
or in term of \(\tilde{B}_v\)
\[\tilde{E}_{v, J} = \tilde{\nu} \left(v+\dfrac{1}{2} \right) + \tilde{B}_v J (J+1) \nonumber \]
According to the vibration-rotation interaction, \(\tilde{B}_1 < \tilde{B}_0\) because \(R_e^2 (v=1) > R_e^2 (v=0)\). Hence, the frequencies of rovibrational transitions from \(v = 0 \rightarrow 1\) can be calculated as the following:
For R branch, allowed \(J = 0, 1, 2, ...\)
\[\tilde{\nu}_R(\Delta J = +1) = \tilde{E}_{1, J+1} - \tilde{E}_{0, J} \nonumber \]
\[= \dfrac{3}{2} \tilde{\nu} + \tilde{B}_1 (J+1)(J+2) - \dfrac{1}{2} \tilde{\nu} - \tilde{B}_0 J(J+1) \nonumber \]
\[= \tilde{\nu}+2\tilde{B}_1+(3\tilde{B}_1-\tilde{B}_0)J+(\tilde{B}_1-\tilde{B}_0)J^2 \nonumber \]
For P branch, allowed \(J = 1, 2, 3, ...\)
\[\tilde{\nu}_P(\Delta J = -1) = \tilde{E}_{1, J-1} - \tilde{E}_{0, J} \nonumber \]
\[= \tilde{\nu}-(\tilde{B}_1+\tilde{B}_0)J+(\tilde{B}_1-\tilde{B}_0)J^2 \nonumber \]
Decrease in Spacing of Lines in the R Branch with Increasing J
A closer look at
\[\tilde{\nu}_R = \tilde{\nu}+2\tilde{B}_1+(3\tilde{B}_1-\tilde{B}_0)J+(\tilde{B}_1-\tilde{B}_0)J^2 \nonumber \]
shows that the last term in the parentheses \((\tilde{B}_1-\tilde{B}_0)\) will be always negative because \(\tilde{B}_1 < \tilde{B}_0\), and it also multiplies with \(J^2\), so the square term \((\tilde{B}_1-\tilde{B}_0)J^2\) will give a larger negative value for increasing \(J\). As a result, \(\tilde{\nu}_R=\tilde{\nu} + \)(smaller and smaller value) as J increase. Because the rotational frequencies keep getting smaller, the spacing between lines in R branch decreases as J increases.
Increasing in Spacing of Lines in the P Branch with Decreasing J
Using the same analysis as above,
\[\tilde{\nu}_P = \tilde{\nu}-(\tilde{B}_1+\tilde{B}_0)J+(\tilde{B}_1-\tilde{B}_0)J^2 \nonumber \]
shows that the last term in the parentheses \((\tilde{B}_1-\tilde{B}_0)\) will be always negative because \(\tilde{B}_1 < \tilde{B}_0\), and it also multiplies with \(J^2\), so the square term \((\tilde{B}_1-\tilde{B}_0)J^2\) will give a larger negative value even for decreasing \(J\). As a result, \(\tilde{\nu}_R=\tilde{\nu} - \)(smaller and smaller value) as J decreases. Because the rotational frequencies keep getting larger, the spacing between lines in P branch increase as J decreases.
References
- McQuarrie, Donald A. Quantum Chemistry. New York: University Science Books, 2007.
- Hollas, M. J. Modern spectroscopy. (3rd ed.). Chichester: John Wiley & Sons, 1996.
- Hollas, M. J. Basic atomic and molecular spectroscopy. Cambridge: The Royal Society of Chemistry, 2002.
- Herzberg, G. Molecular spectra and molecular structure. (2nd ed.). New York: Prentice-Hall, 1950.
- Fetterolf, Monty L. Enhanced Intensity Distribution Analysis of the Rotational–Vibrational Spectrum of HCl. J. Chem. Ed. 2007, 84, 1064. DOI: 10.1021/ed084p1062