14.1: Vocabulary
- Page ID
- 41394
\( \newcommand{\vecs}[1]{\overset { \scriptstyle \rightharpoonup} {\mathbf{#1}} } \)
\( \newcommand{\vecd}[1]{\overset{-\!-\!\rightharpoonup}{\vphantom{a}\smash {#1}}} \)
\( \newcommand{\id}{\mathrm{id}}\) \( \newcommand{\Span}{\mathrm{span}}\)
( \newcommand{\kernel}{\mathrm{null}\,}\) \( \newcommand{\range}{\mathrm{range}\,}\)
\( \newcommand{\RealPart}{\mathrm{Re}}\) \( \newcommand{\ImaginaryPart}{\mathrm{Im}}\)
\( \newcommand{\Argument}{\mathrm{Arg}}\) \( \newcommand{\norm}[1]{\| #1 \|}\)
\( \newcommand{\inner}[2]{\langle #1, #2 \rangle}\)
\( \newcommand{\Span}{\mathrm{span}}\)
\( \newcommand{\id}{\mathrm{id}}\)
\( \newcommand{\Span}{\mathrm{span}}\)
\( \newcommand{\kernel}{\mathrm{null}\,}\)
\( \newcommand{\range}{\mathrm{range}\,}\)
\( \newcommand{\RealPart}{\mathrm{Re}}\)
\( \newcommand{\ImaginaryPart}{\mathrm{Im}}\)
\( \newcommand{\Argument}{\mathrm{Arg}}\)
\( \newcommand{\norm}[1]{\| #1 \|}\)
\( \newcommand{\inner}[2]{\langle #1, #2 \rangle}\)
\( \newcommand{\Span}{\mathrm{span}}\) \( \newcommand{\AA}{\unicode[.8,0]{x212B}}\)
\( \newcommand{\vectorA}[1]{\vec{#1}} % arrow\)
\( \newcommand{\vectorAt}[1]{\vec{\text{#1}}} % arrow\)
\( \newcommand{\vectorB}[1]{\overset { \scriptstyle \rightharpoonup} {\mathbf{#1}} } \)
\( \newcommand{\vectorC}[1]{\textbf{#1}} \)
\( \newcommand{\vectorD}[1]{\overrightarrow{#1}} \)
\( \newcommand{\vectorDt}[1]{\overrightarrow{\text{#1}}} \)
\( \newcommand{\vectE}[1]{\overset{-\!-\!\rightharpoonup}{\vphantom{a}\smash{\mathbf {#1}}}} \)
\( \newcommand{\vecs}[1]{\overset { \scriptstyle \rightharpoonup} {\mathbf{#1}} } \)
\( \newcommand{\vecd}[1]{\overset{-\!-\!\rightharpoonup}{\vphantom{a}\smash {#1}}} \)
\(\newcommand{\avec}{\mathbf a}\) \(\newcommand{\bvec}{\mathbf b}\) \(\newcommand{\cvec}{\mathbf c}\) \(\newcommand{\dvec}{\mathbf d}\) \(\newcommand{\dtil}{\widetilde{\mathbf d}}\) \(\newcommand{\evec}{\mathbf e}\) \(\newcommand{\fvec}{\mathbf f}\) \(\newcommand{\nvec}{\mathbf n}\) \(\newcommand{\pvec}{\mathbf p}\) \(\newcommand{\qvec}{\mathbf q}\) \(\newcommand{\svec}{\mathbf s}\) \(\newcommand{\tvec}{\mathbf t}\) \(\newcommand{\uvec}{\mathbf u}\) \(\newcommand{\vvec}{\mathbf v}\) \(\newcommand{\wvec}{\mathbf w}\) \(\newcommand{\xvec}{\mathbf x}\) \(\newcommand{\yvec}{\mathbf y}\) \(\newcommand{\zvec}{\mathbf z}\) \(\newcommand{\rvec}{\mathbf r}\) \(\newcommand{\mvec}{\mathbf m}\) \(\newcommand{\zerovec}{\mathbf 0}\) \(\newcommand{\onevec}{\mathbf 1}\) \(\newcommand{\real}{\mathbb R}\) \(\newcommand{\twovec}[2]{\left[\begin{array}{r}#1 \\ #2 \end{array}\right]}\) \(\newcommand{\ctwovec}[2]{\left[\begin{array}{c}#1 \\ #2 \end{array}\right]}\) \(\newcommand{\threevec}[3]{\left[\begin{array}{r}#1 \\ #2 \\ #3 \end{array}\right]}\) \(\newcommand{\cthreevec}[3]{\left[\begin{array}{c}#1 \\ #2 \\ #3 \end{array}\right]}\) \(\newcommand{\fourvec}[4]{\left[\begin{array}{r}#1 \\ #2 \\ #3 \\ #4 \end{array}\right]}\) \(\newcommand{\cfourvec}[4]{\left[\begin{array}{c}#1 \\ #2 \\ #3 \\ #4 \end{array}\right]}\) \(\newcommand{\fivevec}[5]{\left[\begin{array}{r}#1 \\ #2 \\ #3 \\ #4 \\ #5 \\ \end{array}\right]}\) \(\newcommand{\cfivevec}[5]{\left[\begin{array}{c}#1 \\ #2 \\ #3 \\ #4 \\ #5 \\ \end{array}\right]}\) \(\newcommand{\mattwo}[4]{\left[\begin{array}{rr}#1 \amp #2 \\ #3 \amp #4 \\ \end{array}\right]}\) \(\newcommand{\laspan}[1]{\text{Span}\{#1\}}\) \(\newcommand{\bcal}{\cal B}\) \(\newcommand{\ccal}{\cal C}\) \(\newcommand{\scal}{\cal S}\) \(\newcommand{\wcal}{\cal W}\) \(\newcommand{\ecal}{\cal E}\) \(\newcommand{\coords}[2]{\left\{#1\right\}_{#2}}\) \(\newcommand{\gray}[1]{\color{gray}{#1}}\) \(\newcommand{\lgray}[1]{\color{lightgray}{#1}}\) \(\newcommand{\rank}{\operatorname{rank}}\) \(\newcommand{\row}{\text{Row}}\) \(\newcommand{\col}{\text{Col}}\) \(\renewcommand{\row}{\text{Row}}\) \(\newcommand{\nul}{\text{Nul}}\) \(\newcommand{\var}{\text{Var}}\) \(\newcommand{\corr}{\text{corr}}\) \(\newcommand{\len}[1]{\left|#1\right|}\) \(\newcommand{\bbar}{\overline{\bvec}}\) \(\newcommand{\bhat}{\widehat{\bvec}}\) \(\newcommand{\bperp}{\bvec^\perp}\) \(\newcommand{\xhat}{\widehat{\xvec}}\) \(\newcommand{\vhat}{\widehat{\vvec}}\) \(\newcommand{\uhat}{\widehat{\uvec}}\) \(\newcommand{\what}{\widehat{\wvec}}\) \(\newcommand{\Sighat}{\widehat{\Sigma}}\) \(\newcommand{\lt}{<}\) \(\newcommand{\gt}{>}\) \(\newcommand{\amp}{&}\) \(\definecolor{fillinmathshade}{gray}{0.9}\)Electromagnetic radiation—light—is a form of energy whose behavior is described by the properties of both waves and particles. Some properties of electromagnetic radiation, such as its refraction when it passes from one medium to another are explained best by describing light as a wave. Other properties, such as absorption and emission, are better described by treating light as a particle. The exact nature of electromagnetic radiation remains unclear, as it has since the development of quantum mechanics in the first quarter of the 20th century.1 Nevertheless, the dual models of wave and particle behavior provide a useful description for electromagnetic radiation.
Electromagnetic radiation consists of oscillating electric and magnetic fields that propagate through space along a linear path and with a constant velocity. In a vacuum electromagnetic radiation travels at the speed of light, c, which is 2.997 × 10⁸ m/s. When electromagnetic radiation moves through a medium other than a vacuum its velocity, v, is less than the speed of light in a vacuum. The difference between v and c is sufficiently small (<0.1%) that the speed of light to three significant figures, 3.00 × 10⁸ m/s, is accurate enough for most purposes.
The oscillations in the electric and magnetic fields are perpendicular to each other, and to the direction of the wave’s propagation. Figure \(\PageIndex{1}\) shows an example of plane-polarized electromagnetic radiation, consisting of a single oscillating electric field and a single oscillating magnetic field.
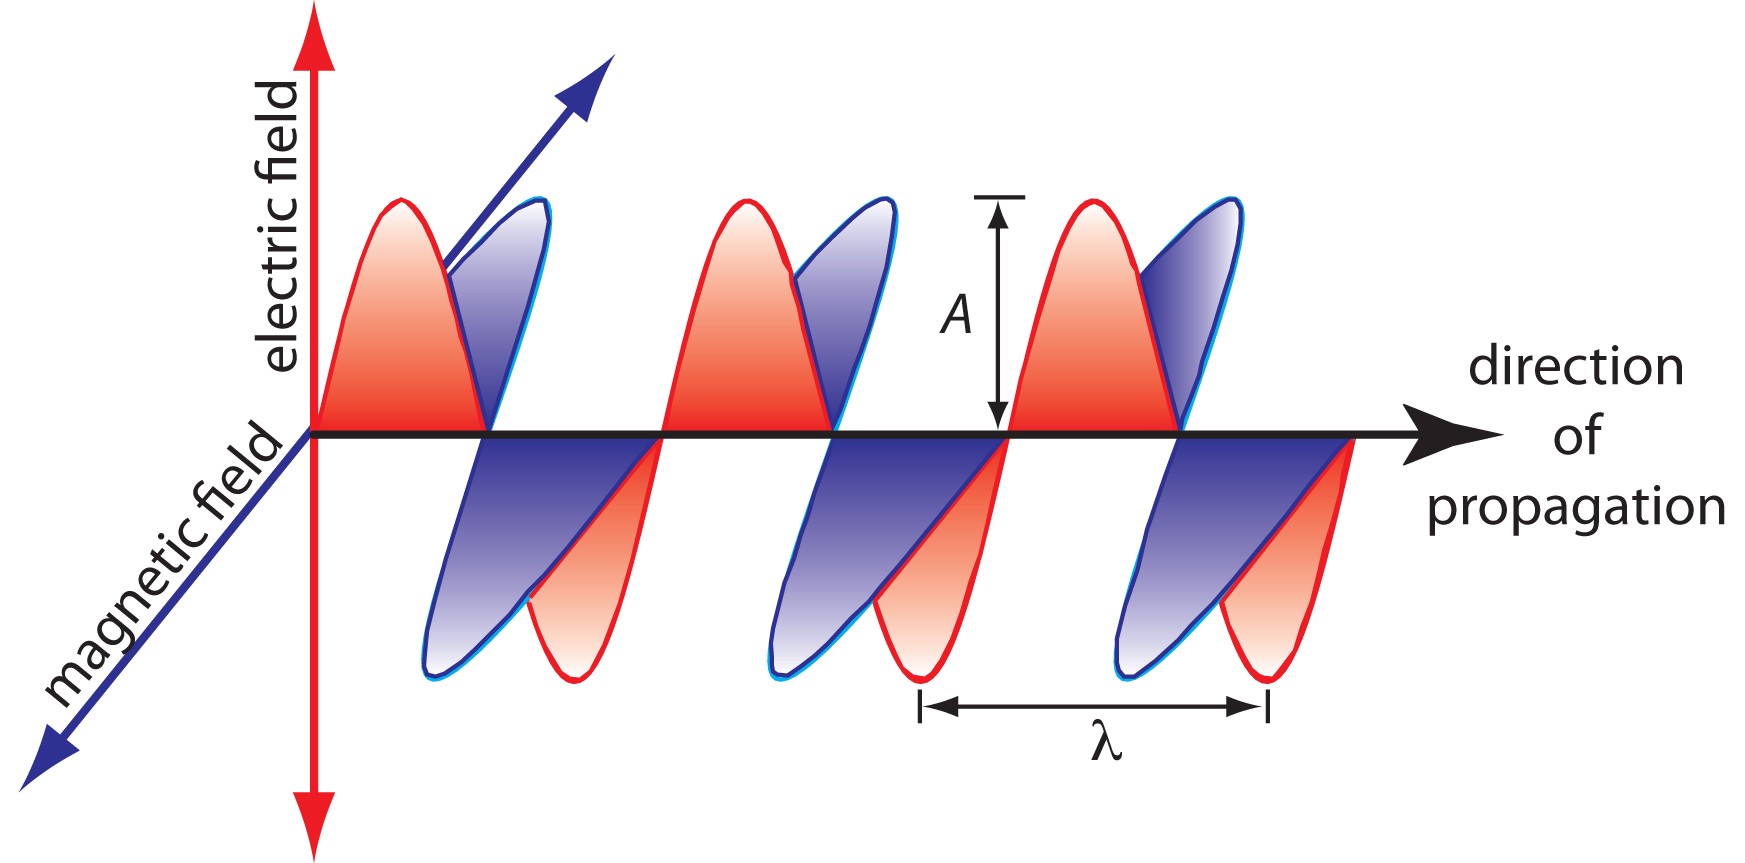
An electromagnetic wave is characterized by several fundamental properties, including its velocity, amplitude, frequency, phase angle, polarization, and direction of propagation.2 For example, the amplitude of the oscillating electric field at any point along the propagating wave is
\[A_\ce{t} = A_\ce{e}\sin(2πνt + \phi)\]
where At is the magnitude of the electric field at time t, Ae is the electric field’s maximum amplitude, ν is the wave’s frequency—the number of oscillations in the electric field per unit time—and \(\phi\) is a phase angle, which accounts for the fact that At need not have a value of zero at t = 0. The identical equation for the magnetic field is
\[A_\ce{t} =A_\ce{m}\sin(2πνt + \phi)\]
where Am is the magnetic field’s maximum amplitude.
Units
Other properties also are useful for characterizing the wave behavior of electromagnetic radiation. The wavelength, λ, is defined as the distance between successive maxima (Figure \(\PageIndex{1}\)). For ultraviolet and visible electromagnetic radiation the wavelength is usually expressed in nanometers (1 nm = 10–9 m), and for infrared radiation it is given in microns (1 μm = 10–6 m). The relationship between wavelength and frequency is
\[λ = \dfrac{c}{ν}\]
Another unit useful unit is the wavenumber, \(\tilde{ν}\), which is the reciprocal of wavelength
\[\tilde{ν} = \dfrac{1}{λ}\]
Wavenumbers are frequently used to characterize infrared radiation, with the units given in cm–1.
Example \(\PageIndex{1}\)
In 1817, Josef Fraunhofer studied the spectrum of solar radiation, observing a continuous spectrum with numerous dark lines. Fraunhofer labeled the most prominent of the dark lines with letters. In 1859, Gustav Kirchhoff showed that the D line in the sun’s spectrum was due to the absorption of solar radiation by sodium atoms. The wavelength of the sodium D line is 589 nm. What are the frequency and the wavenumber for this line?
Solution
The frequency and wavenumber of the sodium D line are
\[ν = \dfrac{c}{λ} = \mathrm{\dfrac{3.00×10^8\: m/s}{589×10^{−9}\: m} = 5.09×10^{14}\: s^{−1}}\]
\[\tilde{ν} = \dfrac{1}{λ} = \mathrm{\dfrac{1}{589×10^{−9}\: m} × \dfrac{1\: m}{100\: cm} = 1.70×10^4\: cm^{−1}}\]
Exercise \(\PageIndex{1}\)
Another historically important series of spectral lines is the Balmer series of emission lines form hydrogen. One of the lines has a wavelength of 656.3 nm. What are the frequency and the wavenumber for this line?
Click here to review your answer to this exercise.
Regions of the Spectrum
The frequency and wavelength of electromagnetic radiation vary over many orders of magnitude. For convenience, we divide electromagnetic radiation into different regions—the electromagnetic spectrum—based on the type of atomic or molecular transition that gives rise to the absorption or emission of photons (Figure \(\PageIndex{2}\)). The boundaries between the regions of the electromagnetic spectrum are not rigid, and overlap between spectral regions is possible.
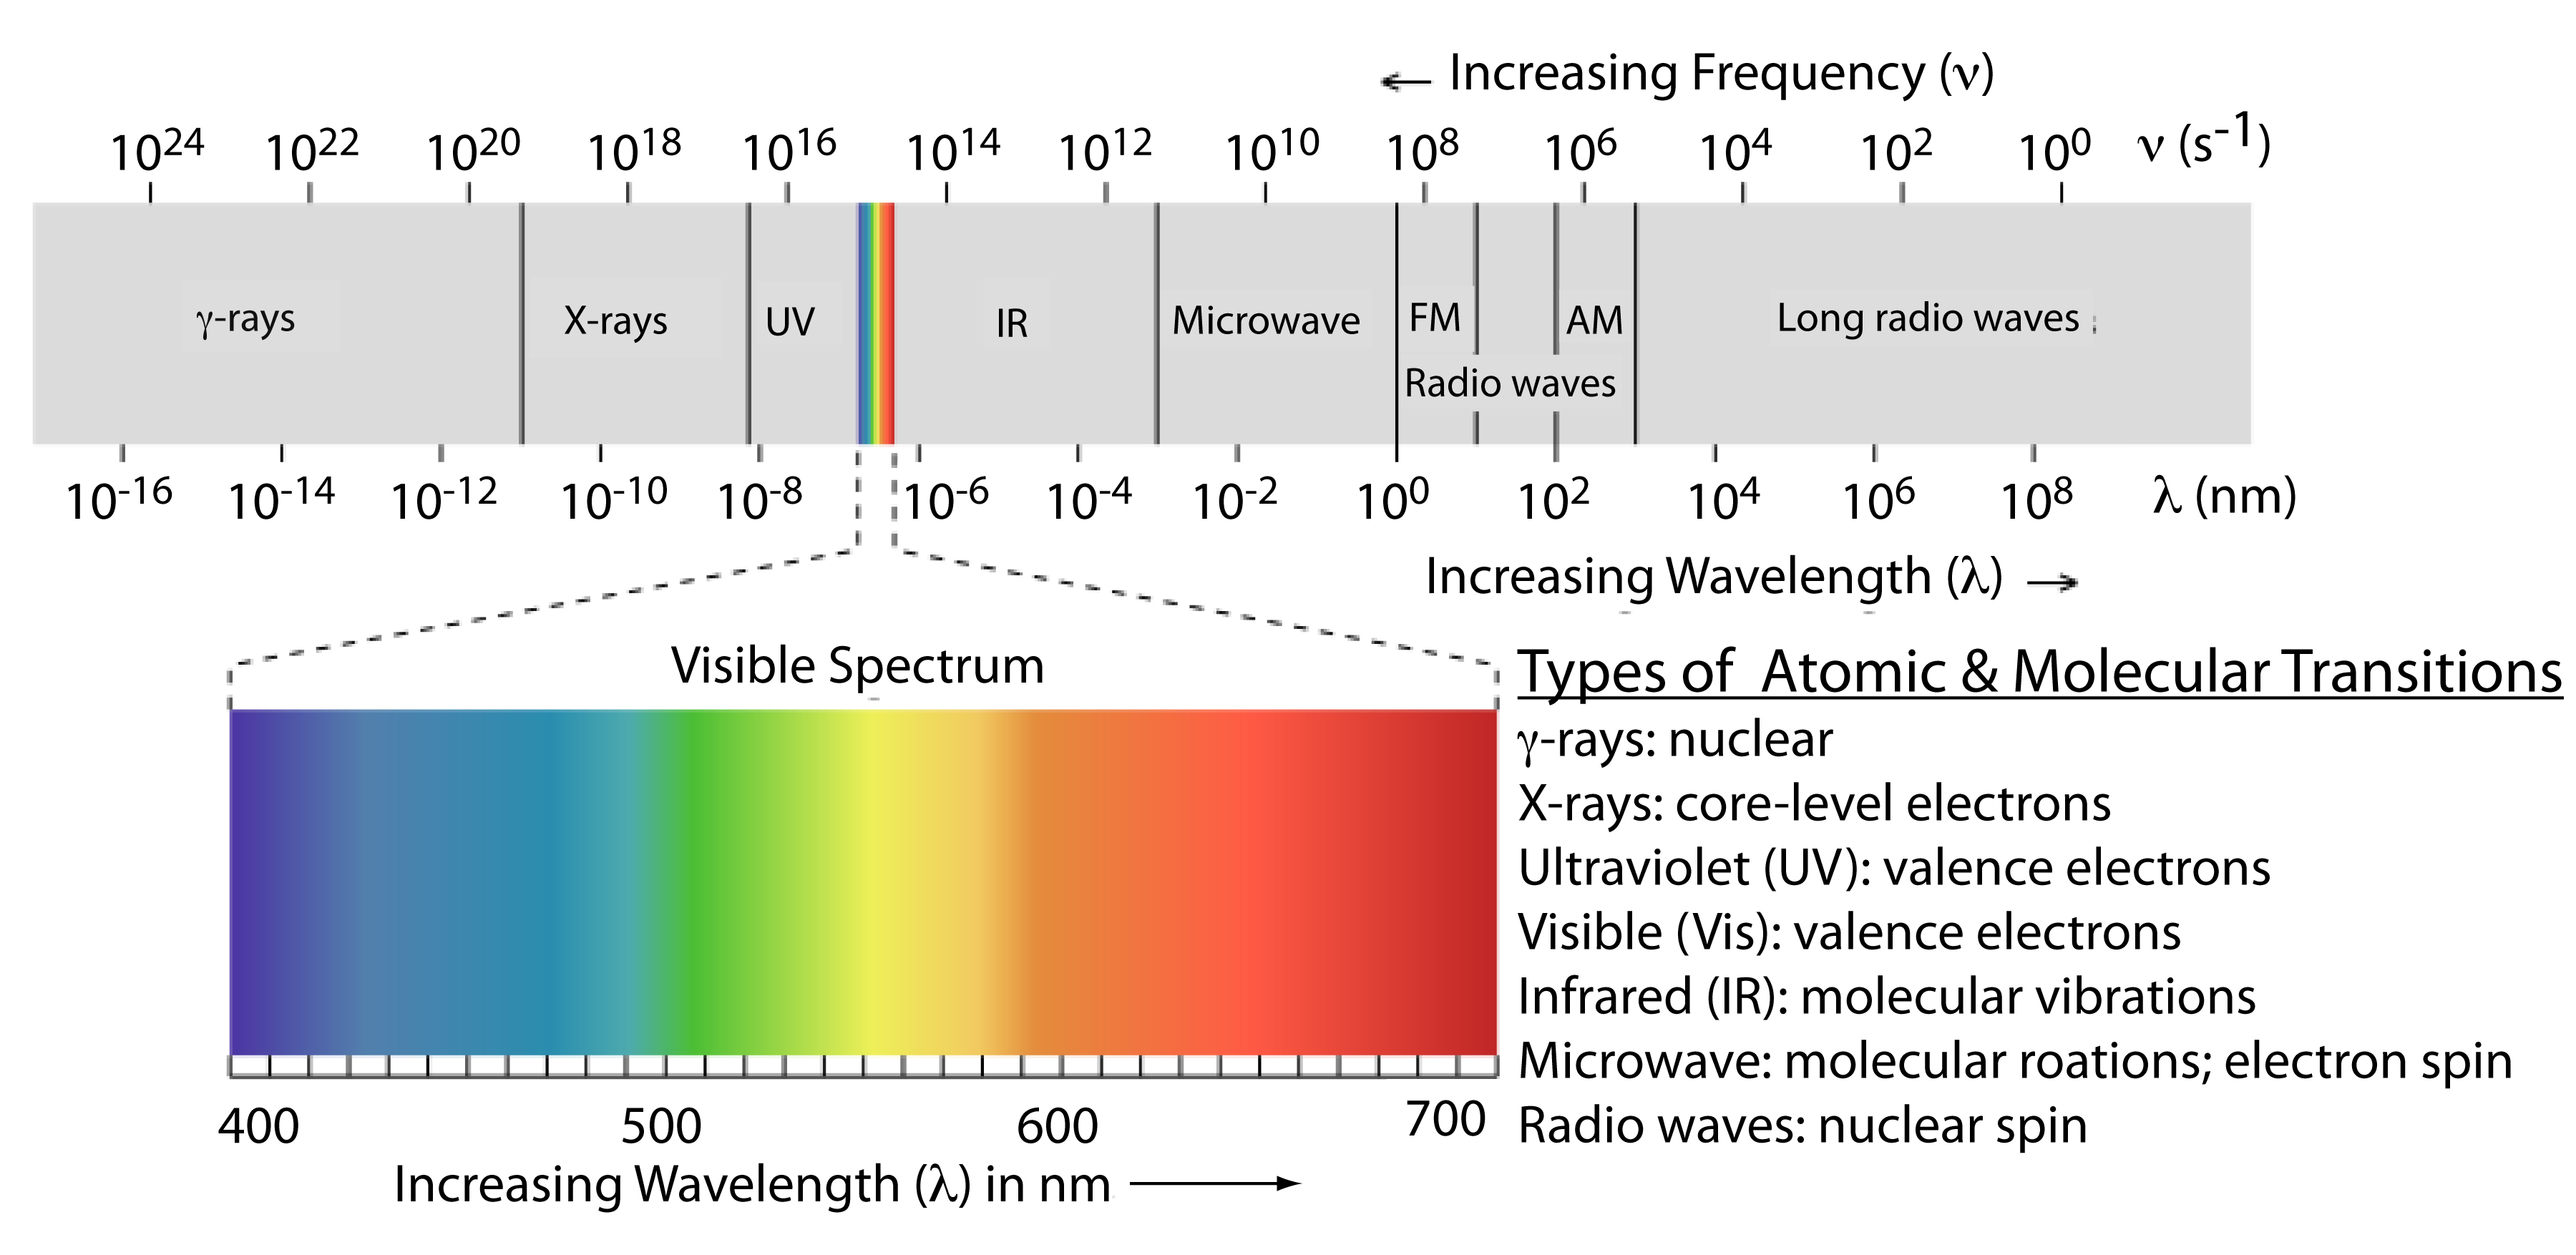
Above, we defined several characteristic properties of electromagnetic radiation, including its energy, velocity, amplitude, frequency, phase angle, polarization, and direction of propagation. A spectroscopic measurement is possible only if the photon’s interaction with the sample leads to a change in one or more of these characteristic properties. We can divide spectroscopy into two broad classes of techniques. In one class of techniques there is a transfer of energy between the photon and the sample. Table \(\PageIndex{1}\) provides a list of several representative examples.
Type of Energy Transfer |
Region of Electromagnetic Spectrum |
Spectroscopic Techniquea |
|---|---|---|
| absorption | γ-ray | Mossbauer spectroscopy |
| X-ray | X-ray absorption spectroscopy | |
| UV/Vis | UV/Vis spectroscopy atomic absorption spectroscopy | |
| IR | infrared spectroscopy raman spectroscopy | |
| Microwave | microwave spectroscopy | |
| Radio wave | electron spin resonance spectroscopy nuclear magnetic resonance spectroscopy | |
| emission (thermal excitation) | UV/Vis | atomic emission spectroscopy |
| photoluminescence | X-ray | X-ray fluorescence |
| UV/Vis | fluorescence spectroscopy phosphorescence spectroscopy atomic fluorescence spectroscopy | |
| chemiluminescence | UV/Vis | chemiluminescence spectroscopy |
Line Widths
A spectral line extends over a range of frequencies, not a single frequency (i.e., it has a nonzero linewidth). There are multiple reasons for this broadening and shifts and only two are discussed below.
- Lifetime Broadening. This mechanism ordinates directly from the Heisenberg Principle, which the lifetime of an excited state (due to the spontaneous radiative decay) with the uncertainty of its energy \(\Delta t\). Since the system is changing in time, it is impossible to estimate the energies of wavefunctions exactly (\(\Delta E\). \[ \Delta E \Delta t \ge \dfrac{\hbar}{2}\] Hence, systems with excited-states that have short lifetimes will have a large energy uncertainty and a broad emission. This broadening effect results in an broadened profile. As expected, the lifetime broadening can be experimentally if the decay rates can be artificially suppressed or enhanced.
- Doppler Broadening. This mechanism is intrinsic to atoms in a gas which are emitting radiation will have a distribution of velocities. Each photon emitted will be "red"- or "blue"-shifted by the Doppler effect depending on the velocity of the atom relative to the observer. The Doppler effect is the change in frequency of a wave (or other periodic event) for an observer moving relative to its source. It is commonly heard when a vehicle sounding a siren or horn approaches, passes, and recedes from an observer. Compared to the emitted frequency, the received frequency is higher during the approach, identical at the instant of passing by, and lower during the recession.
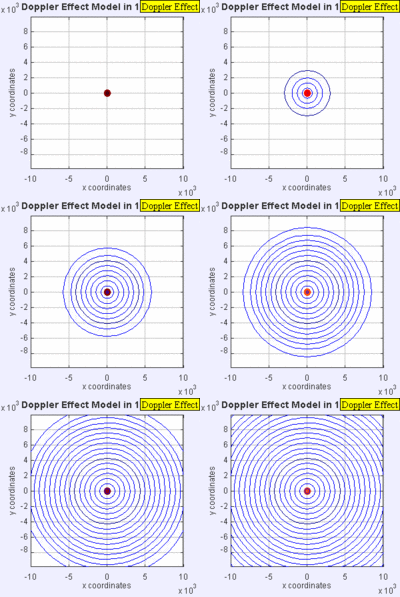
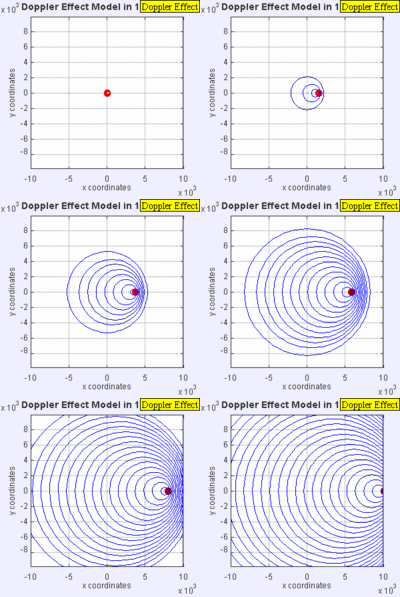
Doppler Broadening example with sound, but applies to light too. (left): Stationary sound source produces sound waves at a constant frequency \( u\), and the wave-fronts propagate symmetrically away from the source at a constant speed c (assuming speed of sound, c = 330 m/s), which is the speed of sound in the medium. The distance between wave-fronts is the wavelength. All observers will hear the same frequency, which will be equal to the actual frequency of the source where \( u= u-o\) (right): The same sound source is radiating sound waves at a constant frequency in the same medium. However, now the sound source is moving with a speed so the center of each new wavefront is now slightly displaced to the right. As a result, the wave-fronts begin to bunch up on the right side (in front of) and spread further apart on the left side (behind) of the source. An observer in front of the source will hear a higher frequency. Images used with permission from Wikipedia (credit Lookang).
If the speeds are small compared to the speed of the wave, the relationship between observed frequency \( u_o\) and emitted frequency \( u\) is approximately
\[ u =\left(1+\dfrac{\Delta v}{c}\right)v_0 \]
The Doppler effect also applies for spectroscopy. For example, the higher the temperature of the gas, the wider the distribution of velocities in the gas (via the Maxwell-Bolztmann Distribution). Since the spectral line is a combination of all of the emitted radiation, the higher the temperature of the gas, the broader the spectral line emitted from that gas. If the average velocity of a gas is non-zero, then a Doppler shift will be observed that is correlated with the amplitude of this average velocity.
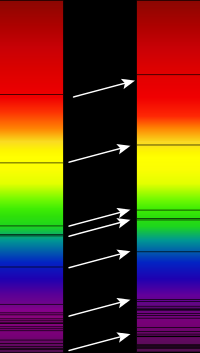
Redshift of spectral lines in the optical spectrum of a supercluster of distant galaxies (right), as compared to that of the Sun (left) since the sun is not moving with respect to Earth (or weakly) and the galaxy is moving away. from Wikipedia (Credit Georg Wiora).
Doppler broadening is one of the explanations for the broadening of spectral lines, and as such gives an indication for the temperature of observed material. Other causes of velocity distributions may exist, though, for example due to turbulent motion. Doppler broadening can also be used to determine the velocity distribution of a gas given its absorption spectrum. In particular, this has been used to determine the velocity distribution of interstellar gas clouds.
Example \(\PageIndex{2}\)
Find the uncertainty of simultaneously measuring the frequency and wavelength of an emission from an excited molecule, if the wavelength is 430 nm and the excited state lifetime is 0.50 nanoseconds.
Soluton
1. Use Heisenberg's uncertainty principle and the relationship between energy and frequency to find the uncertainty of frequency.
\[ \Delta E \Delta t \geq \dfrac{h}{4 \pi} \nonumber \]
\[ \Delta E = h \Delta u \nonumber\]
\[ h \Delta u \Delta t \geq \dfrac{h}{4 \pi} \nonumber\]
\[ \Delta u \geq \dfrac{1}{4 \pi \Delta t} \nonumber\]
The maximum value for Δt is the lifetime of the excited state.
\[ \Delta u \geq \dfrac{1}{4 \pi 0.50 ns \times \dfrac{s}{10^9\ ns}} \nonumber\]
\[ \Delta u \geq 1.6 \times 10^8\ s^{-1} \nonumber\]
2. Use the uncertainty of frequency and the relationship between frequency and wavelength to find the uncertainty of the wavelength.
\[ \lambda = \dfrac{c}{ u} \nonumber\]
\[ | \Delta \lambda | = \dfrac{c}{ u^2} | \Delta u | \nonumber\]
\[ | \Delta \lambda | = \dfrac{\lambda ^2 | \Delta u | }{c} \nonumber\]
\[ | \Delta \lambda | = \dfrac{(430\ nm)^2 \times 1.6 \times 10^8\ s^{-1}}{2.998 \times 10^8\ m/s} \times \dfrac{m}{10^9\ nm} \nonumber\]
\[ | \Delta \lambda | = 2.3 \times 10^{-7}\ nm \nonumber\]
Absorption and Emission
In absorption spectroscopy a photon is absorbed by an atom or molecule, which undergoes a transition from a lower-energy state to a higher-energy, or excited state (Figure \(\PageIndex{3}\)). The type of transition depends on the photon’s energy. The electromagnetic spectrum in Figure \(\PageIndex{2}\), for example, shows that absorbing a photon of visible light promotes one of the atom’s or molecule’s valence electrons to a higher-energy level. When an molecule absorbs infrared radiation, on the other hand, one of its chemical bonds experiences a change in vibrational energy.
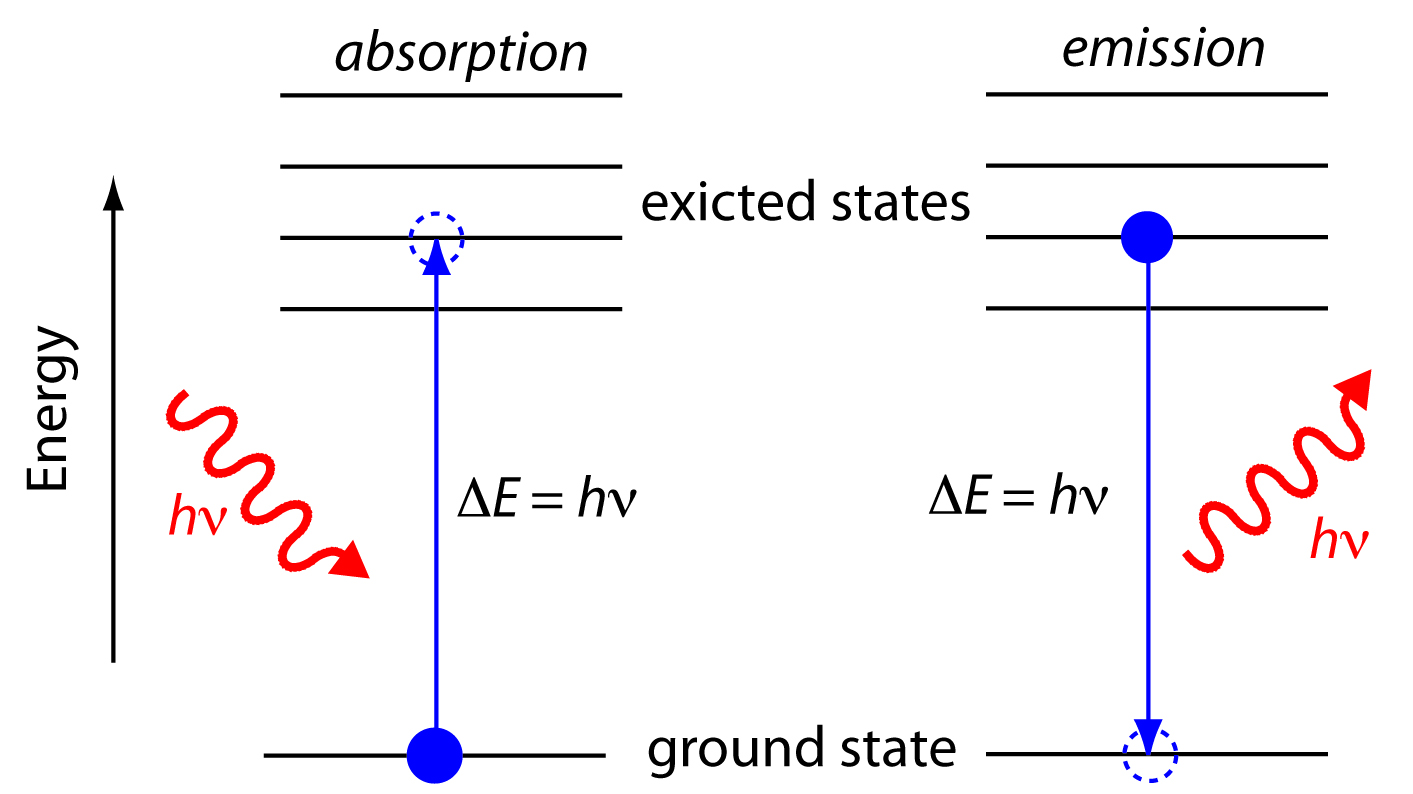
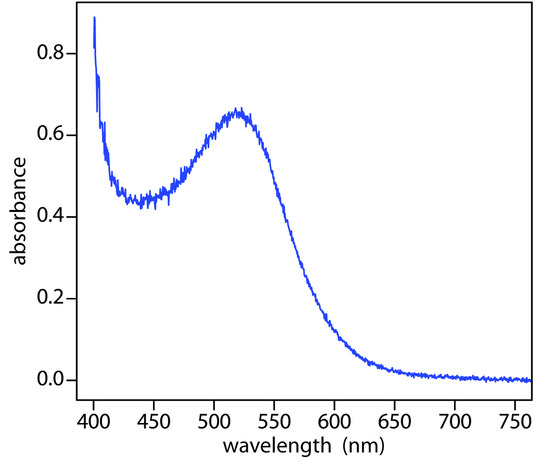
When it absorbs electromagnetic radiation the number of photons passing through a sample decreases. The measurement of this decrease in photons, which we call absorbance, is a useful analytical signal. Note that the each of the energy levels in Figure \(\PageIndex{3}\) has a well-defined value because they are quantized. Absorption occurs only when the photon’s energy, hν, matches the difference in energy, ∆E, between two energy levels. A plot of absorbance as a function of the photon’s energy is called an absorbance spectrum. Figure \(\PageIndex{4}\), for example, shows the absorbance spectrum of cranberry juice.
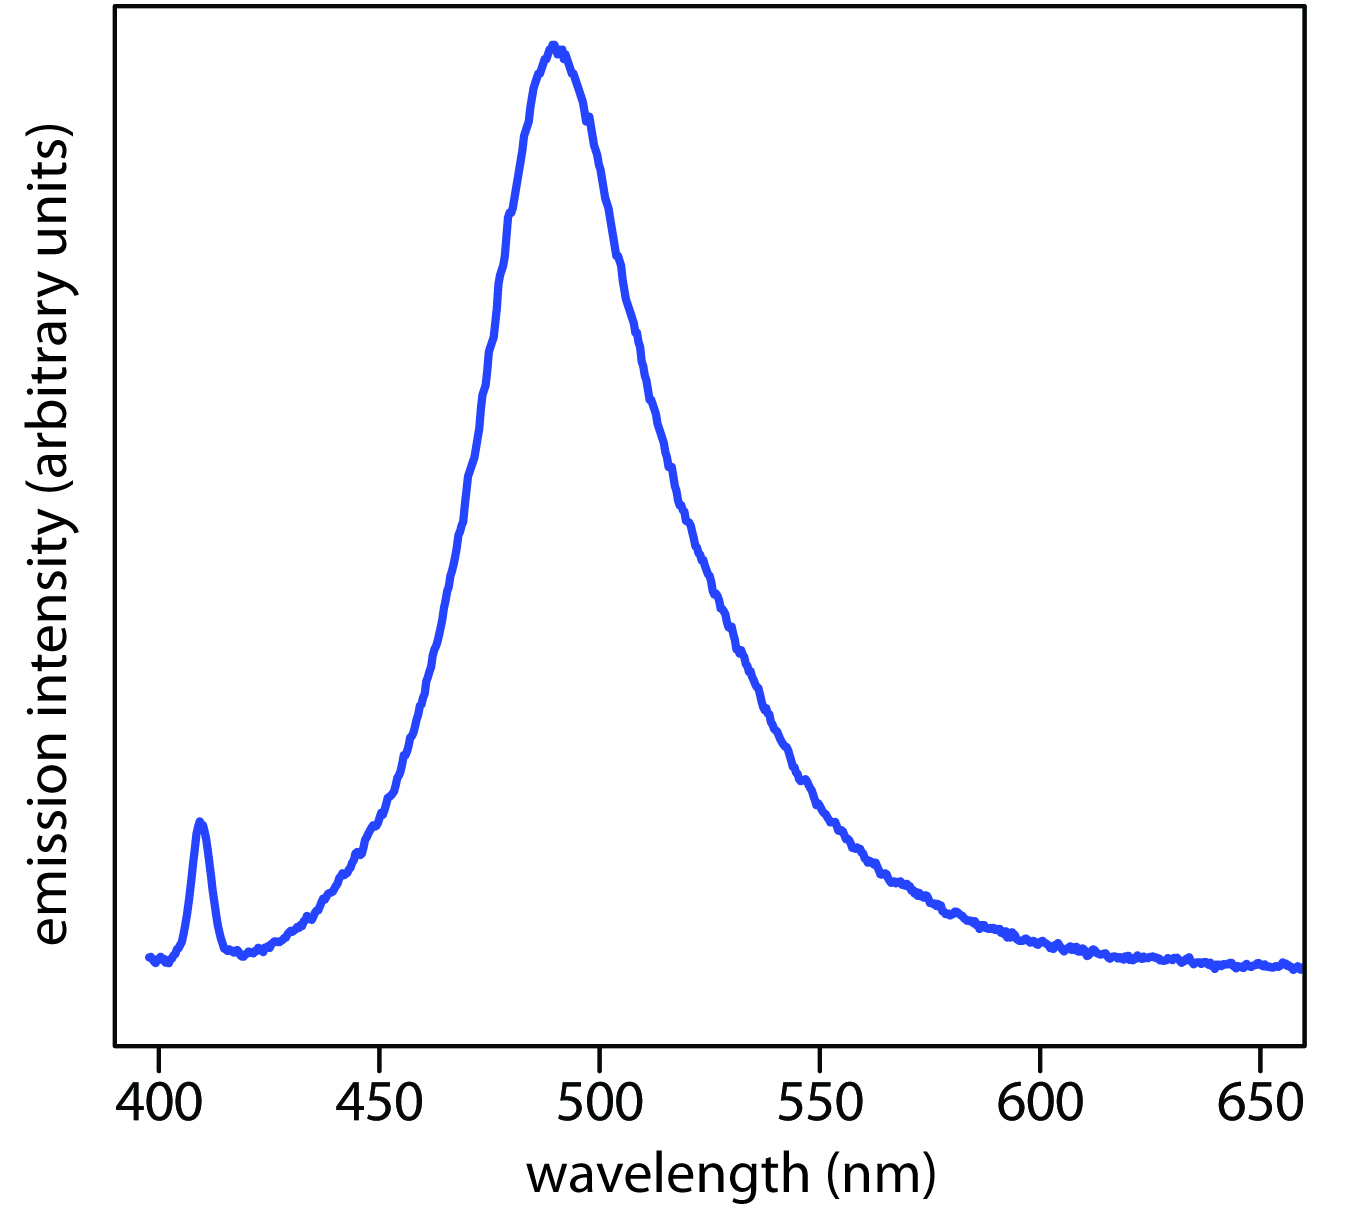
When an atom or molecule in an excited state returns to a lower energy state, the excess energy often is released as a photon, a process we call emission (Figure \(\PageIndex{4}\)). There are several ways in which an atom or molecule may end up in an excited state, including thermal energy, absorption of a photon, or by a chemical reaction. Emission following the absorption of a photon is also called photoluminescence, and that following a chemical reaction is called chemiluminescence. A typical emission spectrum is shown in Figure \(\PageIndex{6}\).
Selection Rules
The transition probability is defined as the probability of particular spectroscopic transition to take place. When an atom or molecule absorbs a photon, the probability of an atom or molecule to transit from one energy level to another depends on two things: the nature of initial and final state wavefunctions and how strongly photons interact with an wavefunction. Transition strengths are used to describe transition probability. Selection rules are utilized to determine whether a transition is allowed or not. Electronic dipole transitions are by far the most important for the topics covered in this module.
In an atom or molecule, an electromagnetic wave (for example, visible light) can induce an oscillating electric or magnetic moment. If the frequency of the induced electric or magnetic moment is the same as the energy difference between one wavefunction \(\psi_1\) and another wavefunction \(\psi_2\), the interaction between an atom or molecule and the electromagnetic field is resonant (which means these two have the same frequency). Typically, the amplitude of this (electric or magnetic) moment is called the transition moment. In quantum mechanics, the transition probability of one molecule from one wavefunction \(\psi_1\) to another wavefunction \(\psi_2\) is given by \(|\vec{M}_{21}|^2\), and \(\vec{M}_{21}\) is called the transition dipole moment, or transition moment, from \(\psi_1\) to \(\psi_2\). \(\vec{M}_{21}\) can be written as
\[\vec{M}_{21}=\int \psi_2\vec{\mu}\psi_1d\tau \label{Select}\]
where \(\psi_1\) and \(\psi_2\) are two different wavefunctions in one molecule, and \(\vec{M}_{21}\) is the electric dipole moment operator. If we have a system with n atoms and each has charge \(q_n\), and the dipole moment operator is can be written as
\[\displaystyle \vec{\mu}=\sum_{n}q_n\vec{r}_n\]
the \(\vec{r}_{n}\) is the position vector operator for the ith charge. The nature of \(\psi_1\) and \(\psi_1\) change (e..g, the quantum numbers associated with each wavefunction) \(\vec{M}_{21}\). Large values of \(\vec{M}_{21}\) signify transitions with strong probabilities and small \(\vec{M}_{21}\) values represent weak probabilities. A zero probability for a transition is a forbidden transition.
For electronic wavefucntion (either atoms or molecules), the two primary selection rules governing transitions between electronic energy wavefunctions are:
- \(ΔS = 0\) (The Spin Rule)
- \(Δl = \pm 1\) (The Orbital Rule (or Laporte rule))
The spin multiplicity can be calculated from the quantum number \(S\) of the total spin or from the number of unpaired electrons (like when determining paramagnetic properties of molecules). The spin-multiplicity is \((2S+1)\), where
\[S = \underset{\text{spin quantum #}}{\sum s}\]
The Spin Rule says that allowed transitions must involve the promotion of electrons without a change in their spin. The Orbital Rule says that transitions within a given set of p or d orbitals (i.e. those which only involve a redistribution of electrons within a given subshell) are forbidden. The orbital rule can be used to construct Grotrian diagrams, which show the allowed electronic transitions between the energy levels of atoms (Figure \(\PageIndex{6}\)) by taking into account the specific selection rules related to the system (e..g, the Orbital or Spin Rules).
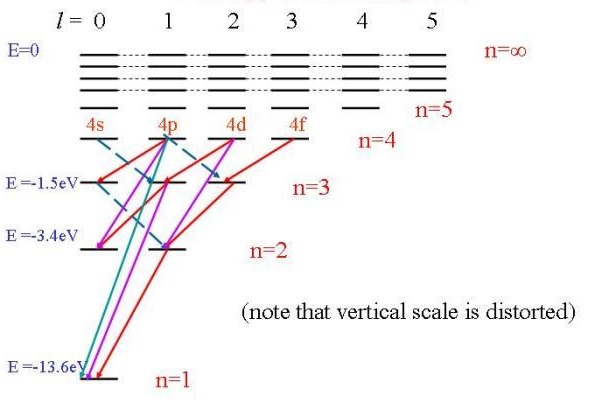
Transitions not permitted by selection rules are said forbidden, which means that theoretically they must not occur. However, in practice they may occur, but very low probabilities (see \(\PageIndex{3}\) below).
The Beers-Lambert Law
The Beer-Lambert law relates the attenuation of light to the properties of the material through which the light is traveling. This page takes a brief look at the Beer-Lambert Law and explains the use of the terms absorbance and molar absorptivity relating to UV-visible absorption spectrometry. For each wavelength of light passing through the spectrometer, the intensity of the light passing through the reference cell is measured. This is usually referred to as \(I_o\) - that's \(I\) for Intensity.

The intensity of the light passing through the sample cell is also measured for that wavelength - given the symbol, \(I\). If \(I\) is less than \(I_o\), then the sample has absorbed some of the light (neglecting reflection of light off the cuvetter surface). A simple bit of math is then done in the computer to convert this into something called the absorbance of the sample - given the symbol, \(A\).
Note
The absorbance of a transition depends on two external assumptions.
- The absorbance is directly proportional to the concentration (\(c\)) of the solution of the the sample used in the experiment.
- The absorbance is directly proportional to the length of the light path (\(l\)), which is equal to the width of the cuvette.
Assumption one relates the absorbance to concentration and can be expressed as
\[A \propto c \label{1}\]
The absorbance (\(A\)) is defined via the incident intensity \(I_o\) and transmitted intensity \(I\) by
\[ A=\log_{10} \left( \dfrac{I_o}{I} \right) \label{2}\]
Assumption two can be expressed as
\[A \propto l \label{3}\]
Combining Equations \(\ref{1}\) and \(\ref{3}\):
\[A \propto cl \label{4}\]
This proportionality can be converted into an equality by including a proportionality constant.
\[A = \epsilon c l \label{5}\]
This formula is the common form of the Beer-Lambert Law, although it can be also written in terms of intensities:
\[ A=\log_{10} \left( \dfrac{I_o}{I} \right) = \epsilon l c \label{6} \]
The constant \(\epsilon\) is called molar absorptivity or molar extinction coefficient and is a measure of the probability of the electronic transition. On most of the diagrams you will come across, the absorbance ranges from 0 to 1, but it can go higher than that. An absorbance of 0 at some wavelength means that no light of that particular wavelength has been absorbed. The intensities of the sample and reference beam are both the same, so the ratio Io/I is 1. Log10 of 1 is zero.
Example \(\PageIndex{3}\)
In a sample with an absorbance of 1 at a specific wavelength, what is the relative amount of light that was absorbed by the sample?
Solution
This question does not need Beer-Lambert Law (Equation \(\ref{5}\)) to solve, but only the definition of absorbance (Equation \(\ref{2}\))
\[ A=\log_{10} \left( \dfrac{I_o}{I} \right) \nonumber \]
The relative loss of intensity is
\[\dfrac{I-I_o}{I_o} = 1- \dfrac{I}{I_o} \nonumber\]
Equation \(\ref{2}\) can be rearranged using the properties of logarithms to solved for the relative loss of intensity:
\[ 10^A= \dfrac{I_o}{I} \nonumber \]
\[ 10^{-A}= \dfrac{I}{I_o} \nonumber\]
\[ 1-10^{-A}= 1- \dfrac{I}{I_o} \nonumber\]
Substituting in \(A=1\)
\[ 1- \dfrac{I}{I_o}= 1-10^{-1} = 1- \dfrac{1}{10} = 0.9 \nonumber\]
Hence 90% of the light at that wavelength has been absorbed and that the transmitted intensity is 10% of the incident intensity
To confirm, substituting these values into Equation \(\ref{2}\) to get the absorbance back:
\[\dfrac{I_o}{I} = \dfrac{100}{10} =10 \label{7a} \nonumber\]
and
\[\log_{10} 10 = 1 \label{7b} \nonumber\]
You will find that various different symbols are given for some of the terms in the equation - particularly for the concentration and the solution length.

The Greek letter epsilon in these equations is called the molar absorptivity - or sometimes the molar absorption coefficient. The larger the molar absorptivity, the more probable the electronic transition. In uv spectroscopy, the concentration of the sample solution is measured in molL-1 and the length of the light path in cm. Thus, given that absorbance is unitless, the units of molar absorptivity are L mol-1 cm-1. However, since the units of molar absorptivity is always the above, it is customarily reported without units.
Example \(\PageIndex{4}\)
Guanosine has a maximum absorbance of 275 nm. \(\epsilon_{275} = 8400 M^{-1} cm^{-1}\) and the path length is 1 cm. Using a spectrophotometer, you find the that \(A_{275}= 0.70\). What is the concentration of guanosine?
Solution
To solve this problem, you must use Beer's Law.
\[A = \epsilon lc \nonumber\]
0.70 = (8400 M-1 cm-1)(1 cm)(\(c\))
Next, divide both side by [(8400 M-1 cm-1)(1 cm)]
\(c\) = 8.33x10⁻⁵ mol/L
Example \(\PageIndex{5}\)
There is a substance in a solution (4 g/liter). The length of cuvette is 2 cm and only 50% of the certain light beam is transmitted. What is the extinction coefficient?
Solution
Using Beer-Lambert Law, we can compute the absorption coefficient. Thus,
\[- \log \left(\dfrac{I_t}{I_o} \right) = - \log(\dfrac{0.5}{1.0}) = A = {8} \epsilon \nonumber\]
Then we obtain that
\(\epsilon\) = 0.0376
Example \(\PageIndex{6}\)
In Example 3 above, what is the molar absorption coefficient if the molecular weight is 100?
Solution
It can simply obtained by multiplying the absorption coefficient by the molecular weight. Thus,
\(\epsilon\) = 0.0376 x 100 = 3.76 L·mol-1·cm-1
The proportion of the light absorbed will depend on how many molecules it interacts with. Suppose you have got a strongly colored organic dye. If it is in a reasonably concentrated solution, it will have a very high absorbance because there are lots of molecules to interact with the light. However, in an incredibly dilute solution, it may be very difficult to see that it is colored at all. The absorbance is going to be very low. Suppose then that you wanted to compare this dye with a different compound. Unless you took care to make allowance for the concentration, you couldn't make any sensible comparisons about which one absorbed the most light.
Example \(\PageIndex{7}\)
In Example \(\PageIndex{3}\) above, how much is the beam of light is transmitted when 8 g/liter ?
Solution
Since we know \(\epsilon\), we can calculate the transmission using Beer-Lambert Law. Thus,
\(log(1) - log(I_t) = 0 - log(I_t)\) = 0.0376 x 8 x 2 = 0.6016
\(log(I_t)\) = -0.6016
Therefore, \(I_t\) = 0.2503 = 25%
Example \(\PageIndex{7}\)
The absorption coefficient of a glycogen-iodine complex is 0.20 at light of 450 nm. What is the concentration when the transmission is 40 % in a cuvette of 2 cm?
Solution
It can also be solved using Beer-Lambert Law. Therefore,
\[- \log(I_t) = - \log_{10}(0.4) = 0.20 \times c \times 2 \nonumber\]
Then \(c\) = 0.9948
The Beer-Lambert law Equation \(\ref{5}\) can be rearranged to obtain an expression for \(\epsilon\) (the molar absorptivity):
\[ \epsilon = \dfrac{A}{lc} \label{8}\]
Remember that the absorbance of a solution will vary as the concentration or the size of the container varies. Molar absorptivity compensates for this by dividing by both the concentration and the length of the solution that the light passes through. Essentially, it works out a value for what the absorbance would be under a standard set of conditions - the light traveling 1 cm through a solution of 1 mol dm-3. That means that you can then make comparisons between one compound and another without having to worry about the concentration or solution length.
Values for molar absorptivity can vary hugely. For example, ethanal has two absorption peaks in its UV-visible spectrum - both in the ultra-violet. One of these corresponds to an electron being promoted from a lone pair on the oxygen into a pi anti-bonding orbital; the other from a \(\pi\) bonding orbital into a \(\pi\) anti-bonding orbital. Table \(\PageIndex{2}\) gives values for the molar absorptivity of a solution of ethanal in hexane. Notice that there are no units given for absorptivity. That's quite common since it assumes the length is in cm and the concentration is mol dm-3, the units are mol-1 dm3 cm-1.
| electron jump | wavelength of maximum absorption (nm) | molar absorptivity |
|---|---|---|
| lone pair to \(\pi\) anti-bonding orbital | 290 | 15 |
| \(\pi\) bonding to \(\pi\) anti-bonding orbital | 180 | 10,000 |
The ethanal obviously absorbs much more strongly at 180 nm than it does at 290 nm. (Although, in fact, the 180 nm absorption peak is outside the range of most spectrometers.) You may come across diagrams of absorption spectra plotting absorptivity on the vertical axis rather than absorbance. However, if you look at the figures above and the scales that are going to be involved, you are not really going to be able to spot the absorption at 290 nm. It will be a tiny little peak compared to the one at 180 nm. To get around this, you may also come across diagrams in which the vertical axis is plotted as log10(molar absorptivity). If you take the logs of the two numbers in the table, 15 becomes 1.18, while 10,000 becomes 4. That makes it possible to plot both values easily, but produces strangely squashed-looking spectra!
| Transition type | Typical values of ε /m2mol-1 |
|---|---|
| Spin forbidden and Laporte forbidden | 0.1 |
| Spin allowed and Laporte forbidden | 1 - 10 |
| Spin allowed and Laporte allowed e.g. charge transfer bands |
1,000 - 106 |
Contributors and Attributions
Jim Clark (Chemguide.co.uk)
- Gamini Gunawardena from the OChemPal site (Utah Valley University)

