
4.4: Glass Transition
- Page ID
- 190669

\( \newcommand{\vecs}[1]{\overset { \scriptstyle \rightharpoonup} {\mathbf{#1}} } \)
\( \newcommand{\vecd}[1]{\overset{-\!-\!\rightharpoonup}{\vphantom{a}\smash {#1}}} \)
\( \newcommand{\dsum}{\displaystyle\sum\limits} \)
\( \newcommand{\dint}{\displaystyle\int\limits} \)
\( \newcommand{\dlim}{\displaystyle\lim\limits} \)
\( \newcommand{\id}{\mathrm{id}}\) \( \newcommand{\Span}{\mathrm{span}}\)
( \newcommand{\kernel}{\mathrm{null}\,}\) \( \newcommand{\range}{\mathrm{range}\,}\)
\( \newcommand{\RealPart}{\mathrm{Re}}\) \( \newcommand{\ImaginaryPart}{\mathrm{Im}}\)
\( \newcommand{\Argument}{\mathrm{Arg}}\) \( \newcommand{\norm}[1]{\| #1 \|}\)
\( \newcommand{\inner}[2]{\langle #1, #2 \rangle}\)
\( \newcommand{\Span}{\mathrm{span}}\)
\( \newcommand{\id}{\mathrm{id}}\)
\( \newcommand{\Span}{\mathrm{span}}\)
\( \newcommand{\kernel}{\mathrm{null}\,}\)
\( \newcommand{\range}{\mathrm{range}\,}\)
\( \newcommand{\RealPart}{\mathrm{Re}}\)
\( \newcommand{\ImaginaryPart}{\mathrm{Im}}\)
\( \newcommand{\Argument}{\mathrm{Arg}}\)
\( \newcommand{\norm}[1]{\| #1 \|}\)
\( \newcommand{\inner}[2]{\langle #1, #2 \rangle}\)
\( \newcommand{\Span}{\mathrm{span}}\) \( \newcommand{\AA}{\unicode[.8,0]{x212B}}\)
\( \newcommand{\vectorA}[1]{\vec{#1}} % arrow\)
\( \newcommand{\vectorAt}[1]{\vec{\text{#1}}} % arrow\)
\( \newcommand{\vectorB}[1]{\overset { \scriptstyle \rightharpoonup} {\mathbf{#1}} } \)
\( \newcommand{\vectorC}[1]{\textbf{#1}} \)
\( \newcommand{\vectorD}[1]{\overrightarrow{#1}} \)
\( \newcommand{\vectorDt}[1]{\overrightarrow{\text{#1}}} \)
\( \newcommand{\vectE}[1]{\overset{-\!-\!\rightharpoonup}{\vphantom{a}\smash{\mathbf {#1}}}} \)
\( \newcommand{\vecs}[1]{\overset { \scriptstyle \rightharpoonup} {\mathbf{#1}} } \)
\(\newcommand{\longvect}{\overrightarrow}\)
\( \newcommand{\vecd}[1]{\overset{-\!-\!\rightharpoonup}{\vphantom{a}\smash {#1}}} \)
\(\newcommand{\avec}{\mathbf a}\) \(\newcommand{\bvec}{\mathbf b}\) \(\newcommand{\cvec}{\mathbf c}\) \(\newcommand{\dvec}{\mathbf d}\) \(\newcommand{\dtil}{\widetilde{\mathbf d}}\) \(\newcommand{\evec}{\mathbf e}\) \(\newcommand{\fvec}{\mathbf f}\) \(\newcommand{\nvec}{\mathbf n}\) \(\newcommand{\pvec}{\mathbf p}\) \(\newcommand{\qvec}{\mathbf q}\) \(\newcommand{\svec}{\mathbf s}\) \(\newcommand{\tvec}{\mathbf t}\) \(\newcommand{\uvec}{\mathbf u}\) \(\newcommand{\vvec}{\mathbf v}\) \(\newcommand{\wvec}{\mathbf w}\) \(\newcommand{\xvec}{\mathbf x}\) \(\newcommand{\yvec}{\mathbf y}\) \(\newcommand{\zvec}{\mathbf z}\) \(\newcommand{\rvec}{\mathbf r}\) \(\newcommand{\mvec}{\mathbf m}\) \(\newcommand{\zerovec}{\mathbf 0}\) \(\newcommand{\onevec}{\mathbf 1}\) \(\newcommand{\real}{\mathbb R}\) \(\newcommand{\twovec}[2]{\left[\begin{array}{r}#1 \\ #2 \end{array}\right]}\) \(\newcommand{\ctwovec}[2]{\left[\begin{array}{c}#1 \\ #2 \end{array}\right]}\) \(\newcommand{\threevec}[3]{\left[\begin{array}{r}#1 \\ #2 \\ #3 \end{array}\right]}\) \(\newcommand{\cthreevec}[3]{\left[\begin{array}{c}#1 \\ #2 \\ #3 \end{array}\right]}\) \(\newcommand{\fourvec}[4]{\left[\begin{array}{r}#1 \\ #2 \\ #3 \\ #4 \end{array}\right]}\) \(\newcommand{\cfourvec}[4]{\left[\begin{array}{c}#1 \\ #2 \\ #3 \\ #4 \end{array}\right]}\) \(\newcommand{\fivevec}[5]{\left[\begin{array}{r}#1 \\ #2 \\ #3 \\ #4 \\ #5 \\ \end{array}\right]}\) \(\newcommand{\cfivevec}[5]{\left[\begin{array}{c}#1 \\ #2 \\ #3 \\ #4 \\ #5 \\ \end{array}\right]}\) \(\newcommand{\mattwo}[4]{\left[\begin{array}{rr}#1 \amp #2 \\ #3 \amp #4 \\ \end{array}\right]}\) \(\newcommand{\laspan}[1]{\text{Span}\{#1\}}\) \(\newcommand{\bcal}{\cal B}\) \(\newcommand{\ccal}{\cal C}\) \(\newcommand{\scal}{\cal S}\) \(\newcommand{\wcal}{\cal W}\) \(\newcommand{\ecal}{\cal E}\) \(\newcommand{\coords}[2]{\left\{#1\right\}_{#2}}\) \(\newcommand{\gray}[1]{\color{gray}{#1}}\) \(\newcommand{\lgray}[1]{\color{lightgray}{#1}}\) \(\newcommand{\rank}{\operatorname{rank}}\) \(\newcommand{\row}{\text{Row}}\) \(\newcommand{\col}{\text{Col}}\) \(\renewcommand{\row}{\text{Row}}\) \(\newcommand{\nul}{\text{Nul}}\) \(\newcommand{\var}{\text{Var}}\) \(\newcommand{\corr}{\text{corr}}\) \(\newcommand{\len}[1]{\left|#1\right|}\) \(\newcommand{\bbar}{\overline{\bvec}}\) \(\newcommand{\bhat}{\widehat{\bvec}}\) \(\newcommand{\bperp}{\bvec^\perp}\) \(\newcommand{\xhat}{\widehat{\xvec}}\) \(\newcommand{\vhat}{\widehat{\vvec}}\) \(\newcommand{\uhat}{\widehat{\uvec}}\) \(\newcommand{\what}{\widehat{\wvec}}\) \(\newcommand{\Sighat}{\widehat{\Sigma}}\) \(\newcommand{\lt}{<}\) \(\newcommand{\gt}{>}\) \(\newcommand{\amp}{&}\) \(\definecolor{fillinmathshade}{gray}{0.9}\)The glass transition is probably the most commonly-cited characteristic of a polymeric material. At the glass transition temperature, the physical nature of the material changes subtly. It goes from being a rubbery, flexible material at higher temperature, above the glass transition, to a glassy, harder material at a lower temperature. The material is still a solid either way, but there is a definite change in how it responds to stimuli.
A material could certainly be useful in either state. We might want a plastic to be more rigid, like a water bottle or a rod for a shower curtain. Alternatively, we might want it to be softer, like a seat cushion. Either way, it might be helpful to know the temperature at which the material will change from one type to the other.
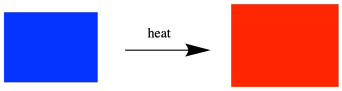
The glass transition is a little like what happens to gummy bears when you put them in ice cream. Straight from the bag, gummy bears are chewy, but they don't feel like they will break your teeth. Put them on ice cream and that changes. They become much harder to chew.
The classic explanation for the glass transition is based on the idea of chain flow. Polymers are long-chain molecules and, given a little energy, the chains move around. They wiggle. They undergo bond rotations, switching from one conformation to another. A block of material contains piles of chains, like a nest of snakes. Chain ends and loops squirm past each other continuously.
Chain flow allows a material to adapt when forces are exerted on it. We can bend an eraser because the chains in the rubber slide over each other and adopt a new shape. At least, that's what happens at room temperature. It might not work if the eraser were accidentally dropped in some liquid nitrogen, which is very, very cold.
As a block of material cools down, it contracts. The molecules become packed more closely together. At some point, the free volume -- that's the amount of volume in the material that is not actually taken up by the molecules -- becomes too small to allow chains to move past each other. All of those chains need a little room around them if they are going to undergo conformational changes, and conformational changes are how polymer chains move. Without that extra room, the material suddenly becomes less flexible.
If we start in the glassy state and increase the temperature, the volume of the material is expanding, and the free volume is increasing, too. At some point, the free volume becomes great enough that chains can slip past each other. The material becomes more flexible. It becomes rubbery.
Now, this transition is not the same thing as melting. The chains are not completely overcoming their interactions with each other and gaining freedom of movement in any direction. The chains are still highly entangled. Portions of the chain are sliding past each other but overall things have not changed that drastically. The block of polymer does not turn into a gooey puddle of liquid.
Well, if a material can change from glassy to rubbery at a certain temperature, there will be consequences in how the material behaves. For example, the tires on your car are meant to be rubbery and flexible; that factor helps them grip the road. If the weather gets too cold and your tires become glassy, the tires no longer have the same amount of flexibility, and you don't have as much traction. "All-weather tires" are composed of a rubber that has a very low glass transition temperature, helping to avoid this problem. ("Snow tires" are a different thing; they have patterns in the treads that help channel away the snow in order to improve traction.) Knowing when this change will occur would be very useful. So, how do we determine the glass transition?
Phase changes, such as melting points, are measured using calorimetry, so let's start there. When a solid is heated, its temperature increases. That seems simple enough. Temperature is basically a measure of heat content, so as heat flows in, the measured temperature rises. This simple relationship breaks down at the melting point. At that point, heat flowing into the material is consumed by the breaking of intermolecular forces. Overcoming these attractions costs extra energy. Consequently, there is a point at which the temperature rise in the material stalls out temporarily while it melts.
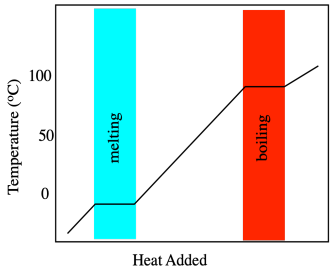
This extra heat needed to melt the material is called the heat of melting or, more commonly, the heat of fusion. Heat of fusion actually refers to the opposite process as the material is cooled and frozen. As heat is carried away from a cooling material, it cools down gradually, but there comes a point at which those strong intermolecular interactions form, giving off some extra heat. The fusion temperature is the same as the melting temperature, and the heat of fusion is the same as the heat of melting, but in one case the heat is added and in another case the heat is given off. In principle, if we just heat something up and look for that stalling point in the temperature, we can find the temperature of the phase transition.
Differential scanning calorimetry
Differential scanning calorimetry (DSC) is a technique that is commonly used to measure phase transitions, including the glass transition temperature. It is based on the same ideas but the experiment is run in a slightly different way. In DSC, we have two tiny sample chambers side by side. One contains the material we are interested in and the other (empty) one is used as a reference. The instrument heats both samples at a constant rate, all the while maintaining both of them at the same temperature. Consequently, it may actually add more heat to one chamber than the other, so that they both reach 30.5 °C at the same time, then 30.6 °C, and so on. Once we reach the melting point of the sample of interest, heat flow into that sample must be increased so that it can keep up with the reference. Past that point, the heat flow drops back to a more normal level.
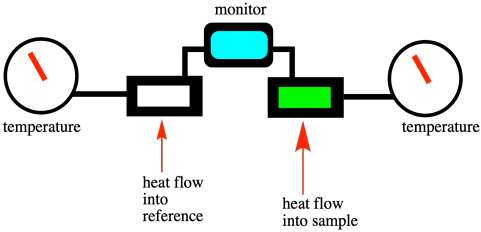
If we look at a DSC scan, we see a graph of heat flow on the y-axis and temperature on the x-axis. The heat flow usually stays pretty constant as the temperature increases. At the melting point, heat flow increases, but then it drops back down once the melting point has been overcome. It may not drop back to the same level as before, however, because the heat flow that is recorded is related to the heat capacity of the material. The solid and the liquid usually respond differently to heat. In general, because the molecules in a liquid can freely rotate, they have something else to do with added heat. Liquids thus have a slightly higher heat capacity than their corresponding solids.

All of that explanation hopefully prepares us for a DSC study of the glass transition temperature. It works the same way, but only up to a point. If we look at a DSC scan, we still see heat flow on the y-axis and temperature on the x-axis. At the glass transition, heat flow bumps up slightly -- and remains there. It looks very different from a melting point. A DSC scan of a melting point shows a "peak" at the transition temperature. A DSC scan of a glass transition point shows only a little step, like a riverbank

Why is it different? Well, the glass transition is not really a phase change like the melting point or boiling point. It does not involve a physical change of state. It was a solid before and it is a solid afterward. No intermolecular interactions must suddenly be overcome to free the molecules from each other. Instead, it's just a volume change. The free volume became great enough that the chains can slip past each other, but the chains are still clinging together in a solid-state. Now, that additional movement does have consequences. The material becomes more flexible. If heat flows in, there is more freedom of motion into which the heat can be distributed. In other words, there is a slight increase in heat capacity, and that's what we observe in DSC.
One practical note: DSC scans can actually be displayed in two different ways. The y-axis can either display heat flowing in or heat flowing out. That means melting points can look like peaks or like valleys, depending on how the data is displayed. Often the data are labeled with an arrow that says "endo" to tell you which direction along the y-axis means more heat is flowing in (or possibly "exo", meaning which direction means heat is flowing out). You need to look carefully if things seem backward.
Problem CP4.1.
For each DSC trace, state what sort of transition is occurring at what temperature.

Why does the glass transition temperature vary from one kind of polymer to another? What structural factors influence the glass transition temperature? This structure-property relationship isn't a straightforward one, as there seem to be a number of different variables involved. However, the simplest of these factors is just molecular weight. The higher the molecular weight of a polymer, the higher its glass transition temperature. This relationship is true only up to a certain point, however. The non-linear dependence of the glass transition temperature of molecular weight is described by the Flory-Fox equation:
\[T_g = T_{g(∞)} - \dfrac{K}{ M_n}\]
Here, Tg(∞) refers to the glass transition temperature of an infinitely long chain of the polymer. K is a constant for a particular polymer, such as polystyrene or polyethylene.
A plot of Tg vs. Mn resembles a saturation curve; the line rises sharply, gradually stalling out and continuing parallel to the x-axis. In other words, although this relationship of increasing glass transition temperature with increasing molecular weight holds true at relatively low molecular weights, the glass transition temperature remains constant once a threshold molecular weight has been reached.