6.5: NMR Theory and Experiment
- Page ID
- 359597

\( \newcommand{\vecs}[1]{\overset { \scriptstyle \rightharpoonup} {\mathbf{#1}} } \)
\( \newcommand{\vecd}[1]{\overset{-\!-\!\rightharpoonup}{\vphantom{a}\smash {#1}}} \)
\( \newcommand{\id}{\mathrm{id}}\) \( \newcommand{\Span}{\mathrm{span}}\)
( \newcommand{\kernel}{\mathrm{null}\,}\) \( \newcommand{\range}{\mathrm{range}\,}\)
\( \newcommand{\RealPart}{\mathrm{Re}}\) \( \newcommand{\ImaginaryPart}{\mathrm{Im}}\)
\( \newcommand{\Argument}{\mathrm{Arg}}\) \( \newcommand{\norm}[1]{\| #1 \|}\)
\( \newcommand{\inner}[2]{\langle #1, #2 \rangle}\)
\( \newcommand{\Span}{\mathrm{span}}\)
\( \newcommand{\id}{\mathrm{id}}\)
\( \newcommand{\Span}{\mathrm{span}}\)
\( \newcommand{\kernel}{\mathrm{null}\,}\)
\( \newcommand{\range}{\mathrm{range}\,}\)
\( \newcommand{\RealPart}{\mathrm{Re}}\)
\( \newcommand{\ImaginaryPart}{\mathrm{Im}}\)
\( \newcommand{\Argument}{\mathrm{Arg}}\)
\( \newcommand{\norm}[1]{\| #1 \|}\)
\( \newcommand{\inner}[2]{\langle #1, #2 \rangle}\)
\( \newcommand{\Span}{\mathrm{span}}\) \( \newcommand{\AA}{\unicode[.8,0]{x212B}}\)
\( \newcommand{\vectorA}[1]{\vec{#1}} % arrow\)
\( \newcommand{\vectorAt}[1]{\vec{\text{#1}}} % arrow\)
\( \newcommand{\vectorB}[1]{\overset { \scriptstyle \rightharpoonup} {\mathbf{#1}} } \)
\( \newcommand{\vectorC}[1]{\textbf{#1}} \)
\( \newcommand{\vectorD}[1]{\overrightarrow{#1}} \)
\( \newcommand{\vectorDt}[1]{\overrightarrow{\text{#1}}} \)
\( \newcommand{\vectE}[1]{\overset{-\!-\!\rightharpoonup}{\vphantom{a}\smash{\mathbf {#1}}}} \)
\( \newcommand{\vecs}[1]{\overset { \scriptstyle \rightharpoonup} {\mathbf{#1}} } \)
\( \newcommand{\vecd}[1]{\overset{-\!-\!\rightharpoonup}{\vphantom{a}\smash {#1}}} \)
\(\newcommand{\avec}{\mathbf a}\) \(\newcommand{\bvec}{\mathbf b}\) \(\newcommand{\cvec}{\mathbf c}\) \(\newcommand{\dvec}{\mathbf d}\) \(\newcommand{\dtil}{\widetilde{\mathbf d}}\) \(\newcommand{\evec}{\mathbf e}\) \(\newcommand{\fvec}{\mathbf f}\) \(\newcommand{\nvec}{\mathbf n}\) \(\newcommand{\pvec}{\mathbf p}\) \(\newcommand{\qvec}{\mathbf q}\) \(\newcommand{\svec}{\mathbf s}\) \(\newcommand{\tvec}{\mathbf t}\) \(\newcommand{\uvec}{\mathbf u}\) \(\newcommand{\vvec}{\mathbf v}\) \(\newcommand{\wvec}{\mathbf w}\) \(\newcommand{\xvec}{\mathbf x}\) \(\newcommand{\yvec}{\mathbf y}\) \(\newcommand{\zvec}{\mathbf z}\) \(\newcommand{\rvec}{\mathbf r}\) \(\newcommand{\mvec}{\mathbf m}\) \(\newcommand{\zerovec}{\mathbf 0}\) \(\newcommand{\onevec}{\mathbf 1}\) \(\newcommand{\real}{\mathbb R}\) \(\newcommand{\twovec}[2]{\left[\begin{array}{r}#1 \\ #2 \end{array}\right]}\) \(\newcommand{\ctwovec}[2]{\left[\begin{array}{c}#1 \\ #2 \end{array}\right]}\) \(\newcommand{\threevec}[3]{\left[\begin{array}{r}#1 \\ #2 \\ #3 \end{array}\right]}\) \(\newcommand{\cthreevec}[3]{\left[\begin{array}{c}#1 \\ #2 \\ #3 \end{array}\right]}\) \(\newcommand{\fourvec}[4]{\left[\begin{array}{r}#1 \\ #2 \\ #3 \\ #4 \end{array}\right]}\) \(\newcommand{\cfourvec}[4]{\left[\begin{array}{c}#1 \\ #2 \\ #3 \\ #4 \end{array}\right]}\) \(\newcommand{\fivevec}[5]{\left[\begin{array}{r}#1 \\ #2 \\ #3 \\ #4 \\ #5 \\ \end{array}\right]}\) \(\newcommand{\cfivevec}[5]{\left[\begin{array}{c}#1 \\ #2 \\ #3 \\ #4 \\ #5 \\ \end{array}\right]}\) \(\newcommand{\mattwo}[4]{\left[\begin{array}{rr}#1 \amp #2 \\ #3 \amp #4 \\ \end{array}\right]}\) \(\newcommand{\laspan}[1]{\text{Span}\{#1\}}\) \(\newcommand{\bcal}{\cal B}\) \(\newcommand{\ccal}{\cal C}\) \(\newcommand{\scal}{\cal S}\) \(\newcommand{\wcal}{\cal W}\) \(\newcommand{\ecal}{\cal E}\) \(\newcommand{\coords}[2]{\left\{#1\right\}_{#2}}\) \(\newcommand{\gray}[1]{\color{gray}{#1}}\) \(\newcommand{\lgray}[1]{\color{lightgray}{#1}}\) \(\newcommand{\rank}{\operatorname{rank}}\) \(\newcommand{\row}{\text{Row}}\) \(\newcommand{\col}{\text{Col}}\) \(\renewcommand{\row}{\text{Row}}\) \(\newcommand{\nul}{\text{Nul}}\) \(\newcommand{\var}{\text{Var}}\) \(\newcommand{\corr}{\text{corr}}\) \(\newcommand{\len}[1]{\left|#1\right|}\) \(\newcommand{\bbar}{\overline{\bvec}}\) \(\newcommand{\bhat}{\widehat{\bvec}}\) \(\newcommand{\bperp}{\bvec^\perp}\) \(\newcommand{\xhat}{\widehat{\xvec}}\) \(\newcommand{\vhat}{\widehat{\vvec}}\) \(\newcommand{\uhat}{\widehat{\uvec}}\) \(\newcommand{\what}{\widehat{\wvec}}\) \(\newcommand{\Sighat}{\widehat{\Sigma}}\) \(\newcommand{\lt}{<}\) \(\newcommand{\gt}{>}\) \(\newcommand{\amp}{&}\) \(\definecolor{fillinmathshade}{gray}{0.9}\)37
Although the other techniques provide valuable information about a molecule, they do not tell us what about the overall molecular structure, or the framework about C-C and C-H bonds. Nuclear magnetic resonance (NMR) spectroscopy is an immensely powerful analytical technique that provides such information. NMR works by the same principles as an Magnetic Resonance Imaging (MRI) scanner in a hospital. MRI is a scanning technique to detect the hidden medical problems without causing any harm of pain to the patient. While doctors use MRI peer inside the human body, we will see how NMR allows organic chemists to piece together, atom by atom and bond by bond, the structure of an organic molecule.
NMR-active Nuclei
The basis for NMR is the phenomenon that some atomic nuclei spin about their axes and as a result generate their own magnetic field, or magnetic moment, therefore these nuclei are called NMR-active. Not all nuclei have a magnetic moment though, only those nuclei with an odd number of proton and/or neutron have. Fortunately nuclei that are important for organic compounds, such as the 1H isotope of hydrogen, the 13C isotope of carbon, the 14N isotope of nitrogen, 19F and the 31P are all NMR-active and therefore can be observed by NMR. Other nuclei, such as the common 12C isotopes of carbon and 16O isotope of oxygen, do not have magnetic moments, and cannot be directly observed by NMR.

In practice, the 1H and 13C nuclei are most commonly observed by NMR spectroscopy, and we will focus on these techniques in this chapter, beginning with 1H NMR. 1H NMR is usually called proton NMR, because the nucleus of 1H atom is actually a single proton. The name of ‘proton’ and ‘hydrogen’ will be used interchangeably in this chapter for 1H NMR purpose.
Spin State and Magnetic Resonance
We will take proton, the nucleus of 1H atom, as an example for the discussions here.
When a sample of an organic compound is sitting in a flask on a laboratory bench, the magnetic moments of all of its protons are oriented randomly. However, when the same sample is placed within the field of a strong magnet in an NMR instrument (this field is referred to as the applied external magnetic field, B0, in NMR), each proton will assume one of two possible orientations with respect to the external magnetic field. These two orientations corresponds to the two spin states that can be labelled as α and β. In the α spin state, the proton’s magnetic moment is aligned with the direction of external magnetic field B0, while in the β spin state it is aligned opposed to the direction of B0 (Fig. 6.5b).
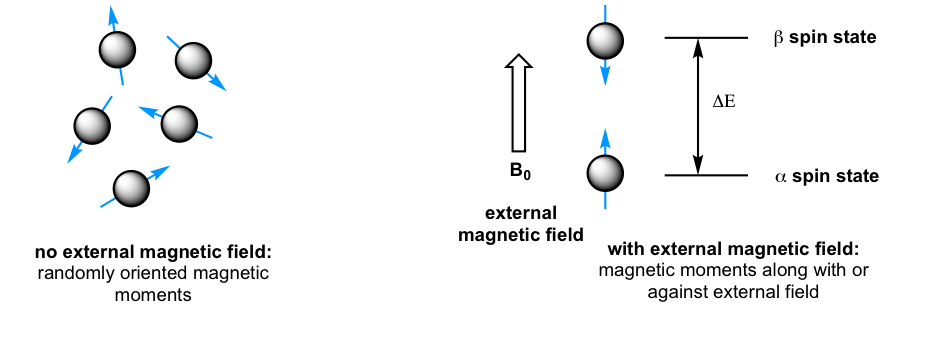
The α spin state is slightly lower in energy than the β state, and the energy gap between them, ΔE, depends upon the strength of B0: a stronger applied external magnetic field results in a larger ΔE. For a large population of organic molecules in an external magnetic field, slightly more than half of the protons will occupy the lower energy α spin state, while slightly less than half will occupy the higher energy β spin state. It is this population difference between the two spin states that is exploited by NMR, and the difference increases with the strength of the applied magnetic field B0.
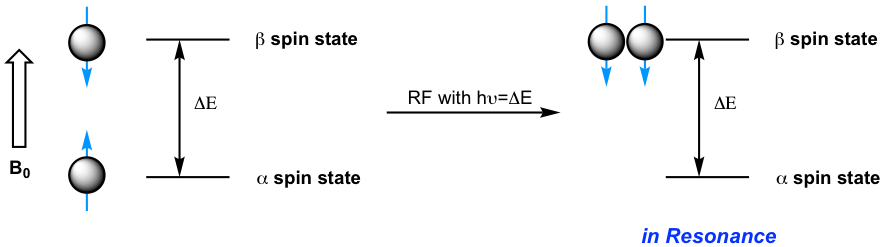
Energy is required to excite the proton from the lower energy state (α spin state) to the higher energy state (β spin state). In an NMR spectrometer the energy is supplied by electromagnetic radiation in the radio frequency (RF) region. When a proton in an external magnetic field is exposed to RF radiation with the energy that matches the energy gap ΔE, the energy of the RF is absorbed and the proton will flip its magnetic moment from the lower energy state (α spin state) to the higher energy state (β spin state), the nuclei are said to be in resonance with the electromagnetic radiation.
The frequency of radiation absorbed by a proton (or any other nucleus) during a spin transition in the NMR experiment is called its resonance frequency, ν. As a result, the resonance frequency also depends on B0, the larger B0 the higher resonance frequency, and the relationship fits to the specific formula: (Formula 6.4 is for your information purpose only)
 γ is the magnetogyric (or gyromagnetic) ratio, different nucleus has different value of γ. For a proton, the γ value is 26.753 rad · s -1 · tesla -1 .
Calculations indicate that if external magnetic field B0≅1.41 Tesla, the energy difference corresponds to RF with the frequency of 60×106 Hz (60 MHz) for proton; when B0≅7.04 Tesla, the corresponding RF frequency is 300×106 Hz (300 MHz) for proton. This frequency is the most important parameter for a NMR spectrometer (the instrument that run NMR experiments), the higher the frequency, the more sensitive the instrument and the higher resolution the resulting NMR spectrum is.
The NMR Experiment
In this book we will just explain how the NMR experiment and NMR spectrometer work in a simplified way (again with proton as an example), the full version is out of the scope of this course.
When a sample of compound is placed in the strong applied external magnetic field B0 of the instrument, the protons begin to spin with one of the two spin states. Initially, slightly more than half of the protons have the magnetic moments in aspin states (aligned with B0), and slightly less than half are in bspin states (aligned against B0). Then, the sample is exposed to a range of radio frequencies. Out of all of the frequencies which hit the sample, only the frequencies that matches the resonance frequency of the protons are absorbed, causing those protons which are aligned with B0 to ‘spin flip’ so that they align themselves against B0. When the ‘flipped’ protons flip back down to their ground state, they emit energy, again in the form of radio-frequency radiation. The NMR instrument detects and records the frequency and intensity of this radiation by making using of a mathematical technique known as a Fourier transform (FT). Fourier Transform convert the signal from a time versus amplitude signals to a frequency versus amplitude signals, that is what we observe in a NMR spectrum.

Most modern FT-NMR spectrometers use superconducting magnets that have very high magnetic fields, therefore operate with high resonance frequency from 100 MHz to 800 MHz. Superconducting magnets operate in a bath of liquid nitrogen or liquid helium at very low temperature.

Despite the powerfulness and high resolution of the high frequency NMR spectrometers, it is very costly for purchase and maintenance of the instrument. For teaching purpose, the bench top NMR are becoming more and more popular recently. The frequency of bench top NMR are usually in the range of 60-90 MHz, however, they can provide spectra with good resolution for lots basic organic structures that are used for undergraduate organic chemistry class. With the low-cost bench top NMR available, students have chance to gain hand-on NMR experiences in sample preparation, instrument operation and spectrum processing.
Shielding and Deshielding
If all hydrogen atoms (and protons) in organic molecules had the same resonance frequency, then they all show the same signal, NMR spectroscopy would not be that useful for chemists. Fortunately, however, resonance frequencies are different for different protons in a molecule. Specifically, the resonance frequency varies according to the electronic environment that a given proton inhabits.
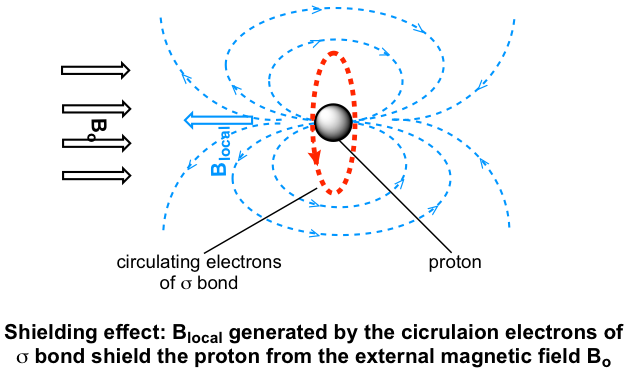
For hydrogen atoms in any bonds, such as C-H, O-H etc, the external magnetic field B0 causes the s electrons to circulate in a way that generate an induced local magnetic field (Blocal) at the proton, and the direction of the local field Blocal is opposite to the external field B0. The proton thus experiences a net magnetic field, which is called Beff, that is smaller than the applied magnetic field:
Beff= B0 – Blocal
As a result, the proton responses to a lower frequency (resonance frequency is proportional to the magnetic field as mentioned early). This Blocal, to a small but significant degree, shield the proton from experiencing the full force of B0, so this effect is called shielding effect. Different hydrogen atoms in organic structures are in different electronic environment, have different selectron density, therefore have different Blocal and different Beff as well. That is why different hydrogens (and protons) are in different resonance frequency and show different signals in the spectrum.
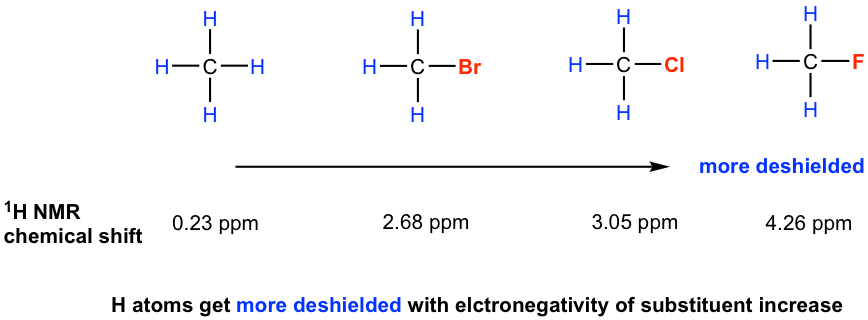
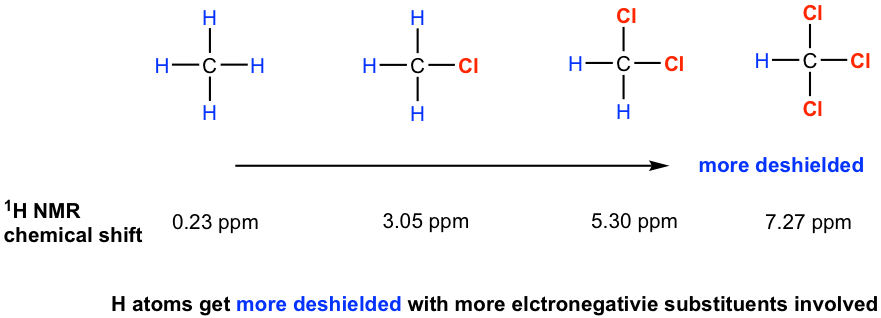
For hydrogen atoms close to electronegative groups, electronegative groups withdraw electron density from nearby atoms, so diminishing the shielding of the protons by circulating electrons. The hydrogen atoms near an electronegative groups are said to be deshielded from the external magnetic field, and have a higher resonance frequency than those shielded protons. As the electronegativity of the substituent increase, so does the extent of the deshielding effect (and so the chemical shift, see section 6.6.2 for more discussions about chemical shift) as shown in the examples below.