14.7: Structure Determination in Conjugated Systems - Ultraviolet Spectroscopy
- Page ID
- 31555
\( \newcommand{\vecs}[1]{\overset { \scriptstyle \rightharpoonup} {\mathbf{#1}} } \)
\( \newcommand{\vecd}[1]{\overset{-\!-\!\rightharpoonup}{\vphantom{a}\smash {#1}}} \)
\( \newcommand{\id}{\mathrm{id}}\) \( \newcommand{\Span}{\mathrm{span}}\)
( \newcommand{\kernel}{\mathrm{null}\,}\) \( \newcommand{\range}{\mathrm{range}\,}\)
\( \newcommand{\RealPart}{\mathrm{Re}}\) \( \newcommand{\ImaginaryPart}{\mathrm{Im}}\)
\( \newcommand{\Argument}{\mathrm{Arg}}\) \( \newcommand{\norm}[1]{\| #1 \|}\)
\( \newcommand{\inner}[2]{\langle #1, #2 \rangle}\)
\( \newcommand{\Span}{\mathrm{span}}\)
\( \newcommand{\id}{\mathrm{id}}\)
\( \newcommand{\Span}{\mathrm{span}}\)
\( \newcommand{\kernel}{\mathrm{null}\,}\)
\( \newcommand{\range}{\mathrm{range}\,}\)
\( \newcommand{\RealPart}{\mathrm{Re}}\)
\( \newcommand{\ImaginaryPart}{\mathrm{Im}}\)
\( \newcommand{\Argument}{\mathrm{Arg}}\)
\( \newcommand{\norm}[1]{\| #1 \|}\)
\( \newcommand{\inner}[2]{\langle #1, #2 \rangle}\)
\( \newcommand{\Span}{\mathrm{span}}\) \( \newcommand{\AA}{\unicode[.8,0]{x212B}}\)
\( \newcommand{\vectorA}[1]{\vec{#1}} % arrow\)
\( \newcommand{\vectorAt}[1]{\vec{\text{#1}}} % arrow\)
\( \newcommand{\vectorB}[1]{\overset { \scriptstyle \rightharpoonup} {\mathbf{#1}} } \)
\( \newcommand{\vectorC}[1]{\textbf{#1}} \)
\( \newcommand{\vectorD}[1]{\overrightarrow{#1}} \)
\( \newcommand{\vectorDt}[1]{\overrightarrow{\text{#1}}} \)
\( \newcommand{\vectE}[1]{\overset{-\!-\!\rightharpoonup}{\vphantom{a}\smash{\mathbf {#1}}}} \)
\( \newcommand{\vecs}[1]{\overset { \scriptstyle \rightharpoonup} {\mathbf{#1}} } \)
\( \newcommand{\vecd}[1]{\overset{-\!-\!\rightharpoonup}{\vphantom{a}\smash {#1}}} \)
\(\newcommand{\avec}{\mathbf a}\) \(\newcommand{\bvec}{\mathbf b}\) \(\newcommand{\cvec}{\mathbf c}\) \(\newcommand{\dvec}{\mathbf d}\) \(\newcommand{\dtil}{\widetilde{\mathbf d}}\) \(\newcommand{\evec}{\mathbf e}\) \(\newcommand{\fvec}{\mathbf f}\) \(\newcommand{\nvec}{\mathbf n}\) \(\newcommand{\pvec}{\mathbf p}\) \(\newcommand{\qvec}{\mathbf q}\) \(\newcommand{\svec}{\mathbf s}\) \(\newcommand{\tvec}{\mathbf t}\) \(\newcommand{\uvec}{\mathbf u}\) \(\newcommand{\vvec}{\mathbf v}\) \(\newcommand{\wvec}{\mathbf w}\) \(\newcommand{\xvec}{\mathbf x}\) \(\newcommand{\yvec}{\mathbf y}\) \(\newcommand{\zvec}{\mathbf z}\) \(\newcommand{\rvec}{\mathbf r}\) \(\newcommand{\mvec}{\mathbf m}\) \(\newcommand{\zerovec}{\mathbf 0}\) \(\newcommand{\onevec}{\mathbf 1}\) \(\newcommand{\real}{\mathbb R}\) \(\newcommand{\twovec}[2]{\left[\begin{array}{r}#1 \\ #2 \end{array}\right]}\) \(\newcommand{\ctwovec}[2]{\left[\begin{array}{c}#1 \\ #2 \end{array}\right]}\) \(\newcommand{\threevec}[3]{\left[\begin{array}{r}#1 \\ #2 \\ #3 \end{array}\right]}\) \(\newcommand{\cthreevec}[3]{\left[\begin{array}{c}#1 \\ #2 \\ #3 \end{array}\right]}\) \(\newcommand{\fourvec}[4]{\left[\begin{array}{r}#1 \\ #2 \\ #3 \\ #4 \end{array}\right]}\) \(\newcommand{\cfourvec}[4]{\left[\begin{array}{c}#1 \\ #2 \\ #3 \\ #4 \end{array}\right]}\) \(\newcommand{\fivevec}[5]{\left[\begin{array}{r}#1 \\ #2 \\ #3 \\ #4 \\ #5 \\ \end{array}\right]}\) \(\newcommand{\cfivevec}[5]{\left[\begin{array}{c}#1 \\ #2 \\ #3 \\ #4 \\ #5 \\ \end{array}\right]}\) \(\newcommand{\mattwo}[4]{\left[\begin{array}{rr}#1 \amp #2 \\ #3 \amp #4 \\ \end{array}\right]}\) \(\newcommand{\laspan}[1]{\text{Span}\{#1\}}\) \(\newcommand{\bcal}{\cal B}\) \(\newcommand{\ccal}{\cal C}\) \(\newcommand{\scal}{\cal S}\) \(\newcommand{\wcal}{\cal W}\) \(\newcommand{\ecal}{\cal E}\) \(\newcommand{\coords}[2]{\left\{#1\right\}_{#2}}\) \(\newcommand{\gray}[1]{\color{gray}{#1}}\) \(\newcommand{\lgray}[1]{\color{lightgray}{#1}}\) \(\newcommand{\rank}{\operatorname{rank}}\) \(\newcommand{\row}{\text{Row}}\) \(\newcommand{\col}{\text{Col}}\) \(\renewcommand{\row}{\text{Row}}\) \(\newcommand{\nul}{\text{Nul}}\) \(\newcommand{\var}{\text{Var}}\) \(\newcommand{\corr}{\text{corr}}\) \(\newcommand{\len}[1]{\left|#1\right|}\) \(\newcommand{\bbar}{\overline{\bvec}}\) \(\newcommand{\bhat}{\widehat{\bvec}}\) \(\newcommand{\bperp}{\bvec^\perp}\) \(\newcommand{\xhat}{\widehat{\xvec}}\) \(\newcommand{\vhat}{\widehat{\vvec}}\) \(\newcommand{\uhat}{\widehat{\uvec}}\) \(\newcommand{\what}{\widehat{\wvec}}\) \(\newcommand{\Sighat}{\widehat{\Sigma}}\) \(\newcommand{\lt}{<}\) \(\newcommand{\gt}{>}\) \(\newcommand{\amp}{&}\) \(\definecolor{fillinmathshade}{gray}{0.9}\)After completing this section, you should be able to
- identify the ultraviolet region of the electromagnetic spectrum which is of most use to organic chemists.
- interpret the ultraviolet spectrum of 1,3-butadiene in terms of the molecular orbitals involved.
- describe in general terms how the ultraviolet spectrum of a compound differs from its infrared and NMR spectra.
Make certain that you can define, and use in context, the key term below.
- ultraviolet (UV) spectroscopy
- Molar absorptivity
Ultraviolet spectroscopy provides much less information about the structure of molecules than do the spectroscopic techniques studied earlier (infrared spectroscopy, mass spectroscopy, and NMR spectroscopy). Thus, your study of this technique will be restricted to a brief overview. You should, however, note that for an organic chemist, the most useful ultraviolet region of the electromagnetic spectrum is that in which the radiation has a wavelength of between 200 and 400 nm.
UV-Visible Absorption Spectra
To understand why some compounds are colored and others are not, and to determine the relationship of conjugation to color, we must make accurate measurements of light absorption at different wavelengths in and near the visible part of the spectrum. Commercial optical spectrometers enable such experiments to be conducted with ease, and usually survey both the near ultraviolet and visible portions of the spectrum. Ultraviolet-visible absorption spectroscopy provides much less information about the structure of molecules than do the spectroscopic techniques studied earlier (infrared spectroscopy, mass spectroscopy, and NMR spectroscopy) and mainly provides information about conjugated pi systems. For an organic chemist the most useful ultraviolet region of the electromagnetic spectrum involves radiation with a wavelength between 200 and 400 nm. UV/Vis absorption spectra also involve radiation from the visible region of the electromagnetic spectrum with wavelengths between 400 and 800 nm.
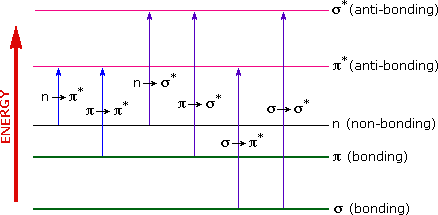
A diagram highlighting the various kinds of electronic excitation that may occur in organic molecules is shown below. Of the six transitions outlined, only the two lowest energy ones, n to pi* and pi to pi* (colored blue) are achieved by the energies available in the 200 to 800 nm range of a UV/VIs spectrum. These energies are sufficient to promote or excite a molecular electron to a higher energy orbital in many conjugated compounds.

When sample molecules are exposed to light having an energy that matches a possible electronic transition within the molecule, some of the light energy will be absorbed as the electron is promoted to a higher energy orbital. A UV/Vis spectrometer records the wavelengths at which absorption occurs, together with the degree of absorption at each wavelength. Absorbance, abbreviated 'A', is a unitless number which contains the same information as the 'percent transmittance' number used in IR spectroscopy. To calculate absorbance at a given wavelength, the computer in the spectrophotometer simply takes the intensity of light at that wavelength before it passes through the sample (I0), divides this value by the intensity of the same wavelength after it passes through the sample (I), then takes the log10 of that number:
\[A = \log \left (\dfrac{I_0}{I} \right) \nonumber \]
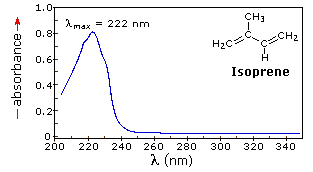
The resulting spectrum is presented as a graph of absorbance (A) versus wavelength, as in the isoprene spectrum shown below. Since isoprene is colorless, it does not absorb in the visible part of the spectrum and this region is not displayed on the graph. Notice that the convention in UV-vis spectroscopy is to show the baseline at the bottom of the graph with the peaks pointing up. Wavelength values on the x-axis are generally measured in nanometers (nm) rather than in cm-1 as is the convention in IR spectroscopy.
Typically, there are two things that are noted and recorded from a UV-Vis spectrum. The first is λmax, which is the wavelength at maximal light absorbance. As you can see, isoprene has λmax, = 222 nm. The second valuable piece of data is the absorbance at the λmax. In the isoprene spectrum the absorbance at the value λmax of 222 nm is about 0.8.

Molar absorptivity
Molar absorptivity (\(epsilon\)) is a physical constant, characteristic of the particular substance being observed and thus characteristic of the particular
\[\epsilon = \dfrac{A}{c\; l} \nonumber \]
where
- \(A\) is the sample absorbance
- \(c\) is the sample concentration in moles/liter
- \(l\) is the length of light path through the sample in cm
If the isoprene spectrum show above was obtained from a dilute hexane solution (c = 4 * 10-5 moles per liter) in a 1 cm sample cuvette, a simple calculation using the above formula indicates a molar absorptivity of 20,000 at the maximum absorption wavelength, symbolized as \(λ_{max}\).
The only molecular moieties likely to absorb light in the 200 to 800 nm region are functional groups that contain pi-electrons and hetero atoms having non-bonding valence-shell electron pairs. Such light absorbing groups are referred to as chromophores. A list of some simple chromophores and their light absorption characteristics are provided below. The oxygen non-bonding electrons in alcohols and ethers do not give rise to absorption above 160 nm. Consequently, pure alcohol and ether solvents may be used for spectroscopic studies.
| Chromophore | Example | Excitation | λmax, nm | ε @ λmax | Solvent |
|---|---|---|---|---|---|
| C=C | Ethene | π → π* | 171 | 15,000 | hexane |
| C≡C | 1-Hexyne | π → π* | 180 | 10,000 | hexane |
| C=O | Ethanal | n → π* π → π* |
290 180 |
15 10,000 |
hexane hexane |
| N=O | Nitromethane |
n → π* |
275 200 |
17 5,000 |
ethanol ethanol |
| C-X X=Br X=I |
Methyl bromide Methyl Iodide |
n → σ* |
205 255 |
200 360 |
hexane hexane |
Electronic Transitions (cause of UV-Visible absorption)
As previously noted, electronic transitions in organic molecules lead to UV and visible absorption. As a rule, energetically favored electron promotion will be from the highest occupied molecular orbital (HOMO) to the lowest unoccupied molecular orbital (LUMO), and the resulting species is called an excited state. The molecular orbital picture for the hydrogen molecule (H2) consists of one bonding σ MO, and a higher energy antibonding σ* MO. When the molecule is in the ground state, both electrons are paired in the lower-energy bonding orbital – this is the Highest Occupied Molecular Orbital (HOMO). The antibonding σ* orbital, in turn, is the Lowest Unoccupied Molecular Orbital (LUMO).

If the molecule is exposed to light of a wavelength with energy equal to ΔE, the HOMO-LUMO energy gap, this wavelength will be absorbed and the energy used to bump one of the electrons from the HOMO to the LUMO – in other words, from the σ to the σ* orbital. This is referred to as a σ - σ* transition. ΔE for this electronic transition is 258 kcal/mol, corresponding to light with a wavelength of 111 nm.
When a double-bonded molecule such as ethene (common name ethylene) absorbs light, it undergoes a π - π* transition. Because π- π* energy gaps are narrower than σ - σ* gaps, ethene absorbs light at 165 nm - a longer wavelength than molecular hydrogen.

The electronic transitions of both molecular hydrogen and ethene are too energetic to be accurately recorded. Where electronic transition becomes useful to most organic and biological chemists is in the study of molecules with conjugated pi systems. In these groups, the energy gap for π -π* transitions is smaller than for isolated double bonds, and thus the wavelength absorbed is longer. The MO diagram for 1,3-butadiene, the simplest conjugated system. Recall that we can draw a diagram showing the four pi MO’s that result from combining the four 2pz atomic orbitals. The lower two orbitals are pi bonding, while the upper two are pi antibonding.

Comparing this MO picture to that of ethene, our isolated pi-bond example, we see that the HOMO-LUMO energy gap is indeed smaller for the conjugated system. 1,3-butadiene absorbs UV light with a wavelength of 217 nm.
As conjugated pi systems become larger, the energy gap for a π - π* transition becomes increasingly narrow, and the wavelength of light absorbed correspondingly becomes longer. The absorbance due to the π - π* transition in 1,3,5-hexatriene, for example, occurs at 258 nm, corresponding to a ΔE of 111 kcal/mol.

In molecules with extended pi systems, the HOMO-LUMO energy gap becomes so small that absorption occurs in the visible rather then the UV region of the electromagnetic spectrum. Beta-carotene, with its system of 11 conjugated double bonds, absorbs light with wavelengths in the blue region of the visible spectrum while allowing other visible wavelengths – mainly those in the red-yellow region - to be transmitted. This is why carrots are orange.

The conjugated pi system in 4-methyl-3-penten-2-one gives rise to a strong UV absorbance at 236 nm due to a π - π* transition. However, this molecule also absorbs at 314 nm. This second absorbance is due to the transition of a non-bonding (lone pair) electron on the oxygen up to a π* antibonding MO:

This is referred to as an \(n - π^*\) transition. The nonbonding (\(n\)) MO’s are higher in energy than the highest bonding p orbitals, so the energy gap for an \(n - π^* \) transition is smaller that that of a \(π - π^*\) transition – and thus the \(n - π^*\) peak is at a longer wavelength. In general, \(n - π^*\) transitions are weaker (less light absorbed) than those due to \(π - π^*\) transitions.
Use of UV/Vis Spectroscopy in Biological Systems
The bases of DNA and RNA are good chromophores:

Biochemists and molecular biologists often determine the concentration of a DNA sample by assuming an average value of ε = 0.020 ng-1×mL for double-stranded DNA at its λmax of 260 nm (notice that concentration in this application is expressed in mass/volume rather than molarity: ng/mL is often a convenient unit for DNA concentration when doing molecular biology).
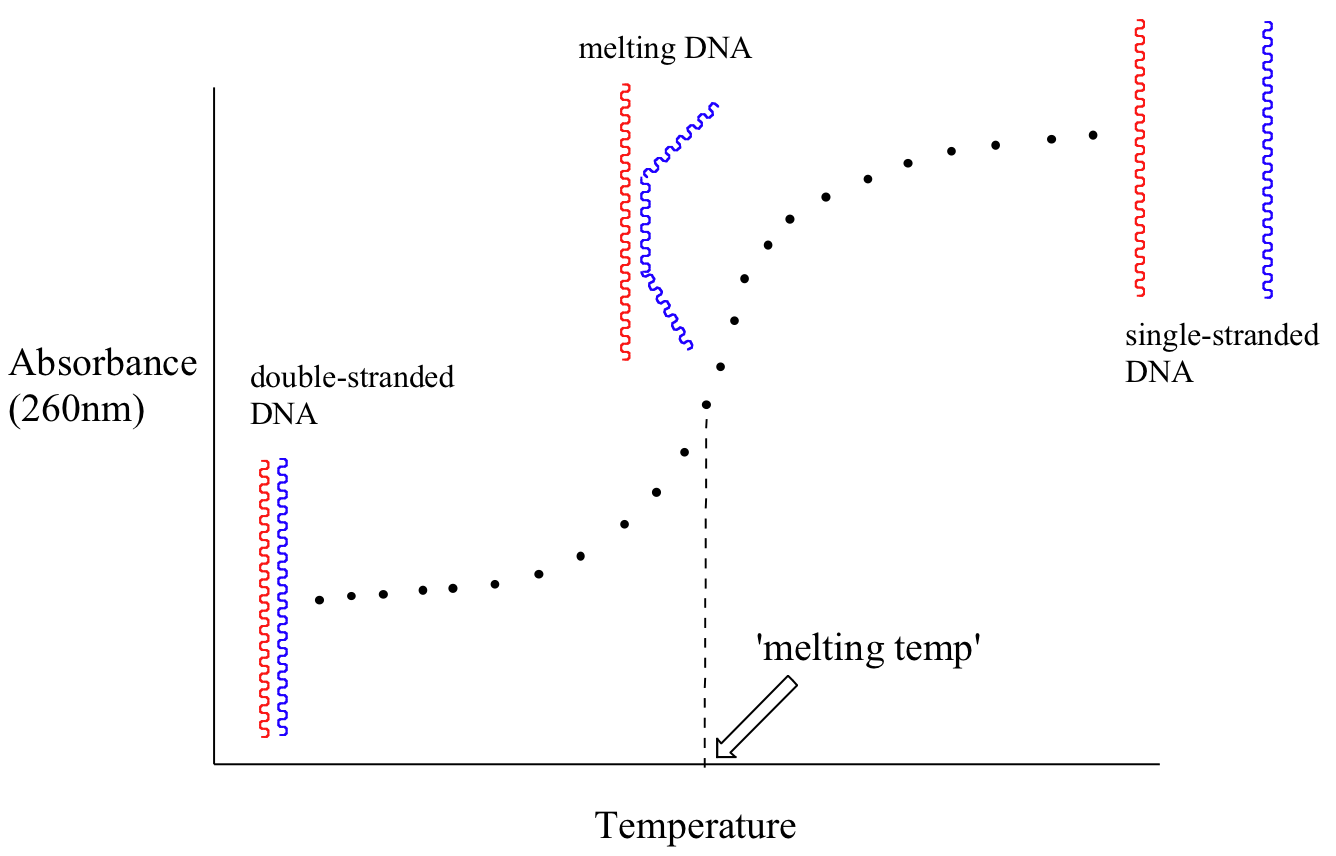
Because the extinction coefficient of double stranded DNA is slightly lower than that of single stranded DNA, we can use UV spectroscopy to monitor a process known as DNA melting. If a short stretch of double stranded DNA is gradually heated up, it will begin to ‘melt’, or break apart, as the temperature increases (recall that two strands of DNA are held together by a specific pattern of hydrogen bonds formed by ‘base-pairing’).

As melting proceeds, the absorbance value for the sample increases, eventually reaching a high plateau as all of the double-stranded DNA breaks apart, or ‘melts’. The mid-point of this process, called the ‘melting temperature’, provides a good indication of how tightly the two strands of DNA are able to bind to each other.
Later we will see how the Beer - Lambert Law and UV spectroscopy provides us with a convenient way to follow the progress of many different enzymatic redox (oxidation-reduction) reactions. In biochemistry, oxidation of an organic molecule often occurs concurrently with reduction of nicotinamide adenine dinucleotide (NAD+, the compound whose spectrum we saw earlier in this section) to NADH:

Both NAD+ and NADH absorb at 260 nm. However NADH, unlike NAD+, has a second absorbance band with λmax = 340 nm and ε = 6290 L*mol-1*cm-1. The figure below shows the spectra of both compounds superimposed, with the NADH spectrum offset slightly on the y-axis:

By monitoring the absorbance of a reaction mixture at 340 nm, we can 'watch' NADH being formed as the reaction proceeds, and calculate the rate of the reaction.
UV spectroscopy is also very useful in the study of proteins. Proteins absorb light in the UV range due to the presence of the aromatic amino acids tryptophan, phenylalanine, and tyrosine, all of which are chromophores.

Biochemists frequently use UV spectroscopy to study conformational changes in proteins - how they change shape in response to different conditions. When a protein undergoes a conformational shift (partial unfolding, for example), the resulting change in the environment around an aromatic amino acid chromophore can cause its UV spectrum to be altered.
- 50 microliters of an aqueous sample of double stranded DNA is dissolved in 950 microliters of water. This diluted solution has a maximal absorbance of 0.326 at 260 nm. What is the concentration of the original (more concentrated) DNA sample, expressed in micrograms per microliter?
- What is the energy range for 300 nm to 500 nm in the ultraviolet spectrum? How does this compare to energy values from NMR and IR spectroscopy?
- Identify all isolated and conjugated pi bonds in lycopene, the red-colored compound in tomatoes. How many pi electrons are contained in the conjugated pi system?

- Answer
-
1) Using ε = A/c, we plug in our values for ε and A and find that c = 3.27 x 10⁻⁵M, or 32.7 mM.
2)
E = hc/λ
E = (6.62 × 10⁻³⁴ Js)(3.00 × 10⁸ m/s)/(3.00 × 10−7 m)
E = 6.62 × 10⁻¹⁹ J
The range of 3.972 × 10⁻¹⁹ to 6.62 × 10⁻¹⁹ joules. This energy range is greater in energy than the in NMR and IR.
3)


