
14.15: Conjugated Dienes and Ultraviolet Light
- Page ID
- 31032
\( \newcommand{\vecs}[1]{\overset { \scriptstyle \rightharpoonup} {\mathbf{#1}} } \)
\( \newcommand{\vecd}[1]{\overset{-\!-\!\rightharpoonup}{\vphantom{a}\smash {#1}}} \)
\( \newcommand{\id}{\mathrm{id}}\) \( \newcommand{\Span}{\mathrm{span}}\)
( \newcommand{\kernel}{\mathrm{null}\,}\) \( \newcommand{\range}{\mathrm{range}\,}\)
\( \newcommand{\RealPart}{\mathrm{Re}}\) \( \newcommand{\ImaginaryPart}{\mathrm{Im}}\)
\( \newcommand{\Argument}{\mathrm{Arg}}\) \( \newcommand{\norm}[1]{\| #1 \|}\)
\( \newcommand{\inner}[2]{\langle #1, #2 \rangle}\)
\( \newcommand{\Span}{\mathrm{span}}\)
\( \newcommand{\id}{\mathrm{id}}\)
\( \newcommand{\Span}{\mathrm{span}}\)
\( \newcommand{\kernel}{\mathrm{null}\,}\)
\( \newcommand{\range}{\mathrm{range}\,}\)
\( \newcommand{\RealPart}{\mathrm{Re}}\)
\( \newcommand{\ImaginaryPart}{\mathrm{Im}}\)
\( \newcommand{\Argument}{\mathrm{Arg}}\)
\( \newcommand{\norm}[1]{\| #1 \|}\)
\( \newcommand{\inner}[2]{\langle #1, #2 \rangle}\)
\( \newcommand{\Span}{\mathrm{span}}\) \( \newcommand{\AA}{\unicode[.8,0]{x212B}}\)
\( \newcommand{\vectorA}[1]{\vec{#1}} % arrow\)
\( \newcommand{\vectorAt}[1]{\vec{\text{#1}}} % arrow\)
\( \newcommand{\vectorB}[1]{\overset { \scriptstyle \rightharpoonup} {\mathbf{#1}} } \)
\( \newcommand{\vectorC}[1]{\textbf{#1}} \)
\( \newcommand{\vectorD}[1]{\overrightarrow{#1}} \)
\( \newcommand{\vectorDt}[1]{\overrightarrow{\text{#1}}} \)
\( \newcommand{\vectE}[1]{\overset{-\!-\!\rightharpoonup}{\vphantom{a}\smash{\mathbf {#1}}}} \)
\( \newcommand{\vecs}[1]{\overset { \scriptstyle \rightharpoonup} {\mathbf{#1}} } \)
\( \newcommand{\vecd}[1]{\overset{-\!-\!\rightharpoonup}{\vphantom{a}\smash {#1}}} \)
\(\newcommand{\avec}{\mathbf a}\) \(\newcommand{\bvec}{\mathbf b}\) \(\newcommand{\cvec}{\mathbf c}\) \(\newcommand{\dvec}{\mathbf d}\) \(\newcommand{\dtil}{\widetilde{\mathbf d}}\) \(\newcommand{\evec}{\mathbf e}\) \(\newcommand{\fvec}{\mathbf f}\) \(\newcommand{\nvec}{\mathbf n}\) \(\newcommand{\pvec}{\mathbf p}\) \(\newcommand{\qvec}{\mathbf q}\) \(\newcommand{\svec}{\mathbf s}\) \(\newcommand{\tvec}{\mathbf t}\) \(\newcommand{\uvec}{\mathbf u}\) \(\newcommand{\vvec}{\mathbf v}\) \(\newcommand{\wvec}{\mathbf w}\) \(\newcommand{\xvec}{\mathbf x}\) \(\newcommand{\yvec}{\mathbf y}\) \(\newcommand{\zvec}{\mathbf z}\) \(\newcommand{\rvec}{\mathbf r}\) \(\newcommand{\mvec}{\mathbf m}\) \(\newcommand{\zerovec}{\mathbf 0}\) \(\newcommand{\onevec}{\mathbf 1}\) \(\newcommand{\real}{\mathbb R}\) \(\newcommand{\twovec}[2]{\left[\begin{array}{r}#1 \\ #2 \end{array}\right]}\) \(\newcommand{\ctwovec}[2]{\left[\begin{array}{c}#1 \\ #2 \end{array}\right]}\) \(\newcommand{\threevec}[3]{\left[\begin{array}{r}#1 \\ #2 \\ #3 \end{array}\right]}\) \(\newcommand{\cthreevec}[3]{\left[\begin{array}{c}#1 \\ #2 \\ #3 \end{array}\right]}\) \(\newcommand{\fourvec}[4]{\left[\begin{array}{r}#1 \\ #2 \\ #3 \\ #4 \end{array}\right]}\) \(\newcommand{\cfourvec}[4]{\left[\begin{array}{c}#1 \\ #2 \\ #3 \\ #4 \end{array}\right]}\) \(\newcommand{\fivevec}[5]{\left[\begin{array}{r}#1 \\ #2 \\ #3 \\ #4 \\ #5 \\ \end{array}\right]}\) \(\newcommand{\cfivevec}[5]{\left[\begin{array}{c}#1 \\ #2 \\ #3 \\ #4 \\ #5 \\ \end{array}\right]}\) \(\newcommand{\mattwo}[4]{\left[\begin{array}{rr}#1 \amp #2 \\ #3 \amp #4 \\ \end{array}\right]}\) \(\newcommand{\laspan}[1]{\text{Span}\{#1\}}\) \(\newcommand{\bcal}{\cal B}\) \(\newcommand{\ccal}{\cal C}\) \(\newcommand{\scal}{\cal S}\) \(\newcommand{\wcal}{\cal W}\) \(\newcommand{\ecal}{\cal E}\) \(\newcommand{\coords}[2]{\left\{#1\right\}_{#2}}\) \(\newcommand{\gray}[1]{\color{gray}{#1}}\) \(\newcommand{\lgray}[1]{\color{lightgray}{#1}}\) \(\newcommand{\rank}{\operatorname{rank}}\) \(\newcommand{\row}{\text{Row}}\) \(\newcommand{\col}{\text{Col}}\) \(\renewcommand{\row}{\text{Row}}\) \(\newcommand{\nul}{\text{Nul}}\) \(\newcommand{\var}{\text{Var}}\) \(\newcommand{\corr}{\text{corr}}\) \(\newcommand{\len}[1]{\left|#1\right|}\) \(\newcommand{\bbar}{\overline{\bvec}}\) \(\newcommand{\bhat}{\widehat{\bvec}}\) \(\newcommand{\bperp}{\bvec^\perp}\) \(\newcommand{\xhat}{\widehat{\xvec}}\) \(\newcommand{\vhat}{\widehat{\vvec}}\) \(\newcommand{\uhat}{\widehat{\uvec}}\) \(\newcommand{\what}{\widehat{\wvec}}\) \(\newcommand{\Sighat}{\widehat{\Sigma}}\) \(\newcommand{\lt}{<}\) \(\newcommand{\gt}{>}\) \(\newcommand{\amp}{&}\) \(\definecolor{fillinmathshade}{gray}{0.9}\)
- Violet: 400 - 420 nm
- Indigo: 420 - 440 nm
- Blue: 440 - 490 nm
- Green: 490 - 570 nm
- Yellow: 570 - 585 nm
- Orange: 585 - 620 nm
- Red: 620 - 780 nm
When white light passes through or is reflected by a colored substance, a characteristic portion of the mixed wavelengths is absorbed. The remaining light will then assume the complementary color to the wavelength(s) absorbed. This relationship is demonstrated by the color wheel shown below. Here, complementary colors are diametrically opposite each other. Thus, absorption of 420-430 nm light renders a substance yellow, and absorption of 500-520 nm light makes it red. Green is unique in that it can be created by absoption close to 400 nm as well as absorption near 800 nm.
Early humans valued colored pigments, and used them for decorative purposes. Many of these were inorganic minerals, but several important organic dyes were also known. These included the crimson pigment, kermesic acid, the blue dye, indigo, and the yellow saffron pigment, crocetin. A rare dibromo-indigo derivative, punicin, was used to color the robes of the royal and wealthy. The deep orange hydrocarbon carotene is widely distributed in plants, but is not sufficiently stable to be used as permanent pigment, other than for food coloring. A common feature of all these colored compounds, displayed below, is a system of extensively conjugated \(\pi\)-electrons.
The Electromagnetic Spectrum
The visible spectrum constitutes but a small part of the total radiation spectrum. Most of the radiation that surrounds us cannot be seen, but can be detected by dedicated sensing instruments. This electromagnetic spectrum ranges from very short wavelengths (including gamma and x-rays) to very long wavelengths (including microwaves and broadcast radio waves). The following chart displays many of the important regions of this spectrum, and demonstrates the inverse relationship between wavelength and frequency (shown in the top equation below the chart).
The energy associated with a given segment of the spectrum is proportional to its frequency. The bottom equation describes this relationship, which provides the energy carried by a photon of a given wavelength of radiation.

To obtain specific frequency, wavelength and energy values use this calculator.
UV-Visible Absorption Spectra
To understand why some compounds are colored and others are not, and to determine the relationship of conjugation to color, we must make accurate measurements of light absorption at different wavelengths in and near the visible part of the spectrum. Commercial optical spectrometers enable such experiments to be conducted with ease, and usually survey both the near ultraviolet and visible portions of the spectrum. For a description of a UV-Visible spectrometer Click Here.
The visible region of the spectrum comprises photon energies of 36 to 72 kcal/mole, and the near ultraviolet region, out to 200 nm, extends this energy range to 143 kcal/mole. Ultraviolet radiation having wavelengths less than 200 nm is difficult to handle, and is seldom used as a routine tool for structural analysis.
The energies noted above are sufficient to promote or excite a molecular electron to a higher energy orbital. Consequently, absorption spectroscopy carried out in this region is sometimes called "electronic spectroscopy". A diagram showing the various kinds of electronic excitation that may occur in organic molecules is shown on the left. Of the six transitions outlined, only the two lowest energy ones (left-most, colored blue) are achieved by the energies available in the 200 to 800 nm spectrum. As a rule, energetically favored electron promotion will be from the highest occupied molecular orbital (HOMO) to the lowest unoccupied molecular orbital (LUMO), and the resulting species is called an excited state. For a review of molecular orbitals click here.
When sample molecules are exposed to light having an energy that matches a possible electronic transition within the molecule, some of the light energy will be absorbed as the electron is promoted to a higher energy orbital. An optical spectrometer records the wavelengths at which absorption occurs, together with the degree of absorption at each wavelength. The resulting spectrum is presented as a graph of absorbance (A) versus wavelength, as in the isoprene spectrum shown below. Since isoprene is colorless, it does not absorb in the visible part of the spectrum and this region is not displayed on the graph. Absorbance usually ranges from 0 (no absorption) to 2 (99% absorption), and is precisely defined in context with spectrometer operation.
Electronic transitions
Let’s take as our first example the simple case of molecular hydrogen, H2. As you may recall from section 2.1A, the molecular orbital picture for the hydrogen molecule consists of one bonding σ MO, and a higher energy antibonding σ* MO. When the molecule is in the ground state, both electrons are paired in the lower-energy bonding orbital – this is the Highest Occupied Molecular Orbital (HOMO). The antibonding σ* orbital, in turn, is the Lowest Unoccupied Molecular Orbital (LUMO).
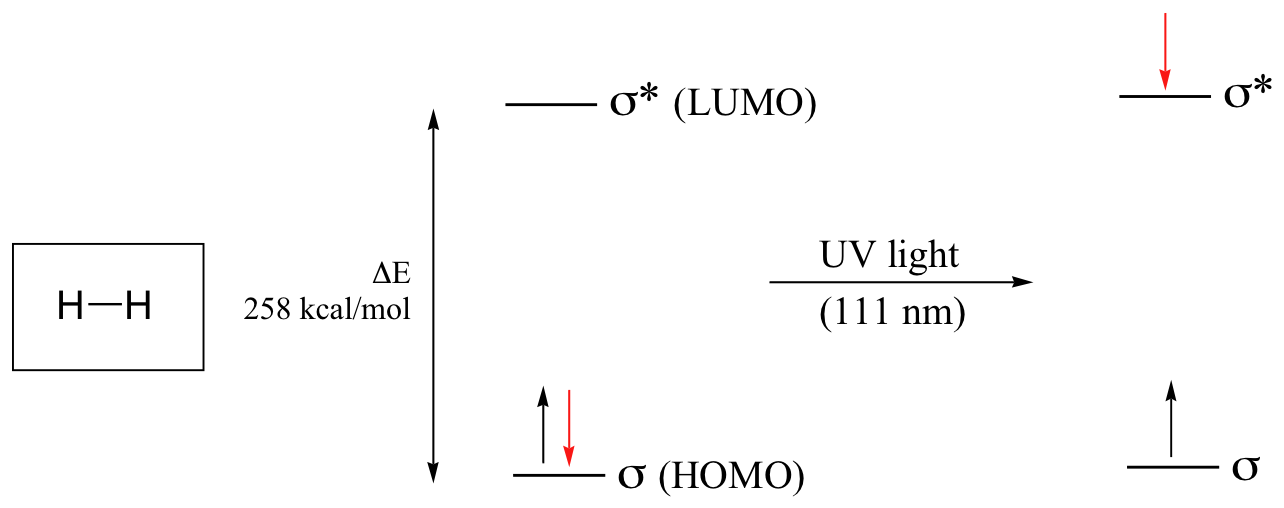
If the molecule is exposed to light of a wavelength with energy equal to ΔE, the HOMO-LUMO energy gap, this wavelength will be absorbed and the energy used to bump one of the electrons from the HOMO to the LUMO – in other words, from the σ to the σ* orbital. This is referred to as a σ - σ* transition. ΔE for this electronic transition is 258 kcal/mol, corresponding to light with a wavelength of 111 nm.
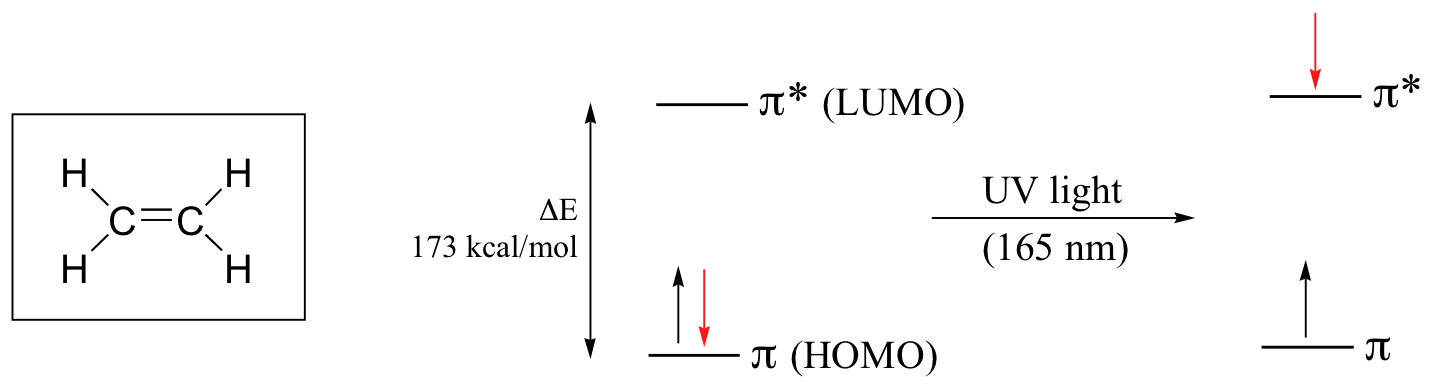
When a double-bonded molecule such as ethene (common name ethylene) absorbs light, it undergoes a π - π* transition. Because π- π* energy gaps are narrower than σ - σ* gaps, ethene absorbs light at 165 nm - a longer wavelength than molecular hydrogen.
The electronic transitions of both molecular hydrogen and ethene are too energetic to be accurately recorded by standard UV spectrophotometers, which generally have a range of 220 – 700 nm. Where UV-vis spectroscopy becomes useful to most organic and biological chemists is in the study of molecules with conjugated pi systems. In these groups, the energy gap for π -π* transitions is smaller than for isolated double bonds, and thus the wavelength absorbed is longer. Molecules or parts of molecules that absorb light strongly in the UV-vis region are called chromophores.
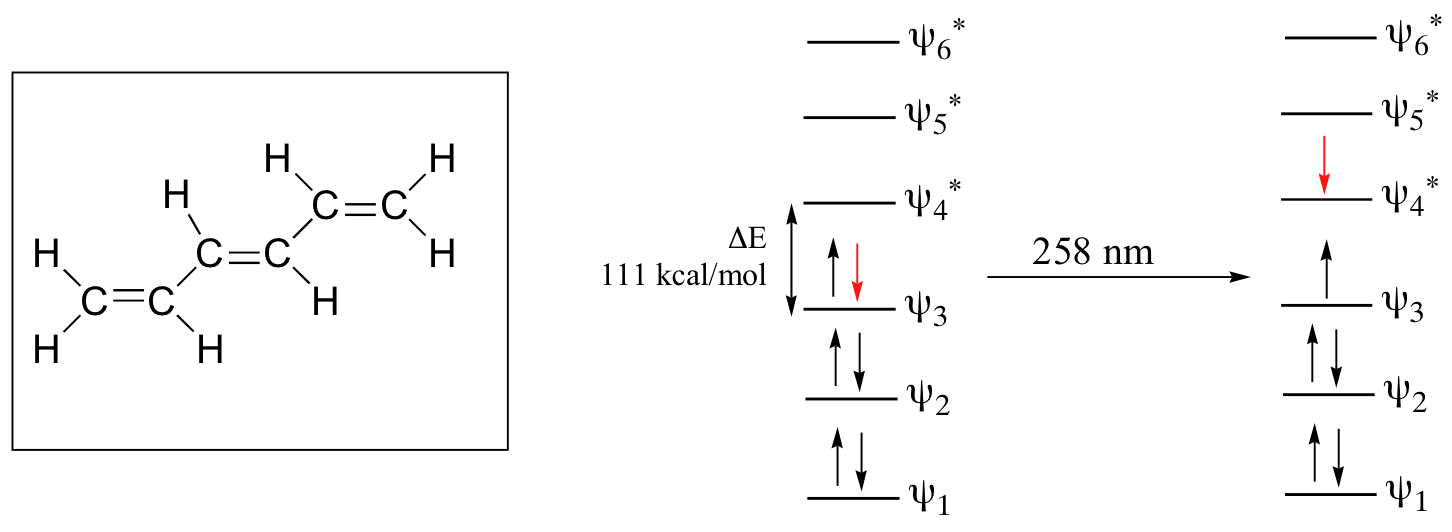
Let’s revisit the MO picture for 1,3-butadiene, the simplest conjugated system (see section 2.1B). Recall that we can draw a diagram showing the four pi MO’s that result from combining the four 2pz atomic orbitals. The lower two orbitals are bonding, while the upper two are antibonding.
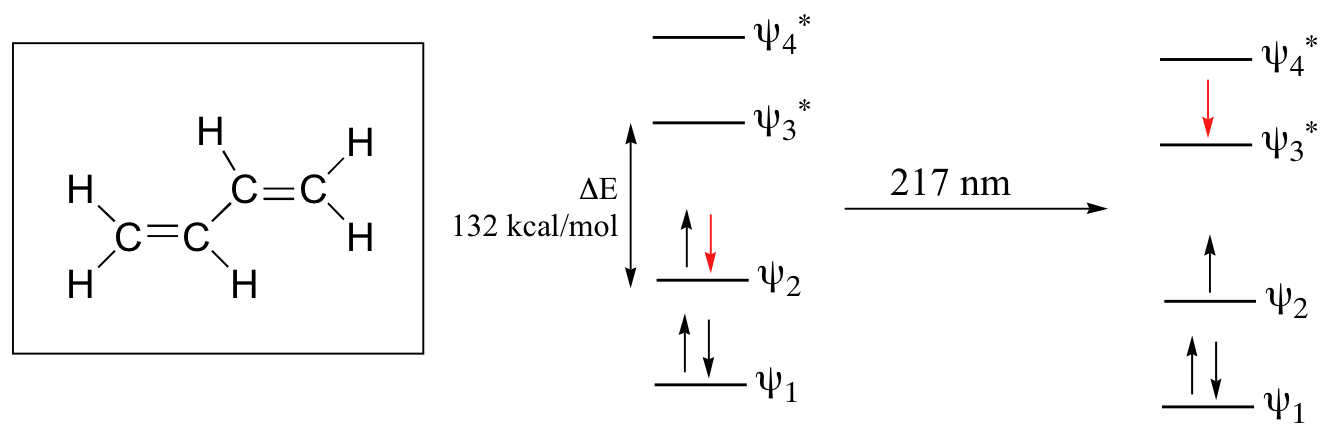
Comparing this MO picture to that of ethene, our isolated pi-bond example, we see that the HOMO-LUMO energy gap is indeed smaller for the conjugated system. 1,3-butadiene absorbs UV light with a wavelength of 217 nm.
As conjugated pi systems become larger, the energy gap for a π - π* transition becomes increasingly narrow, and the wavelength of light absorbed correspondingly becomes longer. The absorbance due to the π - π* transition in 1,3,5-hexatriene, for example, occurs at 258 nm, corresponding to a ΔE of 111 kcal/mol.
In molecules with extended pi systems, the HOMO-LUMO energy gap becomes so small that absorption occurs in the visible rather then the UV region of the electromagnetic spectrum. Beta-carotene, with its system of 11 conjugated double bonds, absorbs light with wavelengths in the blue region of the visible spectrum while allowing other visible wavelengths – mainly those in the red-yellow region - to be transmitted. This is why carrots are orange.

The conjugated pi system in 4-methyl-3-penten-2-one gives rise to a strong UV absorbance at 236 nm due to a π - π* transition. However, this molecule also absorbs at 314 nm. This second absorbance is due to the transition of a non-bonding (lone pair) electron on the oxygen up to a π* antibonding MO:
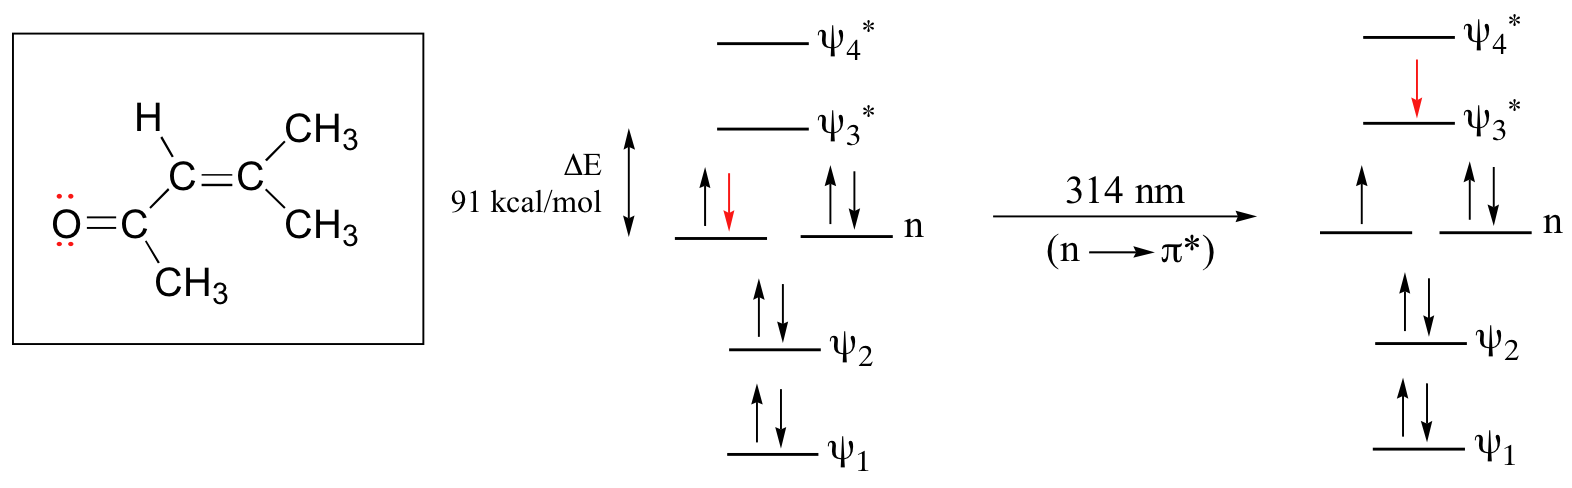
This is referred to as an n - π* transition. The nonbonding (n) MO’s are higher in energy than the highest bonding p orbitals, so the energy gap for an n - π* transition is smaller that that of a π - π* transition – and thus the n - π* peak is at a longer wavelength. In general, n - π* transitions are weaker (less light absorbed) than those due to π - π* transitions.
Exercise 4.3: How large is the π - π* transition in 4-methyl-3-penten-2-one?
Exercise 4.4: Which of the following molecules would you expect absorb at a longer wavelength in the UV region of the electromagnetic spectrum? Explain your answer.

William Reusch, Professor Emeritus (Michigan State U.), Virtual Textbook of Organic Chemistry