
5.9: Uses of Proton NMR Spectroscopy
- Page ID
- 432197
\( \newcommand{\vecs}[1]{\overset { \scriptstyle \rightharpoonup} {\mathbf{#1}} } \)
\( \newcommand{\vecd}[1]{\overset{-\!-\!\rightharpoonup}{\vphantom{a}\smash {#1}}} \)
\( \newcommand{\id}{\mathrm{id}}\) \( \newcommand{\Span}{\mathrm{span}}\)
( \newcommand{\kernel}{\mathrm{null}\,}\) \( \newcommand{\range}{\mathrm{range}\,}\)
\( \newcommand{\RealPart}{\mathrm{Re}}\) \( \newcommand{\ImaginaryPart}{\mathrm{Im}}\)
\( \newcommand{\Argument}{\mathrm{Arg}}\) \( \newcommand{\norm}[1]{\| #1 \|}\)
\( \newcommand{\inner}[2]{\langle #1, #2 \rangle}\)
\( \newcommand{\Span}{\mathrm{span}}\)
\( \newcommand{\id}{\mathrm{id}}\)
\( \newcommand{\Span}{\mathrm{span}}\)
\( \newcommand{\kernel}{\mathrm{null}\,}\)
\( \newcommand{\range}{\mathrm{range}\,}\)
\( \newcommand{\RealPart}{\mathrm{Re}}\)
\( \newcommand{\ImaginaryPart}{\mathrm{Im}}\)
\( \newcommand{\Argument}{\mathrm{Arg}}\)
\( \newcommand{\norm}[1]{\| #1 \|}\)
\( \newcommand{\inner}[2]{\langle #1, #2 \rangle}\)
\( \newcommand{\Span}{\mathrm{span}}\) \( \newcommand{\AA}{\unicode[.8,0]{x212B}}\)
\( \newcommand{\vectorA}[1]{\vec{#1}} % arrow\)
\( \newcommand{\vectorAt}[1]{\vec{\text{#1}}} % arrow\)
\( \newcommand{\vectorB}[1]{\overset { \scriptstyle \rightharpoonup} {\mathbf{#1}} } \)
\( \newcommand{\vectorC}[1]{\textbf{#1}} \)
\( \newcommand{\vectorD}[1]{\overrightarrow{#1}} \)
\( \newcommand{\vectorDt}[1]{\overrightarrow{\text{#1}}} \)
\( \newcommand{\vectE}[1]{\overset{-\!-\!\rightharpoonup}{\vphantom{a}\smash{\mathbf {#1}}}} \)
\( \newcommand{\vecs}[1]{\overset { \scriptstyle \rightharpoonup} {\mathbf{#1}} } \)
\( \newcommand{\vecd}[1]{\overset{-\!-\!\rightharpoonup}{\vphantom{a}\smash {#1}}} \)
\(\newcommand{\avec}{\mathbf a}\) \(\newcommand{\bvec}{\mathbf b}\) \(\newcommand{\cvec}{\mathbf c}\) \(\newcommand{\dvec}{\mathbf d}\) \(\newcommand{\dtil}{\widetilde{\mathbf d}}\) \(\newcommand{\evec}{\mathbf e}\) \(\newcommand{\fvec}{\mathbf f}\) \(\newcommand{\nvec}{\mathbf n}\) \(\newcommand{\pvec}{\mathbf p}\) \(\newcommand{\qvec}{\mathbf q}\) \(\newcommand{\svec}{\mathbf s}\) \(\newcommand{\tvec}{\mathbf t}\) \(\newcommand{\uvec}{\mathbf u}\) \(\newcommand{\vvec}{\mathbf v}\) \(\newcommand{\wvec}{\mathbf w}\) \(\newcommand{\xvec}{\mathbf x}\) \(\newcommand{\yvec}{\mathbf y}\) \(\newcommand{\zvec}{\mathbf z}\) \(\newcommand{\rvec}{\mathbf r}\) \(\newcommand{\mvec}{\mathbf m}\) \(\newcommand{\zerovec}{\mathbf 0}\) \(\newcommand{\onevec}{\mathbf 1}\) \(\newcommand{\real}{\mathbb R}\) \(\newcommand{\twovec}[2]{\left[\begin{array}{r}#1 \\ #2 \end{array}\right]}\) \(\newcommand{\ctwovec}[2]{\left[\begin{array}{c}#1 \\ #2 \end{array}\right]}\) \(\newcommand{\threevec}[3]{\left[\begin{array}{r}#1 \\ #2 \\ #3 \end{array}\right]}\) \(\newcommand{\cthreevec}[3]{\left[\begin{array}{c}#1 \\ #2 \\ #3 \end{array}\right]}\) \(\newcommand{\fourvec}[4]{\left[\begin{array}{r}#1 \\ #2 \\ #3 \\ #4 \end{array}\right]}\) \(\newcommand{\cfourvec}[4]{\left[\begin{array}{c}#1 \\ #2 \\ #3 \\ #4 \end{array}\right]}\) \(\newcommand{\fivevec}[5]{\left[\begin{array}{r}#1 \\ #2 \\ #3 \\ #4 \\ #5 \\ \end{array}\right]}\) \(\newcommand{\cfivevec}[5]{\left[\begin{array}{c}#1 \\ #2 \\ #3 \\ #4 \\ #5 \\ \end{array}\right]}\) \(\newcommand{\mattwo}[4]{\left[\begin{array}{rr}#1 \amp #2 \\ #3 \amp #4 \\ \end{array}\right]}\) \(\newcommand{\laspan}[1]{\text{Span}\{#1\}}\) \(\newcommand{\bcal}{\cal B}\) \(\newcommand{\ccal}{\cal C}\) \(\newcommand{\scal}{\cal S}\) \(\newcommand{\wcal}{\cal W}\) \(\newcommand{\ecal}{\cal E}\) \(\newcommand{\coords}[2]{\left\{#1\right\}_{#2}}\) \(\newcommand{\gray}[1]{\color{gray}{#1}}\) \(\newcommand{\lgray}[1]{\color{lightgray}{#1}}\) \(\newcommand{\rank}{\operatorname{rank}}\) \(\newcommand{\row}{\text{Row}}\) \(\newcommand{\col}{\text{Col}}\) \(\renewcommand{\row}{\text{Row}}\) \(\newcommand{\nul}{\text{Nul}}\) \(\newcommand{\var}{\text{Var}}\) \(\newcommand{\corr}{\text{corr}}\) \(\newcommand{\len}[1]{\left|#1\right|}\) \(\newcommand{\bbar}{\overline{\bvec}}\) \(\newcommand{\bhat}{\widehat{\bvec}}\) \(\newcommand{\bperp}{\bvec^\perp}\) \(\newcommand{\xhat}{\widehat{\xvec}}\) \(\newcommand{\vhat}{\widehat{\vvec}}\) \(\newcommand{\uhat}{\widehat{\uvec}}\) \(\newcommand{\what}{\widehat{\wvec}}\) \(\newcommand{\Sighat}{\widehat{\Sigma}}\) \(\newcommand{\lt}{<}\) \(\newcommand{\gt}{>}\) \(\newcommand{\amp}{&}\) \(\definecolor{fillinmathshade}{gray}{0.9}\)Objective
After completing this section,
- understand how 1H NMR data can be used to distinguish between two (or more) possible structures for an unknown organic compound
- determine if your reaction went to completion based on how clean the 1H NMR spectrum is
- understand how the ratio of mixtures can be obtained
The two major areas where NMR has proven to be of critical importance is in the fields of medicine and chemistry, with new applications being developed daily.
Nuclear magnetic resonance imaging, better known as magnetic resonance imaging (MRI) is an important medical diagnostic tool used to study the function and structure of the human body. It provides detailed images of any part of the body, especially soft tissue, in all possible planes and has been used in the areas of cardiovascular, neurological, musculoskeletal and oncological imaging. Unlike other alternatives, such as computed tomography (CT), it does not used ionized radiation and hence is very safe to administer.

In many laboratories today, chemists use nuclear magnetic resonance to determine structures of important chemical and biological compounds. In NMR spectra, different peaks give information about different atoms in a molecule according specific chemical environments and bonding between atoms. The most common isotopes used to detect NMR signals are 1H and 13C but there are many others, such as 2H, 3He, 15N, 19F, etc., that are also in use.
NMR has also proven to be very useful in other area such as environmental testing, petroleum industry, process control, earth’s field NMR and magnetometers. Non-destructive testing saves a lot of money for expensive biological samples and can be used again if more trials need to be run. The petroleum industry uses NMR equipment to measure porosity of different rocks and permeability of different underground fluids. Magnetometers are used to measure the various magnetic fields that are relevant to one’s study.
1H NMR spectroscopy provides a lot of information. Each signal in the spectrum is a unique proton(s). Chemical shift indicates the type of environment protons are in. Integration tells how many of the unique protons there are. Spin-spin coupling tells how many neighbors a particular proton has. Each adding a bit more complexity, but how can 1H NMR be used?
1) There will be cases in which you already know what the structure might be. In these cases:
- You should draw attention to pieces of data that most strongly support your expected structure. This approach will demonstrate evaluative understanding of the data; that means you can look at data and decide what parts are more crucial than others.
- You should also draw attention to negative results: that is, peaks that might be there if this spectrum matched another, possible structure, but that are in fact missing.
2) One of the most complicated problems to deal with is the analysis of a mixture. This situation is not uncommon when running a reaction in lab.
- Sometimes the spectra shows a little starting material mixed in with the product.
- Sometimes solvents show up in the spectrum.
- As you might expect, the minor component usually shows up as smaller peaks in the spectrum. If there are fewer molecules present, then there are usually fewer protons to absorb in the spectrum.
- In this case, you should probably make two completely separate sets of data tables for your analysis, one for each compound, or else one for the main compound and one for impurities.
It can be helpful to either take a 1H NMR spectrum of your starting materials or look it up in a database, which can be used as a reference for the product 1H NMR.
3) Remember that integration ratios are really only meaningful within a single compound. If your NMR sample contains some benzene (C6H6) and some acetone (CH3COCH3), and there is a peak at 7.15 that integrates to 1 proton and a peak at 2.10 ppm integrating to 6 protons, you may think it might mean there are 6 protons in acetone and 1 in benzene, but you can tell that isn't true by looking at the structures. Both benzene and acetone have six protons. In benzene, they should all show up near 7 ppm and in acetone they should all show up near 2 ppm. Assuming that small integral of 1H for the benzene is really supposed to be 6H, then the large integral of 6H for the acetone must also represent six times as many hydrogens, too. It would be 36 H. There are only six hydrogens in acetone, so it must represent six times as many acetone molecules as there are benzene molecules.
Similarly, if you have decided that you can identify two sets of peaks in the 1H spectrum, such as starting material and product, analyzing them in different tables makes it easy to keep the integration analysis completely separate too; 1 H in one table will not be the same size integral as 1 H in the other table unless the concentrations of the two compounds in the sample are the same. Comparing the ratio of two integrals for two different compounds can give you the ratio of the two compounds in solution, just as we could determine the ratio of benzene to acetone in the mixture described above.
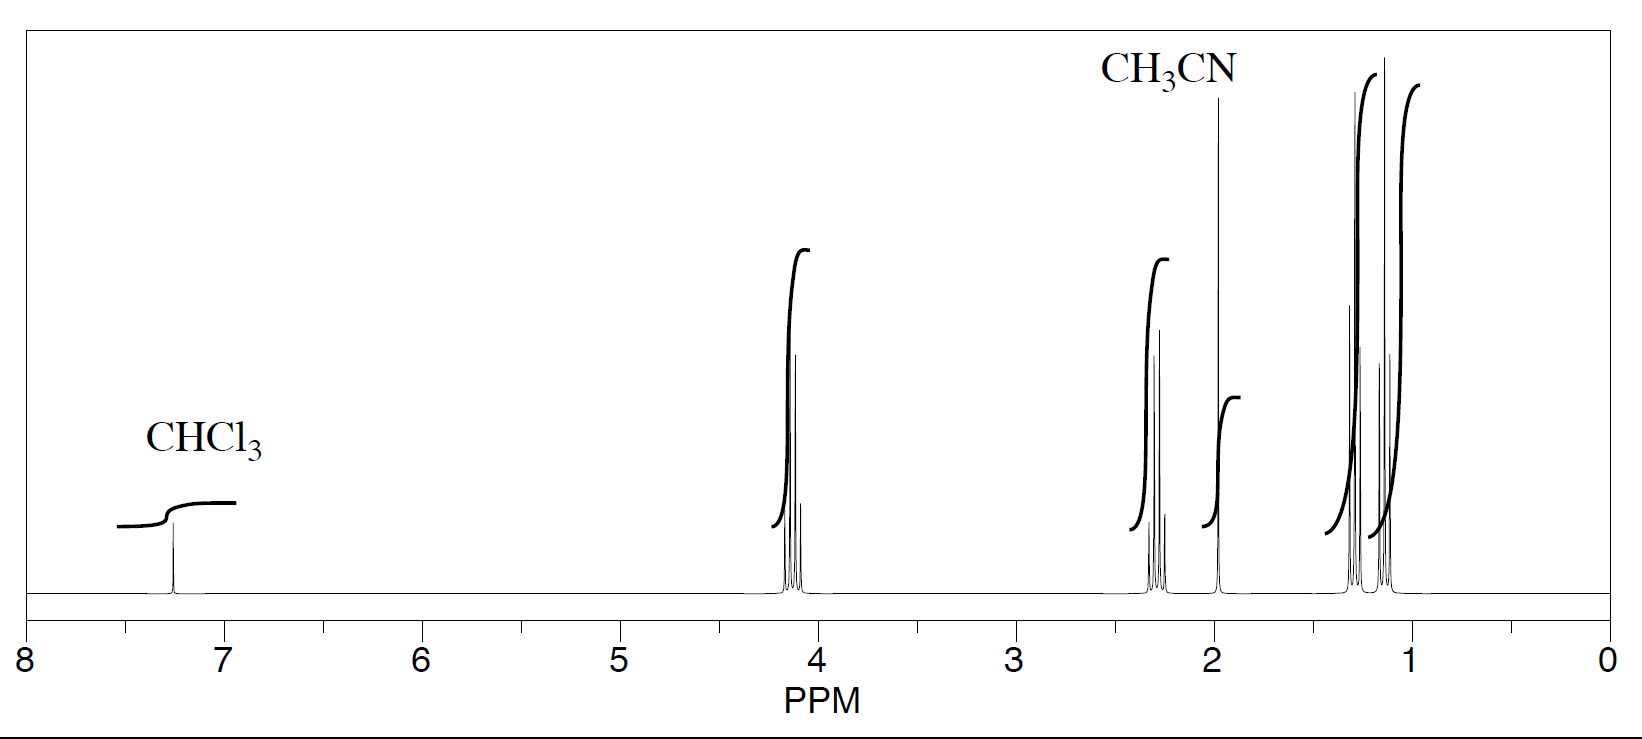
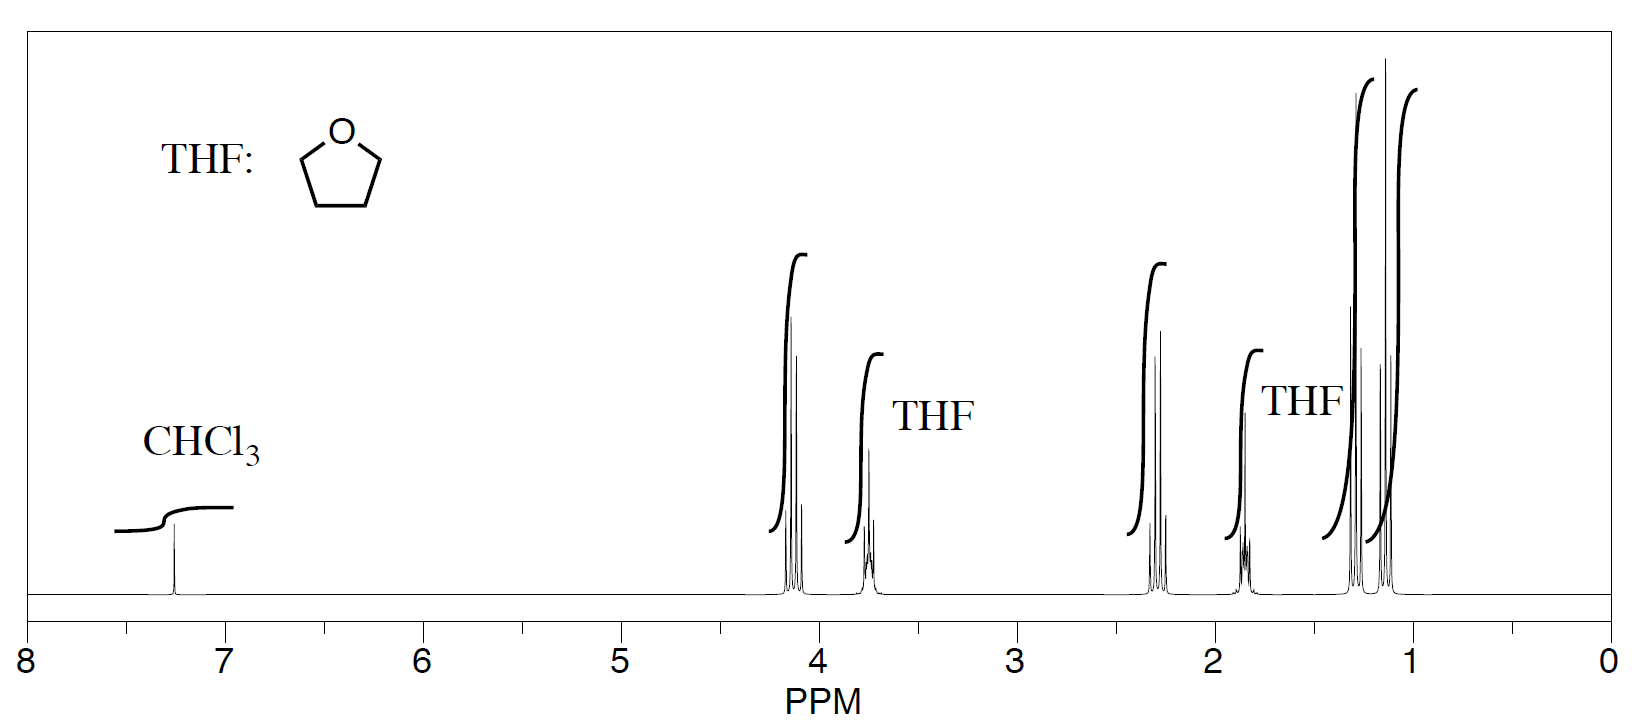
Three students performed a synthesis of a fragrant ester, ethyl propanoate, CH3CH2CO2CH2CH3. During their reactions, they each used a different solvent (acetonitrile, tetrahydrofuran, and dichloromethane). Did any of the students see just ethyl propanoate?
- See the first student's spectrum:
-
- See the second student's spectrum:
-
- See the third student's spectrum:
-
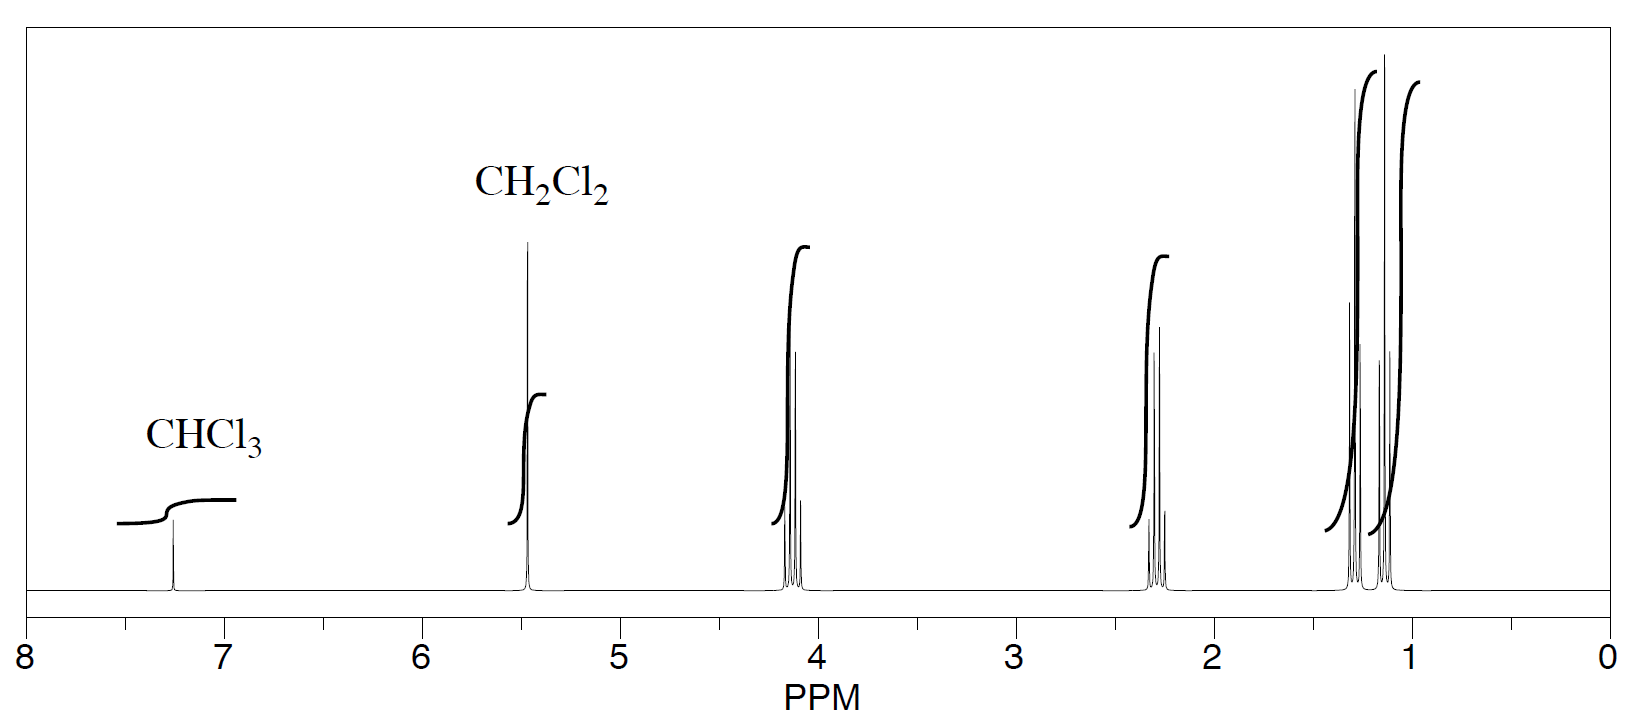
Solution
The students saw peaks in the NMR spectrum for ethyl propanoate, chloroform (CHCl3, in the CDCl3 they used to make their NMR samples), and trace amounts of solvent from running the reaction. They were also able to determine that they had some leftover solvent in their samples by consulting a useful table of solvent impurities in NMR (which they found in Goldberg et. al., Organometallics 2010, 29, 2176-2179).
Exercises
How could you tell the difference between o-xylene and p-xylene in 1H NMR?
o-xylene: 
p-xylene: 
- Answer
-
There are a variety of ways to determine the difference between these two molecules. In o-xylene, there are 3 types of protons and in p-xylene there are two types of protons. There will be spin-spin splitting in the o-xylene aromatic protons, since there are two types of aromatic protons and the protons are neighbors. p-Xylene will show now splitting in the aromatic protons, since there is just one type of aromatic proton with no neighbors.
Contributors and Attributions
Dr. Dietmar Kennepohl FCIC (Professor of Chemistry, Athabasca University)
Prof. Steven Farmer (Sonoma State University)
Organic Chemistry With a Biological Emphasis by Tim Soderberg (University of Minnesota, Morris)
Chris P Schaller, Ph.D., (College of Saint Benedict / Saint John's University)