
4.7 Identifying Characteristic Functional Groups
- Page ID
- 432184
After completing this section, you should be able to
- describe how the so-called “fingerprint region” of an infrared spectrum can assist in the identification of an unknown compound.
- be able to use an infrared spectrum to determine the presence of functional groups, such as alcohols, amines and carbonyl groups, in an unknown compound, given a list of infrared absorption frequencies.
- identify the broad regions of the infrared spectrum in which occur absorptions caused by
- N−H, C−H, and O−H
- C≡C and C≡N
- C=O and C=C
One of the most common application of infrared spectroscopy is to the identification of organic compounds. In this section, we will focus key IR peaks for common functional groups in organic chemistry. We will focus on functional groups with OH, NH, C-O, C=O, and C≡N. It is possible to identify functional groups such as tertiary amines and ethers, but the characteristic peaks for these groups are considerably more subtle and/or variable, and often are overlapped with peaks from the fingerprint region. This means you may or may not actually be able to determine if they are present as a functional group in your molecule.
Functional Groups Containing the C-O Bond
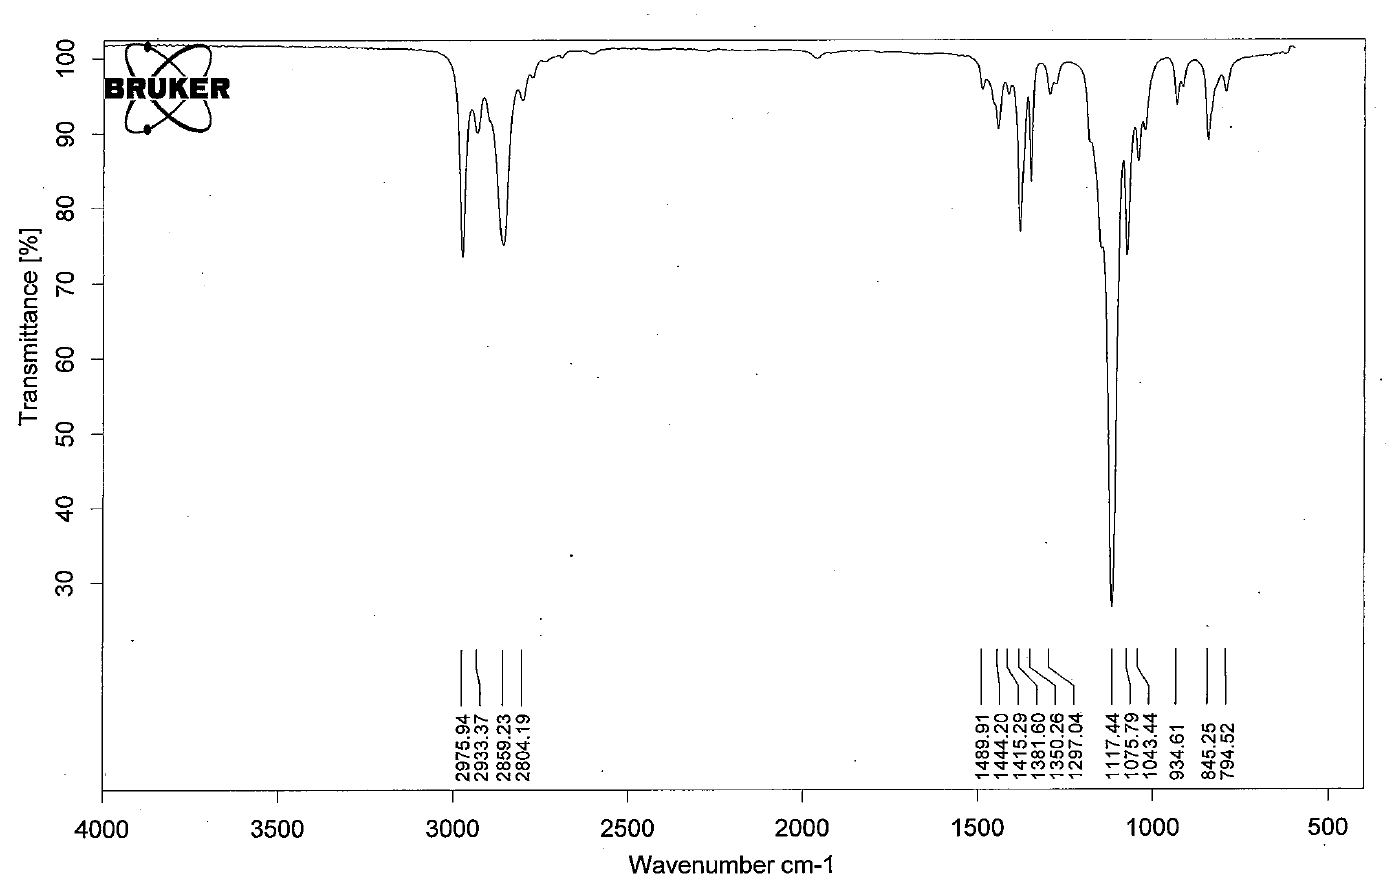
- Ethers have IR absorptions associated with both the C-O stretching vibrations.
- The figure below shows the spectrum of diethyl ether.
- Notable peak: C-O stretch at 1117 cm-1. Note: Since this falls in the fingerprint region, it can be hard to interpret sometimes.
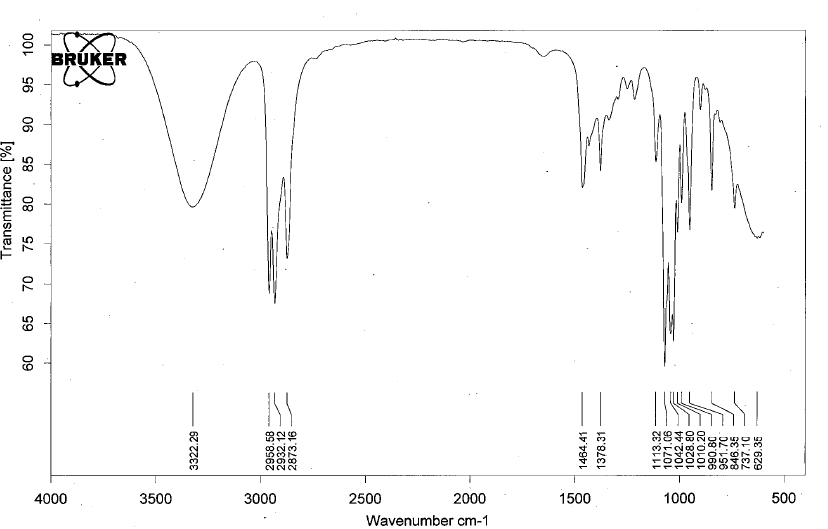
- Alcohols have IR absorptions associated with both the O-H and the C-O stretching vibrations.
- The figure below shows the spectrum of ethanol.
- Notable peaks: the very broad, strong band of the O–H stretch at 3322 cm-1 and C-O stretch at 1113 cm-1.
Functional Groups Containing the C=O Bond
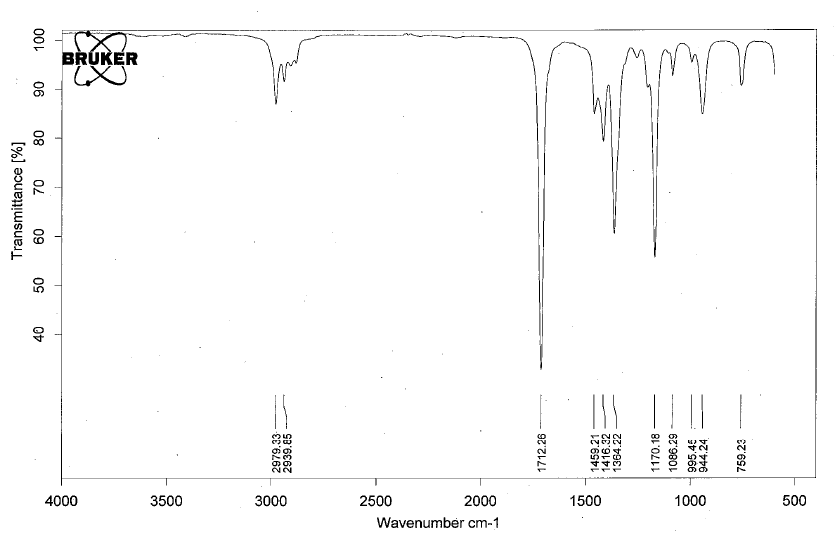
- Ketones have IR absorptions associated with the C=O bond.
- Below is a spectrum of 2-butanone.
- Notable peak: the strong band at 1712 cm-1 for the C=O.
- Note: for conjugated ketones, the carbonyl peak will shift 20-30 cm-1 lower.
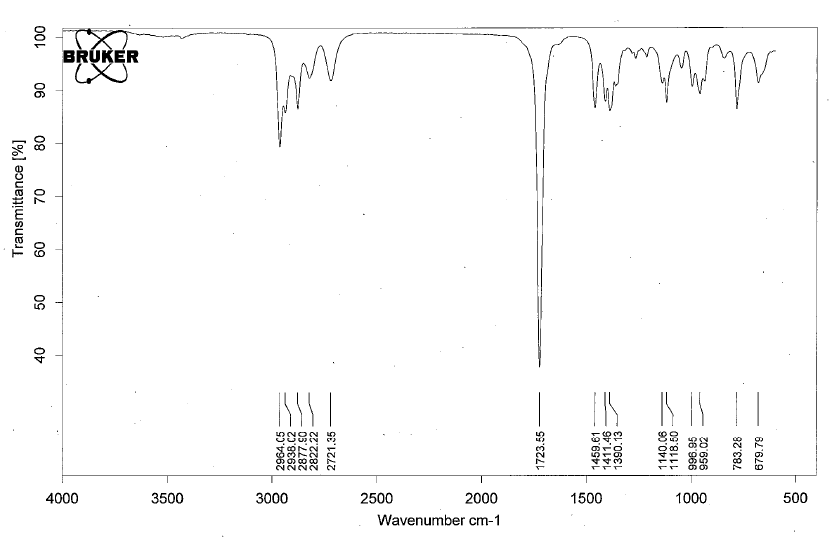
- Aldehydes have IR absorptions associated with the C=O bond and the aldehyldic proton.
- Below is a spectrum of butanal.
- Notable peaks: the strong band at 1723 cm-1 for the C=O and for the aldehyldic proton there are two peaks at 2822 cm-1 and 2721 cm-1.
- Note: for conjugated aldehydes, the carbonyl peak will shift 20-30 cm-1 lower.
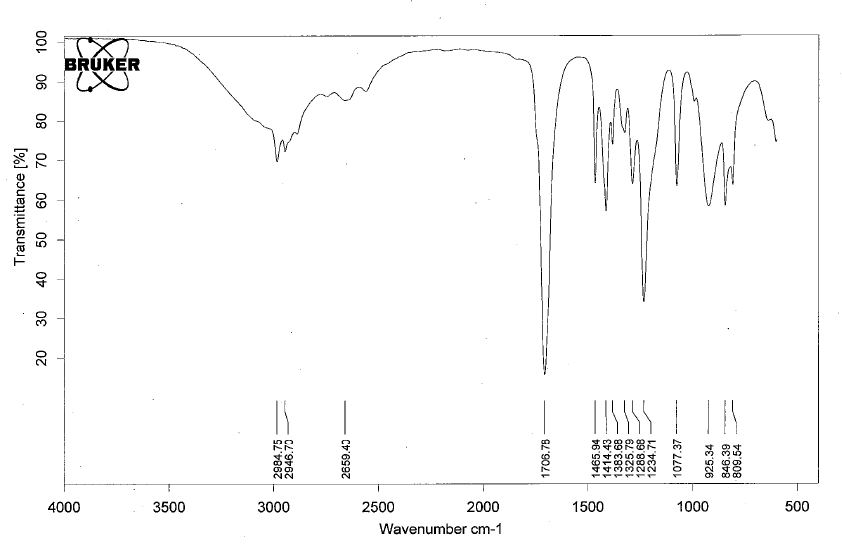
- Carboxylic acids have IR absorptions associated with the C=O bond and the carboxylic acid proton.
- Below is a spectrum of propanoic acid.
- Notable peaks: the strong band at 1706 cm-1 for the C=O and for the carboxylic acid proton is very broad band from 3100 to 2800 cm-1. The exact position of this broad band depends on whether the carboxylic acid is saturated or unsaturated, dimerized, or has internal hydrogen bonding.
- Note: for conjugated carboxylic acids, the carbonyl peak will shift 20-30 cm-1 lower.
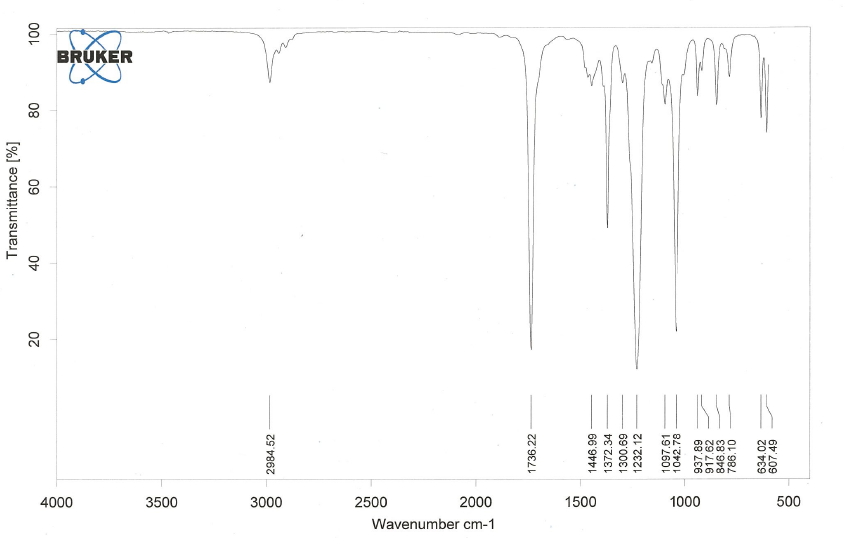
- Esters have IR absorptions associated with the C=O bond and the C-O bond.
- Below is a spectrum of ethyl acetate.
- Notable peaks: the strong band at 1736 cm-1 for the C=O and for the C-O bond is at 1232 cm-1. Depending on the fingerprint region, it may be hard to determine the C-O bond peak.
- Note: for conjugated esters, the carbonyl peak will shift 20-30 cm-1 lower.
Organic Nitrogen Compounds
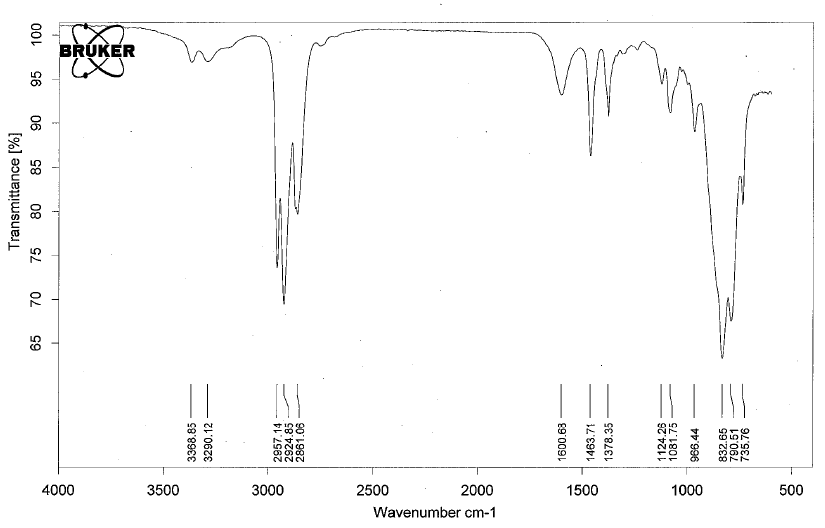
- Amines have IR absorptions associated with the N-H bond. There is a C-N peak as well, but it is often buried in the fingerprint region and difficult to discern.
- Below is a spectrum of butylamine.
- Notable peaks: the bands at 3368 cm-1 and 3290 cm-1.
- Note: 2 peaks in the range 3400 - 3300 cm-1 indicates a primary amine, 1 peak in this range indicates a secondary amine. A tertiary amine will not have a peak in this region due to the lack of a N-H bond.
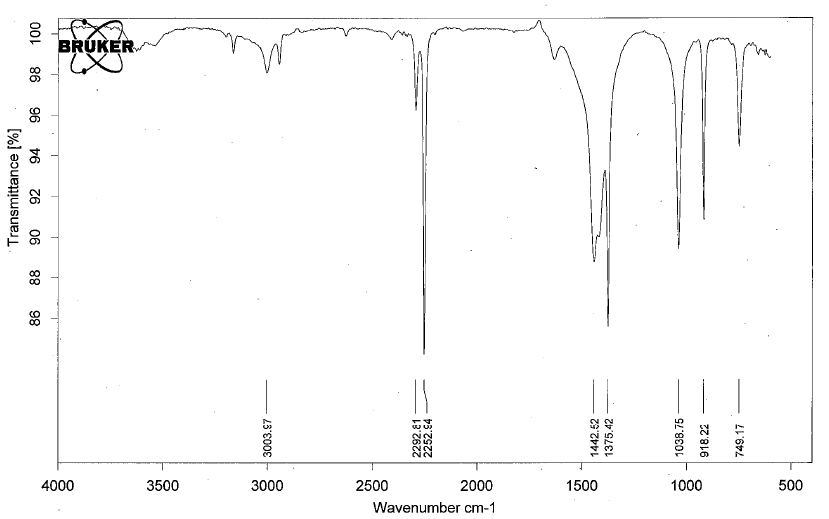
- Nitriles have IR absorptions associated with the C≡N bond. There is a C-N peak as well, but it is often buried in the fingerprint region and difficult to discern.
- Below is a spectrum of acetonitrile.
- Notable peaks: the band at 2252 cm-1.
Organic Compounds Containing Halogens
- Alkyl halides are compounds that have a C–X bond, where X is a halogen: bromine, chlorine, fluorene, or iodine.
- The spectrum of propyl chloride is shown below.
- There are stretches due to the C-Cl, but they are located in the fingerprint region and difficult to discern from other peaks.
As you can imagine, obtaining an IR spectrum for a compound will not allow us to figure out the complete structure of even a simple molecule, unless we happen to have a reference spectrum for comparison. In conjunction with other analytical methods, however, IR spectroscopy can prove to be a very valuable tool, given the information it provides about the presence or absence of key functional groups. IR can also be a quick and convenient way for a chemist to check to see if a reaction has proceeded as planned. If we were to run a reaction in which we wished to convert cyclohexanone to cyclohexanol, for example, a quick comparison of the IR spectra of starting compound and product would tell us if we had successfully converted the ketone group to an alcohol.
What functional groups give the following signals in an IR spectrum?
A) 1700 cm-1
B) 2250 cm-1
C) 1700 cm-1 and 2510-3000 cm-1
- Answer
-
A) Carbonyl: C=O bond
B) Nitrile: C≡N bond
C) Carboxylic acid: for the C=O at 1700 cm-1 and the broad OH at 2510-3000 cm-1
How can you distinguish the following pairs of compounds through IR analysis?
A) 
B) 
C) 
- Answer
-
A) A OH peak will be present around 3300 cm-1 for methanol and will be absent in the ether.
B) 1-hexene will have a alkene peak around 1650 cm-1 for the C=C and there will be another peak around 3100 cm-1 for the sp2 C-H group on the alkene, which will both be absent in cyclohexane
C) Cannot distinguish these two isomers. They both have the same functional groups and therefore would have the same peaks on an IR spectra.
3-Ethynyltoluene has the following spectrum. What notable peaks can you identify in the spectrum.

Source: SDBSWeb : http://sdbs.db.aist.go.jp (National Institute of Advanced Industrial Science and Technology, 2 December 2016)
- Answer
-
Frequency (cm-1) Functional Group 3200 C≡C-H 3050 Csp2-H 2100 C≡C 1610 C=C
What absorptions would the molecule below have in an IR spectrum?

- Answer
-
Frequency (cm-1) Functional Group 3000-3100 C=C-H 1710 C=O 1610 C=C 1100 C-O