

2.2.3: Kinetics of catalysis
- Page ID
- 401772

\( \newcommand{\vecs}[1]{\overset { \scriptstyle \rightharpoonup} {\mathbf{#1}} } \)
\( \newcommand{\vecd}[1]{\overset{-\!-\!\rightharpoonup}{\vphantom{a}\smash {#1}}} \)
\( \newcommand{\id}{\mathrm{id}}\) \( \newcommand{\Span}{\mathrm{span}}\)
( \newcommand{\kernel}{\mathrm{null}\,}\) \( \newcommand{\range}{\mathrm{range}\,}\)
\( \newcommand{\RealPart}{\mathrm{Re}}\) \( \newcommand{\ImaginaryPart}{\mathrm{Im}}\)
\( \newcommand{\Argument}{\mathrm{Arg}}\) \( \newcommand{\norm}[1]{\| #1 \|}\)
\( \newcommand{\inner}[2]{\langle #1, #2 \rangle}\)
\( \newcommand{\Span}{\mathrm{span}}\)
\( \newcommand{\id}{\mathrm{id}}\)
\( \newcommand{\Span}{\mathrm{span}}\)
\( \newcommand{\kernel}{\mathrm{null}\,}\)
\( \newcommand{\range}{\mathrm{range}\,}\)
\( \newcommand{\RealPart}{\mathrm{Re}}\)
\( \newcommand{\ImaginaryPart}{\mathrm{Im}}\)
\( \newcommand{\Argument}{\mathrm{Arg}}\)
\( \newcommand{\norm}[1]{\| #1 \|}\)
\( \newcommand{\inner}[2]{\langle #1, #2 \rangle}\)
\( \newcommand{\Span}{\mathrm{span}}\) \( \newcommand{\AA}{\unicode[.8,0]{x212B}}\)
\( \newcommand{\vectorA}[1]{\vec{#1}} % arrow\)
\( \newcommand{\vectorAt}[1]{\vec{\text{#1}}} % arrow\)
\( \newcommand{\vectorB}[1]{\overset { \scriptstyle \rightharpoonup} {\mathbf{#1}} } \)
\( \newcommand{\vectorC}[1]{\textbf{#1}} \)
\( \newcommand{\vectorD}[1]{\overrightarrow{#1}} \)
\( \newcommand{\vectorDt}[1]{\overrightarrow{\text{#1}}} \)
\( \newcommand{\vectE}[1]{\overset{-\!-\!\rightharpoonup}{\vphantom{a}\smash{\mathbf {#1}}}} \)
\( \newcommand{\vecs}[1]{\overset { \scriptstyle \rightharpoonup} {\mathbf{#1}} } \)
\( \newcommand{\vecd}[1]{\overset{-\!-\!\rightharpoonup}{\vphantom{a}\smash {#1}}} \)
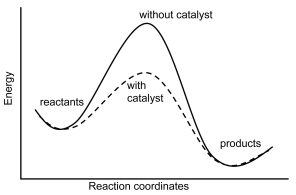
As can be seen from the Arrhenius equation, the magnitude of the activation energy, \(E_a\), determines the value of the rate constant, \(k\), at a given temperature and thus the overall reaction rate. Catalysts provide a means of reducing \(E_a\) and increasing the reaction rate. Catalysts are defined as substances that participate in a chemical reaction but are not changed or consumed. Instead they provide a new mechanism for a reaction to occur which has a lower activation energy than that of the reaction without the catalyst. Homogeneous catalysis refers to reactions in which the catalyst is in solution with at least one of the reactants whereas heterogeneous catalysis refers to reactions in which the catalyst is present in a different phase, usually as a solid, than the reactants. Figure \(\PageIndex{1}\) shows a comparison of energy profiles of a reaction in the absence and presence of a catalyst.
Consider a non-catalyzed elementary reaction
\[\text{A} \overset{k}{\longrightarrow} \text{P}\]
which proceeds at rate \(k\) at a certain temperature. The reaction rate can be expressed as
\[\dfrac{d \left[ \text{A} \right]}{dt} = -k \left[ \text{A} \right] \label{Eq1}\]
In the presence of a catalyst \(\text{C}\), we can write the reaction as
\[\text{A} + \text{C} \overset{k_\text{cat}}{\longrightarrow} \text{P} + \text{C}\]
and the reaction rate as
\[\dfrac{d \left[ \text{A} \right]}{dt} = -k \left[ \text{A} \right] - k_\text{cat} \left[ \text{A} \right] \left[ \text{C} \right] \label{Eq2}\]
where the first term represents the uncatalyzed reaction and the second term represents the catalyzed reaction. Because the reaction rate of the catalyzed reaction is often magnitudes larger than that of the uncatalyzed reaction (i.e. \(k_\text{cat} \gg k\)), the first term can often be ignored.
Example of Homogenous Catalysis: Acid Catalysis
A common example of homogeneous catalysts are acids and bases. For example, given an overall reaction is \(\text{S} \rightarrow \text{P}\). If \(k\) is the rate, then
\[\dfrac{d \left[ \text{P} \right]}{dt} = k \left[ \text{S} \right]\]
The purpose of an enzyme is to enhance the rate of production of the product \(\text{P}\). The equations of the acid-catalyzed reaction are
\[\begin{align} \text{S} + \text{A}H &\overset{k_1}{\underset{k_{-1}}{\rightleftharpoons}} \text{S}H^+ + \text{A}^- \\ \text{S}H^+ + H_2 O &\overset{k_2}{\rightarrow} \text{P} + H_3 O^+ \\ H_3 O^+ + \text{A}^- &\overset{k_3}{\underset{k_{-3}}{\rightleftharpoons}} \text{A}H + H_2 O \end{align}\]
The full set of kinetic equations is
\[\begin{align} \dfrac{d \left[ \text{S} \right]}{dt} &= -k_1 \left[ \text{S} \right] \left[ \text{A} H \right] + k_{-1} \left[ \text{S} H^+ \right] \left[ \text{A}^- \right] \\ \dfrac{ d \left[ \text{A} H \right]}{dt} &= -k_1 \left[ \text{S} \right] \left[ \text{A} H \right] + k_{-1} \left[ \text{S} H^+ \right] \left[ \text{A}^- \right] - k_{-3} \left[ \text{A} H \right] + k_3 \left[ H_3 O^+ \right] \left[ \text{A}^- \right] \\ \dfrac{d \left[ \text{S} H^+ \right]}{dt} &= k_1 \left[ \text{S} \right] \left[ \text{A} H \right] - k_{-1} \left[ \text{S} H^+ \right] \left[ \text{A}^- \right] - k_2 \left[ \text{S} H^+ \right] \\ \dfrac{d \left[ \text{A}^- \right]}{dt} &= k_1 \left[ \text{S} \right] \left[ \text{A} H \right] - k_{-1} \left[ \text{S} H^+ \right] \left[ \text{A}^- \right] -k_2 \left[ \text{A}^- \right] \left[ H_3 O^+ \right] + k_{-3} \left[ \text{A} H \right] \\ \dfrac{d \left[ \text{P} \right]}{dt} &= k_2 \left[ \text{S} H^+ \right] \\ \dfrac{d \left[ H_3 O^+ \right]}{dt} &= -k_2 \left[ \text{S} H^+ \right] - k_3 \left[ H_3 O^+ \right] \left[ \text{A}^- \right] + k_{-3} \left[ \text{A} H \right] \end{align} \label{Eq3}\]
We cannot easily solve these, as they are nonlinear. However, let us consider two cases \(k_2 \gg k_{-1} \left[ \text{A}^- \right]\) and \(k_2 \ll k_{-1} \left[ \text{A}^- \right]\). In both cases, \(\text{S} H^+\) is consumed quickly, and we can apply a steady-state approximation:
\[\dfrac{d \left[ \text{S} H^+ \right]}{dt} = k_1 \left[ \text{S} \right] \left[ \text{A} H \right] - k_{-1} \left[ \text{A}^- \right] \left[ \text{S} H^+ \right] - k_2 \left[ \text{S} H^+ \right] = 0 \label{Eq4}\]
Rearranging in terms of \(\text{S} H^+\) yields
\[\left[ \text{S} H^+ \right] = \dfrac{k_1 \left[ \text{S} \right] \left[ \text{A} H \right]}{k_{-1} \left[ \text{A}^- \right] + k_2} \label{Eq5}\]
and the rate of production of \(\text{P}\) can be written as
\[\dfrac{d \left[ \text{P} \right]}{dt} = k_2 \left[ \text{S} H^+ \right] = \dfrac{k_1 k_2 \left[ \text{S} \right] \left[ \text{A} H \right]}{k_{-1} \left[ \text{A}^- \right] + k_2} \label{Eq6}\]
In the case where \(k_2 \gg k_{-1} \left[ \text{A}^- \right]\), Equation \(\ref{Eq6}\) can be written as
\[\dfrac{d \left[ \text{P} \right]}{dt} = k_1 \left[ \text{S} \right] \left[ \text{A} H \right] \label{Eq7}\]
which is known as a general acid-catalyzed reaction. On the other hand, if \(k_2 \ll k_{-1} \left[ \text{A}^- \right]\), we can use an equilibrium approximation to write the rate of production of \(\text{P}\) as
\[\dfrac{d \left[ \text{P} \right]}{dt} = \dfrac{k_1 k_2 \left[ \text{S} \right] \left[ \text{A} H \right]}{k_{-1} \left[ \text{A}^- \right]} = \dfrac{k_1 k_2}{k_{-1} K} \left[ \text{S} \right] \left[ H^+ \right] \label{Eq8}\]
where \(K\) is the acid dissociation constant:
\[K = \dfrac{ \left[ \text{A}^- \right] \left[ H^+ \right]}{\left[ \text{A} H \right]} \label{Eq9}\]
In this case, the reaction is hydrogen ion-catalyzed.
Example of Heterogeneous Catalysis: Surface Catalysis of Gas-Phase Reactions
Many gas-phase reactions are catalyzed on a solid surface. For a first-order, unimolecular reaction, the reaction mechanism can be written as
\[\text{A} \left( g \right) + \text{S} \left( s \right) \overset{k_1}{\underset{k_{-1}}{\rightleftharpoons}} \text{AS} \left( s \right)\]
\[\text{AS} \left( s \right) \overset{k_2}{\rightarrow} \text{P} \left( g \right) + \text{S} \left( g \right)\]
where the first step is reversible adsorption of the gas molecule, \(\text{A}\), onto active sites on the catalyst surface, \(\text{S}\), to form a transition state, \(\text{AS}\), and the second step is the conversion of adsorbed \(\text{A}\) molecules to species \(\text{P}\). Applying the steady-state approximation to species \(\text{AS}\), we can write
\[\dfrac{d \left[ \text{AS} \right]}{dt} = k_1 \left[ \text{A} \right] \left[ \text{S} \right] - k_{-1} \left[ \text{AS} \right]_{ss} - k_2 \left[ \text{AS} \right]_{ss} = 0 \label{Eq10}\]
Because the concentration of total active sites on the catalyst surface is fixed at \(\left[ \text{S} \right]_0\), the concentration of adsorbed species on the catalyst surface, \(\left[ \text{AS} \right]\) can be written as
\[\left[ \text{AS} \right] = \theta \left[ \text{S} \right]_0 \label{Eq11}\]
and \(\left[ \text{S} \right]\) can be written as
\[\left[ \text{S} \right] = \left( 1 - \theta \right) \left[ \text{S} \right]_0 \label{Eq12}\]
where \(\theta\) is the fractional surface coverage of species \(\text{A}\) on the catalyst surface. We can now write Equation \(\ref{Eq10}\) as
\[k_1 \left[ \text{A} \right] \left( 1 - \theta \right) \left[ \text{S} \right]_0 - \left( k_{-1} + k_2 \right) \theta \left[ \text{S} \right]_0 = 0 \label{Eq13}\]
Rearranging the above equation in terms of \(\theta\) yields
\[\theta = \dfrac{k_1 \left[ \text{A} \right]}{k_1 \left[ \text{A} \right] + k_{-1} + k_2} \label{Eq14}\]
The rate of production of \(\text{P}\) can be written as
\[\dfrac{d \left[ \text{P} \right]}{dt} = k_2 \left[ \text{AS} \right]_{ss} = k_2 \theta \left[ \text{S} \right]_0 = \dfrac{k_1 k_2}{k_1 \left[ \text{A} \right] + k_{-1} + k_2} \left[ \text{A} \right] \left[ \text{S} \right]_0 \label{Eq15}\]
From the above equation, we can observe the importance of having high surface areas for catalytic reactions.
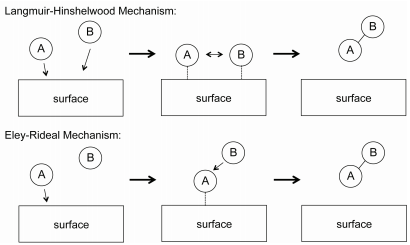
For bimolecular gas-phase reactions, two generally-used mechanisms to explain reactions kinetics are the Langmuir-Hinshelwood and Eley-Rideal mechanisms, shown in Figure \(\PageIndex{2}\). In the Langmuir-Hinshelwood mechanism, \(\text{A}\) and \(\text{B}\) both adsorb onto the catalyst surface, at which they react to form a product. The reaction mechanism is
\[\text{A} \left( g \right) + \text{S} \left( s \right) \overset{k_1}{\underset{k_{-1}}{\rightleftharpoons}} \text{AS} \left( s \right)\]
\[\text{B} \left( g \right) + \text{S} \left( s \right) \overset{k_2}{\underset{k_{-2}}{\rightleftharpoons}} \text{BS} \left( s \right)\]
\[\text{AS} \left( s \right) + \text{BS} \left( s \right) \overset{k_3}{\rightarrow} \text{P}\]
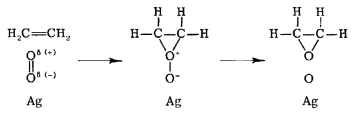
The rate law for the Langmuir-Hinshelwood mechanism can be derived in a similar manner to that for unimolecular catalytic reactions by assuming that the total number of active sites on the catalyst surface is fixed. In the Eley-Rideal mechanism, only one species adsorbs onto the catalyst surface. An example of such a reaction is the partial oxidation of ethylene into ethylene oxide, as shown in Figure \(\PageIndex{3}\). In this reaction, diatomic oxygen adsorbs onto the catalytic surface where it reacts with ethylene molecules in the gas phase.
The reactions for the Eley-Rideal mechanism can be written as
\[\text{A} \left( g \right) + \text{S} \left( s \right) \overset{k_1}{\underset{k_{-1}}{\rightleftharpoons}} \text{AS} \left( s \right)\]
\[\text{AS} \left( s \right) + \text{B} \left( g \right) \overset{k_2}{\rightarrow} \text{P} \left( g \right) + \text{S} \left( s \right)\]
Assuming that \(k_{-1} \gg k_1\), we can apply a steady-state approximation to species \(\text{AS}\):
\[\dfrac{d \left[ \text{AS} \right]}{dt} = 0 = k_1 \left[ \text{A} \right] \left[ \text{S} \right] - k_{-1} \left[ \text{AS} \right]_{ss} - k_2 \left[ \text{AS} \right]_{ss} \left[ \text{B} \right] \label{Eq16}\]
As in the case of unimolecular catalyzed reactions, we can express the concentrations of \(\text{AS}\) and \(\text{S}\) in terms of a fraction of the total number of active sites, \(\text{S}_0\) and rewrite the above equation as
\[0 = k_1 \left[ \text{A} \right] \left( 1 - \theta \right) \left[ \text{S} \right]_0 - k_{-1} \left[ \text{S} \right]_0 - k_2 \theta \left[ \text{S} \right]_0 \left[ \text{B} \right] \label{Eq17}\]
Solving for \(\theta\) yields
\[\theta = \dfrac{k_1 \left[ \text{A} \right]}{k_1 \left[ \text{A} \right] + k_{-1} + k_2 \left[ \text{B} \right]} \label{Eq18}\]
Furthermore, if \(k_2 \ll k_1\) and \(k_{-1}\), we can simplify \(\theta\) to
\[\theta = \dfrac{k_1 \left[ \text{A} \right]}{k_1 \left[ \text{A} \right] + k_{-1}} \label{Eq19}\]
The rate of production of \(\text{P}\) can be expressed as
\[\dfrac{d \left[ \text{P} \right]}{dt} = k_2 \left[ \text{AS} \right]_{ss} \left[ \text{B} \right] = k_2 \theta \left[ \text{S} \right]_0 \left[ \text{B} \right] = \dfrac{k_1 k_2 \left[ \text{A} \right]}{k_1 \left[ \text{A} \right] + k_{-1}} \left[ \text{S} \right]_0 \left[ \text{B} \right] \label{Eq20}\]
We can also write the above expression in terms of the equilibrium constant, \(K\), which is equal to\(k_1/k_{-1}\)
\[\dfrac{d \left[ \text{P} \right]}{dt} = K k_2 \left[ \text{B} \right] \dfrac{K \left[ \text{A} \right]}{K \left[ \text{A} \right] + 1} \label{Eq21}\]
Michaelis-Menten Enzyme Kinetics
In biological systems, enzymes act as catalysts and play a critical role in accelerating reactions, anywhere from \(10^3\) to \(10^{17}\) times faster than the reaction would normally proceed. Enzymes are high-molecular weight proteins that act on a substrate, or reactant molecule, to form one or more products. In 1913, Leonor Michaelis and Maude Menten proposed the following reaction mechanism for enzymatic reactions:
\[\text{E} + \text{S} \overset{k_1}{\underset{k_{-1}}{\rightleftharpoons}} \text{ES} \overset{k_2}{\rightarrow} \text{E} + \text{P}\]
where \(\text{E}\) is the enzyme, \(\text{ES}\) is the enzyme-substrate complex, and \(\text{P}\) is the product. In the first step, the substrate binds to the active site of the enzyme. In the second step, the substrate is converted into the product and released from the substrate. For this mechanism, we can assume that the concentration of the enzyme-substrate complex, \(\text{ES}|), is small and employ a steady-state approximation:
\[\dfrac{d \left[ \text{ES} \right]}{dt} = k_1 \left[ \text{E} \right] \left[ \text{S} \right] - k_{-1} \left[ \text{ES} \right]_{ss} - k_2 \left[ \text{ES} \right]_{ss} \approx 0 \label{Eq22}\]
Furthermore, because the enzyme is unchanged throughout the reaction, we express the total enzyme concentration as a sum of enzyme and enzyme-substrate complex:
\[\left[ \text{E} \right]_0 = \left[ \text{ES} \right] + \left[ \text{E} \right] \label{Eq23}\]
Plugging Equation \(\ref{Eq23}\) into Equation \(\ref{Eq22}\), we obtain
\[0 = k_1 \left( \left[ \text{E} \right]_0 - \left[ \text{ES} \right]_{ss} \right) \left[ \text{S} \right] - k_{-1} \left[ \text{ES} \right]_{ss} + k_2 \left[ \text{ES} \right]_{ss} \label{Eq24}\]
Solving for \(\left[ \text{ES} \right]_{ss}\)
\[\left[ \text{ES} \right]_{ss} = \dfrac{k_1 \left[ \text{E} \right]_0 \left[ \text{S} \right]}{k_1 \left[ \text{S} \right] + k_{-1} + k_2} = \dfrac{\left[ \text{E} \right]_0 \left[ \text{S} \right]}{\left[ \text{S} \right] + \dfrac{k_{-1} + k_2}{k_1}} \label{Eq25}\]
We can then write the reaction rate of the product as
\[\dfrac{d \left[ \text{P} \right]}{dt} = k_2 \left[ \text{ES} \right]_{ss} = \dfrac{k_2 \left[ \text{E} \right]_0 \left[ \text{S} \right]}{\left[ \text{S} \right] + \dfrac{k_{-1} + k_2}{k_1}} = \dfrac{k_2 \left[ \text{E} \right]_0 \left[ \text{S} \right]}{\left[ \text{S} \right] + K_M} \label{Eq26}\]
where \(K_M\) is the Michaelis constant. Equation \(\ref{Eq26}\) is known as the Michaelis-Menten equation. The result for Michaelis-Menten kinetics equivalent to that for a unimolecular gas phase reaction catalyzed on a solid surface. In the limit where there is a large amount of substrate present \(\left( \left[ \text{S} \right] \gg K_M \right)\) Equation \(\ref{Eq26}\) reduces to
\[\dfrac{d \left[ \text{P} \right]}{dt} = r_\text{max} = k_2 \left[ \text{E} \right]_0 \label{Eq27}\]
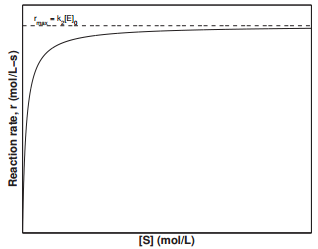
which is a \(0^{th}\) order reaction, since \(\left[ \text{E} \right]_0\) is a constant. The value \(k_2 \left[ \text{E} \right]_0\) represents the maximum rate, \(r_\text{max}\), at which the enzymatic reaction can proceed. The rate constant, \(k_2\), is also known as the turnover number, which is the number of substrate molecules converted to product in a given time when all the active sites on the enzyme are occupied. Figure \(\PageIndex{4}\) displays the dependence of the reaction rate on the substrate concentration, \(\left[ \text{S} \right]\). This plot is known as the Michaelis-Menten plot. Examining the figure, we can see that the reaction rate reaches a maximum value of \(k_2 \left[ \text{E} \right]_0\) at large values of \(\left[ \text{S} \right]\).
Another commonly-used plot in examining enzyme kinetics is the Lineweaver-Burk plot, in with the inverse of the reaction rate, \(1/r\), is plotted against the inverse of the substrate concentration \(1/\left[ \text{S} \right]\). Rearranging Equation \(\ref{Eq26}\),
\[\dfrac{1}{r} = \dfrac{K_M + \left[ \text{S} \right]}{k_2 \left[ \text{E} \right]_0 \left[ \text{S} \right]} = \dfrac{K_M}{k_2 \left[ \text{E} \right]_0} \dfrac{1}{\left[ \text{S} \right]} + \dfrac{1}{k_2 \left[ \text{E} \right]_0} \label{Eq28}\]
The Lineweaver-Burk plot results in a straight line with the slope equal to \(K_M/k_2 \left[ \text{E} \right]_0\) and \(y\)-intercept equal to \(1/k_2 \left[ \text{E} \right]_0\).