
4.1: Molecular Weight of Polymers
- Page ID
- 190666

\( \newcommand{\vecs}[1]{\overset { \scriptstyle \rightharpoonup} {\mathbf{#1}} } \)
\( \newcommand{\vecd}[1]{\overset{-\!-\!\rightharpoonup}{\vphantom{a}\smash {#1}}} \)
\( \newcommand{\dsum}{\displaystyle\sum\limits} \)
\( \newcommand{\dint}{\displaystyle\int\limits} \)
\( \newcommand{\dlim}{\displaystyle\lim\limits} \)
\( \newcommand{\id}{\mathrm{id}}\) \( \newcommand{\Span}{\mathrm{span}}\)
( \newcommand{\kernel}{\mathrm{null}\,}\) \( \newcommand{\range}{\mathrm{range}\,}\)
\( \newcommand{\RealPart}{\mathrm{Re}}\) \( \newcommand{\ImaginaryPart}{\mathrm{Im}}\)
\( \newcommand{\Argument}{\mathrm{Arg}}\) \( \newcommand{\norm}[1]{\| #1 \|}\)
\( \newcommand{\inner}[2]{\langle #1, #2 \rangle}\)
\( \newcommand{\Span}{\mathrm{span}}\)
\( \newcommand{\id}{\mathrm{id}}\)
\( \newcommand{\Span}{\mathrm{span}}\)
\( \newcommand{\kernel}{\mathrm{null}\,}\)
\( \newcommand{\range}{\mathrm{range}\,}\)
\( \newcommand{\RealPart}{\mathrm{Re}}\)
\( \newcommand{\ImaginaryPart}{\mathrm{Im}}\)
\( \newcommand{\Argument}{\mathrm{Arg}}\)
\( \newcommand{\norm}[1]{\| #1 \|}\)
\( \newcommand{\inner}[2]{\langle #1, #2 \rangle}\)
\( \newcommand{\Span}{\mathrm{span}}\) \( \newcommand{\AA}{\unicode[.8,0]{x212B}}\)
\( \newcommand{\vectorA}[1]{\vec{#1}} % arrow\)
\( \newcommand{\vectorAt}[1]{\vec{\text{#1}}} % arrow\)
\( \newcommand{\vectorB}[1]{\overset { \scriptstyle \rightharpoonup} {\mathbf{#1}} } \)
\( \newcommand{\vectorC}[1]{\textbf{#1}} \)
\( \newcommand{\vectorD}[1]{\overrightarrow{#1}} \)
\( \newcommand{\vectorDt}[1]{\overrightarrow{\text{#1}}} \)
\( \newcommand{\vectE}[1]{\overset{-\!-\!\rightharpoonup}{\vphantom{a}\smash{\mathbf {#1}}}} \)
\( \newcommand{\vecs}[1]{\overset { \scriptstyle \rightharpoonup} {\mathbf{#1}} } \)
\(\newcommand{\longvect}{\overrightarrow}\)
\( \newcommand{\vecd}[1]{\overset{-\!-\!\rightharpoonup}{\vphantom{a}\smash {#1}}} \)
\(\newcommand{\avec}{\mathbf a}\) \(\newcommand{\bvec}{\mathbf b}\) \(\newcommand{\cvec}{\mathbf c}\) \(\newcommand{\dvec}{\mathbf d}\) \(\newcommand{\dtil}{\widetilde{\mathbf d}}\) \(\newcommand{\evec}{\mathbf e}\) \(\newcommand{\fvec}{\mathbf f}\) \(\newcommand{\nvec}{\mathbf n}\) \(\newcommand{\pvec}{\mathbf p}\) \(\newcommand{\qvec}{\mathbf q}\) \(\newcommand{\svec}{\mathbf s}\) \(\newcommand{\tvec}{\mathbf t}\) \(\newcommand{\uvec}{\mathbf u}\) \(\newcommand{\vvec}{\mathbf v}\) \(\newcommand{\wvec}{\mathbf w}\) \(\newcommand{\xvec}{\mathbf x}\) \(\newcommand{\yvec}{\mathbf y}\) \(\newcommand{\zvec}{\mathbf z}\) \(\newcommand{\rvec}{\mathbf r}\) \(\newcommand{\mvec}{\mathbf m}\) \(\newcommand{\zerovec}{\mathbf 0}\) \(\newcommand{\onevec}{\mathbf 1}\) \(\newcommand{\real}{\mathbb R}\) \(\newcommand{\twovec}[2]{\left[\begin{array}{r}#1 \\ #2 \end{array}\right]}\) \(\newcommand{\ctwovec}[2]{\left[\begin{array}{c}#1 \\ #2 \end{array}\right]}\) \(\newcommand{\threevec}[3]{\left[\begin{array}{r}#1 \\ #2 \\ #3 \end{array}\right]}\) \(\newcommand{\cthreevec}[3]{\left[\begin{array}{c}#1 \\ #2 \\ #3 \end{array}\right]}\) \(\newcommand{\fourvec}[4]{\left[\begin{array}{r}#1 \\ #2 \\ #3 \\ #4 \end{array}\right]}\) \(\newcommand{\cfourvec}[4]{\left[\begin{array}{c}#1 \\ #2 \\ #3 \\ #4 \end{array}\right]}\) \(\newcommand{\fivevec}[5]{\left[\begin{array}{r}#1 \\ #2 \\ #3 \\ #4 \\ #5 \\ \end{array}\right]}\) \(\newcommand{\cfivevec}[5]{\left[\begin{array}{c}#1 \\ #2 \\ #3 \\ #4 \\ #5 \\ \end{array}\right]}\) \(\newcommand{\mattwo}[4]{\left[\begin{array}{rr}#1 \amp #2 \\ #3 \amp #4 \\ \end{array}\right]}\) \(\newcommand{\laspan}[1]{\text{Span}\{#1\}}\) \(\newcommand{\bcal}{\cal B}\) \(\newcommand{\ccal}{\cal C}\) \(\newcommand{\scal}{\cal S}\) \(\newcommand{\wcal}{\cal W}\) \(\newcommand{\ecal}{\cal E}\) \(\newcommand{\coords}[2]{\left\{#1\right\}_{#2}}\) \(\newcommand{\gray}[1]{\color{gray}{#1}}\) \(\newcommand{\lgray}[1]{\color{lightgray}{#1}}\) \(\newcommand{\rank}{\operatorname{rank}}\) \(\newcommand{\row}{\text{Row}}\) \(\newcommand{\col}{\text{Col}}\) \(\renewcommand{\row}{\text{Row}}\) \(\newcommand{\nul}{\text{Nul}}\) \(\newcommand{\var}{\text{Var}}\) \(\newcommand{\corr}{\text{corr}}\) \(\newcommand{\len}[1]{\left|#1\right|}\) \(\newcommand{\bbar}{\overline{\bvec}}\) \(\newcommand{\bhat}{\widehat{\bvec}}\) \(\newcommand{\bperp}{\bvec^\perp}\) \(\newcommand{\xhat}{\widehat{\xvec}}\) \(\newcommand{\vhat}{\widehat{\vvec}}\) \(\newcommand{\uhat}{\widehat{\uvec}}\) \(\newcommand{\what}{\widehat{\wvec}}\) \(\newcommand{\Sighat}{\widehat{\Sigma}}\) \(\newcommand{\lt}{<}\) \(\newcommand{\gt}{>}\) \(\newcommand{\amp}{&}\) \(\definecolor{fillinmathshade}{gray}{0.9}\)Molecular weight is one of the most central aspects of polymer properties. Of course, all molecules have molecular weights of their own. It might seem obvious that molecular weight is an essential property of any molecular compound. In polymers, molecular weight takes on added significance. That's because a polymer is a large molecule made up of repeating units, but how many repeating units? Thirty? A thousand? A million? Any of those possibilities might still be considered a representative of the same material, but their molecular weights would be very different, and so would their properties.
That variation introduces some unique aspects of polymer molecular weight. Because polymers are assembled from smaller molecules, the length (and consequently the molecular weight) of a polymer chain depends on the number of monomers that have been enchained into the polymer. The number of enchained monomers in an average polymer chain in a material is called the degree of polymerization (DP).
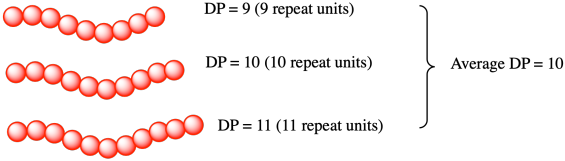
Notice that key point: it is just an average. In any given material, there will be some chains that have added more monomers and some chains that have added fewer. Why the difference? First of all, polymer growth is a dynamic process. It requires monomers to come together and react. What if one monomer starts reacting, forming a growing chain, before any of the others get started? With its head start, this chain will become longer than the rest. What if something goes wrong with one of the growing chains, and it can no longer add new monomers? That chain experienced an early death, and it will never grow as long as the others.
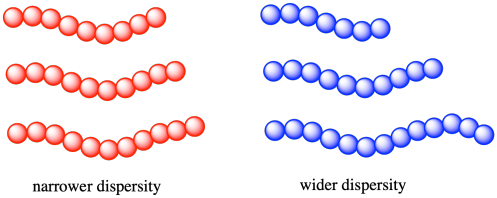
As a result, when we are speaking about the molecular weight of a polymer, we are always talking about an average value. Some chains in the material will be longer (and heavier) and some chains in the material will be shorter (and lighter). As with any group of measurements, it's helpful to know how widely distributed the individual values really are. In polymer chemistry, the width of the distribution of molecular weights is described by the dispersity (Ð, also called, in older texts, the polydispersity or the polydispersity index, PDI). The dispersity of a polymer sample if often between 1 and 2 (although it can be even higher than 2). The closer it is to 1, the narrower the distribution. That is, a dispersity of 1.0 would mean that all of the chains in a sample are exactly the same length, with the same molecular weight.
The original idea of dispersity was based on alternative methods of measuring the molecular weight (or the chain length) of a polymer sample. One set of methods gave something called the number average molecular weight (symbol Mn). These methods essentially took the weight of a sample, counted the molecules in a sample, and therefore found the average weight of each molecule in that sample. A classic example of this approach is a colligative properties experiment, such as a freezing point depression. You know that impurities in a liquid tend to disrupt intermolecular interactions and lower the freezing point of the liquid. You may also know that the amount by which the freezing gets lowered depends on the number of molecules or ions that get dissolved. Hence, if you weigh a sample of polymer, dissolve it in a solvent, and measure the freezing point, you could figure out the number of molecules dissolved and consequently arrive at Mn.
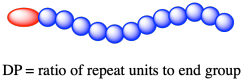
That's not so easy in practice; freezing point depressions are very small. They're not used very often anymore. A very common example of the kind of measurement widely used to determine Mn today is end group analysis. In end group analysis, we use 1H NMR measurements to determine the ratio of a specific proton in the repeat units to a specific proton in the end group. Remember, the end group might be something like the initiator, which only added onto the first monomer to get the polymerization going. By the end of the polymerization, it is still found at the end of the polymer chain, so it is an end group. There is only one of them per chain, whereas there are lots of monomers enchained in the polymer, so the ratio of those enchained monomers to the end group tells us how long the chain is.
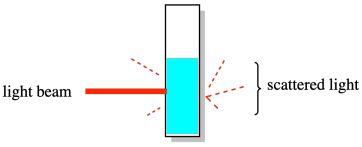
The other set of methods upon which dispersity was based gave something called the weight average molecular weight (symbol Mw). The classic example was a light-scattering experiment. In this experiment, a solution of polymer was exposed to a beam of light and the resulting scattered light -- coming from the sample in different directions -- was analyzed to determine the size of the polymer chains in the solution. The results were more heavily influenced by the larger molecules in solution. As a result, this measurement of molecular weight was always higher than measurements based on counting every single molecule.
The resulting ratio, Ð = Mw / Mn, became known as the polydispersity index or, more recently, the dispersity. Because Mw was always more strongly influenced by longer chains, it was a little bigger than Mn and therefore the dispersity was always bigger than 1.0.
Nowadays, both molecular weight and dispersity are most commonly measured using gel permeation chromatography (GPC), synonymous with size-exclusion chromatography (SEC). This method is a high-performance liquid chromatography (HPLC) technique. Solvent containing a sample of polymer is pumped through a specialized chromatography column capable of separating molecules based on their size differences. As sample emerges from the column, it is detected and recorded. Most commonly, the presence of sample in the solvent emerging from the column causes a slight change in the refractive index. A graph of refractive index versus time presents a record of the amount of sample emerging from the column at a given time. Because the column separated molecules based on size, the time axis corresponds indirectly with chain length of molecular weight.

How can the column separate molecules based on size? The column is packed with a porous material, usually insoluble polymer beads. The pore sizes vary. These pores a crucial to separation because molecules flowing through the column may tarry in the pores. Smaller molecules could become delayed in any of the pores in the material, whereas larger molecules will only be delayed in the very largest pores. Consequently, a longer elution time corresponds to a lower molecular weight.
If you injected a series of different polymers into a GPC, each having a different molecular weight distribution, you would observe each one eluting at a different time. What's more, each peak may be broader or narrower, depending on the dispersity of that particular sample.
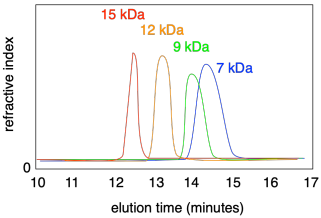
The wider the peak in GPC, the broader the distribution of molecular weights; the narrower the peaks, the more uniform are the chains. Normally a software package analyzes the curve to determine the dispersity.

Note that the x axis on a GPC trace is most commonly labeled as "elution time" and it normally runs left to right. However, often the x axis is labeled "molecular wright" because that is really the quantity we are interested in. In fact, sometimes the axis is reversed, so that peaks with higher molecular weights appear to the right, because it can feel more natural to look at it that way. You need to look carefully at the data to see how it is displayed.
There are some problems with relying on GPC for molecular weight measurements. The main difficulty is that polymers in solution tend to coil into balls, and those coils will contain greater or lesser amounts of solvent, depending on how strongly the polymer and solvent interact with each other. If it interacts more strongly with the solvent, it will pull lots more solvent molecules inside its coils. The coil has to get bigger to make room for those internal solvent molecules. If it doesn't interact strongly with the solvent, it will mostly just stick to itself, blocking the solvent molecules out. There is a broad range of behaviors in between.
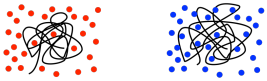
As a result, different polymers may swell to different extents in different solvents. That matters because GPC is really using size of the polymer coil as an index of its molecular weight, so comparing GPC traces of two different kinds of polymers has to be done with caution.
Problem CP1.1.
In each of the following cases, state which polymer has the higher molecular weight, and which one has a narrower dispersity

Problem CP1.2.
Calculate the molecular weight of the following samples.

Problem CP1.3.
Use NMR end group analysis to determine the degrees of polymerization in the following samples.
