
Tanabe-Sugano Diagrams
- Page ID
- 533
\( \newcommand{\vecs}[1]{\overset { \scriptstyle \rightharpoonup} {\mathbf{#1}} } \)
\( \newcommand{\vecd}[1]{\overset{-\!-\!\rightharpoonup}{\vphantom{a}\smash {#1}}} \)
\( \newcommand{\dsum}{\displaystyle\sum\limits} \)
\( \newcommand{\dint}{\displaystyle\int\limits} \)
\( \newcommand{\dlim}{\displaystyle\lim\limits} \)
\( \newcommand{\id}{\mathrm{id}}\) \( \newcommand{\Span}{\mathrm{span}}\)
( \newcommand{\kernel}{\mathrm{null}\,}\) \( \newcommand{\range}{\mathrm{range}\,}\)
\( \newcommand{\RealPart}{\mathrm{Re}}\) \( \newcommand{\ImaginaryPart}{\mathrm{Im}}\)
\( \newcommand{\Argument}{\mathrm{Arg}}\) \( \newcommand{\norm}[1]{\| #1 \|}\)
\( \newcommand{\inner}[2]{\langle #1, #2 \rangle}\)
\( \newcommand{\Span}{\mathrm{span}}\)
\( \newcommand{\id}{\mathrm{id}}\)
\( \newcommand{\Span}{\mathrm{span}}\)
\( \newcommand{\kernel}{\mathrm{null}\,}\)
\( \newcommand{\range}{\mathrm{range}\,}\)
\( \newcommand{\RealPart}{\mathrm{Re}}\)
\( \newcommand{\ImaginaryPart}{\mathrm{Im}}\)
\( \newcommand{\Argument}{\mathrm{Arg}}\)
\( \newcommand{\norm}[1]{\| #1 \|}\)
\( \newcommand{\inner}[2]{\langle #1, #2 \rangle}\)
\( \newcommand{\Span}{\mathrm{span}}\) \( \newcommand{\AA}{\unicode[.8,0]{x212B}}\)
\( \newcommand{\vectorA}[1]{\vec{#1}} % arrow\)
\( \newcommand{\vectorAt}[1]{\vec{\text{#1}}} % arrow\)
\( \newcommand{\vectorB}[1]{\overset { \scriptstyle \rightharpoonup} {\mathbf{#1}} } \)
\( \newcommand{\vectorC}[1]{\textbf{#1}} \)
\( \newcommand{\vectorD}[1]{\overrightarrow{#1}} \)
\( \newcommand{\vectorDt}[1]{\overrightarrow{\text{#1}}} \)
\( \newcommand{\vectE}[1]{\overset{-\!-\!\rightharpoonup}{\vphantom{a}\smash{\mathbf {#1}}}} \)
\( \newcommand{\vecs}[1]{\overset { \scriptstyle \rightharpoonup} {\mathbf{#1}} } \)
\(\newcommand{\longvect}{\overrightarrow}\)
\( \newcommand{\vecd}[1]{\overset{-\!-\!\rightharpoonup}{\vphantom{a}\smash {#1}}} \)
\(\newcommand{\avec}{\mathbf a}\) \(\newcommand{\bvec}{\mathbf b}\) \(\newcommand{\cvec}{\mathbf c}\) \(\newcommand{\dvec}{\mathbf d}\) \(\newcommand{\dtil}{\widetilde{\mathbf d}}\) \(\newcommand{\evec}{\mathbf e}\) \(\newcommand{\fvec}{\mathbf f}\) \(\newcommand{\nvec}{\mathbf n}\) \(\newcommand{\pvec}{\mathbf p}\) \(\newcommand{\qvec}{\mathbf q}\) \(\newcommand{\svec}{\mathbf s}\) \(\newcommand{\tvec}{\mathbf t}\) \(\newcommand{\uvec}{\mathbf u}\) \(\newcommand{\vvec}{\mathbf v}\) \(\newcommand{\wvec}{\mathbf w}\) \(\newcommand{\xvec}{\mathbf x}\) \(\newcommand{\yvec}{\mathbf y}\) \(\newcommand{\zvec}{\mathbf z}\) \(\newcommand{\rvec}{\mathbf r}\) \(\newcommand{\mvec}{\mathbf m}\) \(\newcommand{\zerovec}{\mathbf 0}\) \(\newcommand{\onevec}{\mathbf 1}\) \(\newcommand{\real}{\mathbb R}\) \(\newcommand{\twovec}[2]{\left[\begin{array}{r}#1 \\ #2 \end{array}\right]}\) \(\newcommand{\ctwovec}[2]{\left[\begin{array}{c}#1 \\ #2 \end{array}\right]}\) \(\newcommand{\threevec}[3]{\left[\begin{array}{r}#1 \\ #2 \\ #3 \end{array}\right]}\) \(\newcommand{\cthreevec}[3]{\left[\begin{array}{c}#1 \\ #2 \\ #3 \end{array}\right]}\) \(\newcommand{\fourvec}[4]{\left[\begin{array}{r}#1 \\ #2 \\ #3 \\ #4 \end{array}\right]}\) \(\newcommand{\cfourvec}[4]{\left[\begin{array}{c}#1 \\ #2 \\ #3 \\ #4 \end{array}\right]}\) \(\newcommand{\fivevec}[5]{\left[\begin{array}{r}#1 \\ #2 \\ #3 \\ #4 \\ #5 \\ \end{array}\right]}\) \(\newcommand{\cfivevec}[5]{\left[\begin{array}{c}#1 \\ #2 \\ #3 \\ #4 \\ #5 \\ \end{array}\right]}\) \(\newcommand{\mattwo}[4]{\left[\begin{array}{rr}#1 \amp #2 \\ #3 \amp #4 \\ \end{array}\right]}\) \(\newcommand{\laspan}[1]{\text{Span}\{#1\}}\) \(\newcommand{\bcal}{\cal B}\) \(\newcommand{\ccal}{\cal C}\) \(\newcommand{\scal}{\cal S}\) \(\newcommand{\wcal}{\cal W}\) \(\newcommand{\ecal}{\cal E}\) \(\newcommand{\coords}[2]{\left\{#1\right\}_{#2}}\) \(\newcommand{\gray}[1]{\color{gray}{#1}}\) \(\newcommand{\lgray}[1]{\color{lightgray}{#1}}\) \(\newcommand{\rank}{\operatorname{rank}}\) \(\newcommand{\row}{\text{Row}}\) \(\newcommand{\col}{\text{Col}}\) \(\renewcommand{\row}{\text{Row}}\) \(\newcommand{\nul}{\text{Nul}}\) \(\newcommand{\var}{\text{Var}}\) \(\newcommand{\corr}{\text{corr}}\) \(\newcommand{\len}[1]{\left|#1\right|}\) \(\newcommand{\bbar}{\overline{\bvec}}\) \(\newcommand{\bhat}{\widehat{\bvec}}\) \(\newcommand{\bperp}{\bvec^\perp}\) \(\newcommand{\xhat}{\widehat{\xvec}}\) \(\newcommand{\vhat}{\widehat{\vvec}}\) \(\newcommand{\uhat}{\widehat{\uvec}}\) \(\newcommand{\what}{\widehat{\wvec}}\) \(\newcommand{\Sighat}{\widehat{\Sigma}}\) \(\newcommand{\lt}{<}\) \(\newcommand{\gt}{>}\) \(\newcommand{\amp}{&}\) \(\definecolor{fillinmathshade}{gray}{0.9}\)Tanabe-Sugano diagrams are used in coordination chemistry to predict electromagnetic absorptions of metal coordination compounds of tetrahedral and octahedral complexes. The analysis derived from the diagrams can also be compared to experimental spectroscopic data. Armed with spectroscopic data, an approximation to the crystal field splitting energy (10Dq), generated by ligands attached to a metal center, can be found.
Crystal Field Splitting Energy
Within Crystal Field Theory, the interaction of the metal and ligand arise from the positive charge of the metal and negative charge on the ligands. The theory is developed by looking at the five degenerate d-orbitals and how the energies are changed on being surrounded by the negative point charges of the ligands. As the ligands are moved closer to the metal the repulsion between the electrons of the metal and ligands break the degeneracy of the d-orbitals. In the case of an octahedral complex 6 ligands surround a metal center with a single pair on each axis. This raises the energies of dx^2-y^2, dz^2 relative to those of dxy dxz dyz. This energy split is called Δoct. The tetrahedral energy split is about 4/9Δoct.1
Racah Parameters
Racah parameters were generated as a means to describe the effects of electron-electron repulsion within the metal complexes. The Racah parameters are A, B and C. In the case of Tanabe-Sugano diagrams each electron configuration split has an energy that can be related by the B value. A is ignored because it is roughly the same for any metal center and C generally approximated as being 1/4B. What B represents is an approximation of the bond strength between the ligand and metal.1 Comparisons between tabulated free ion B and B of a coordination complex is called the nephelauxetic ratio (the effect of reducing electron-electron repulsion via ligands). This effect is what gives rise to the spectrochemical series of ligands described later.
\[ \beta = \dfrac{\beta_{complex}}{\beta_{freeion}} \tag{1} \]
Parameters
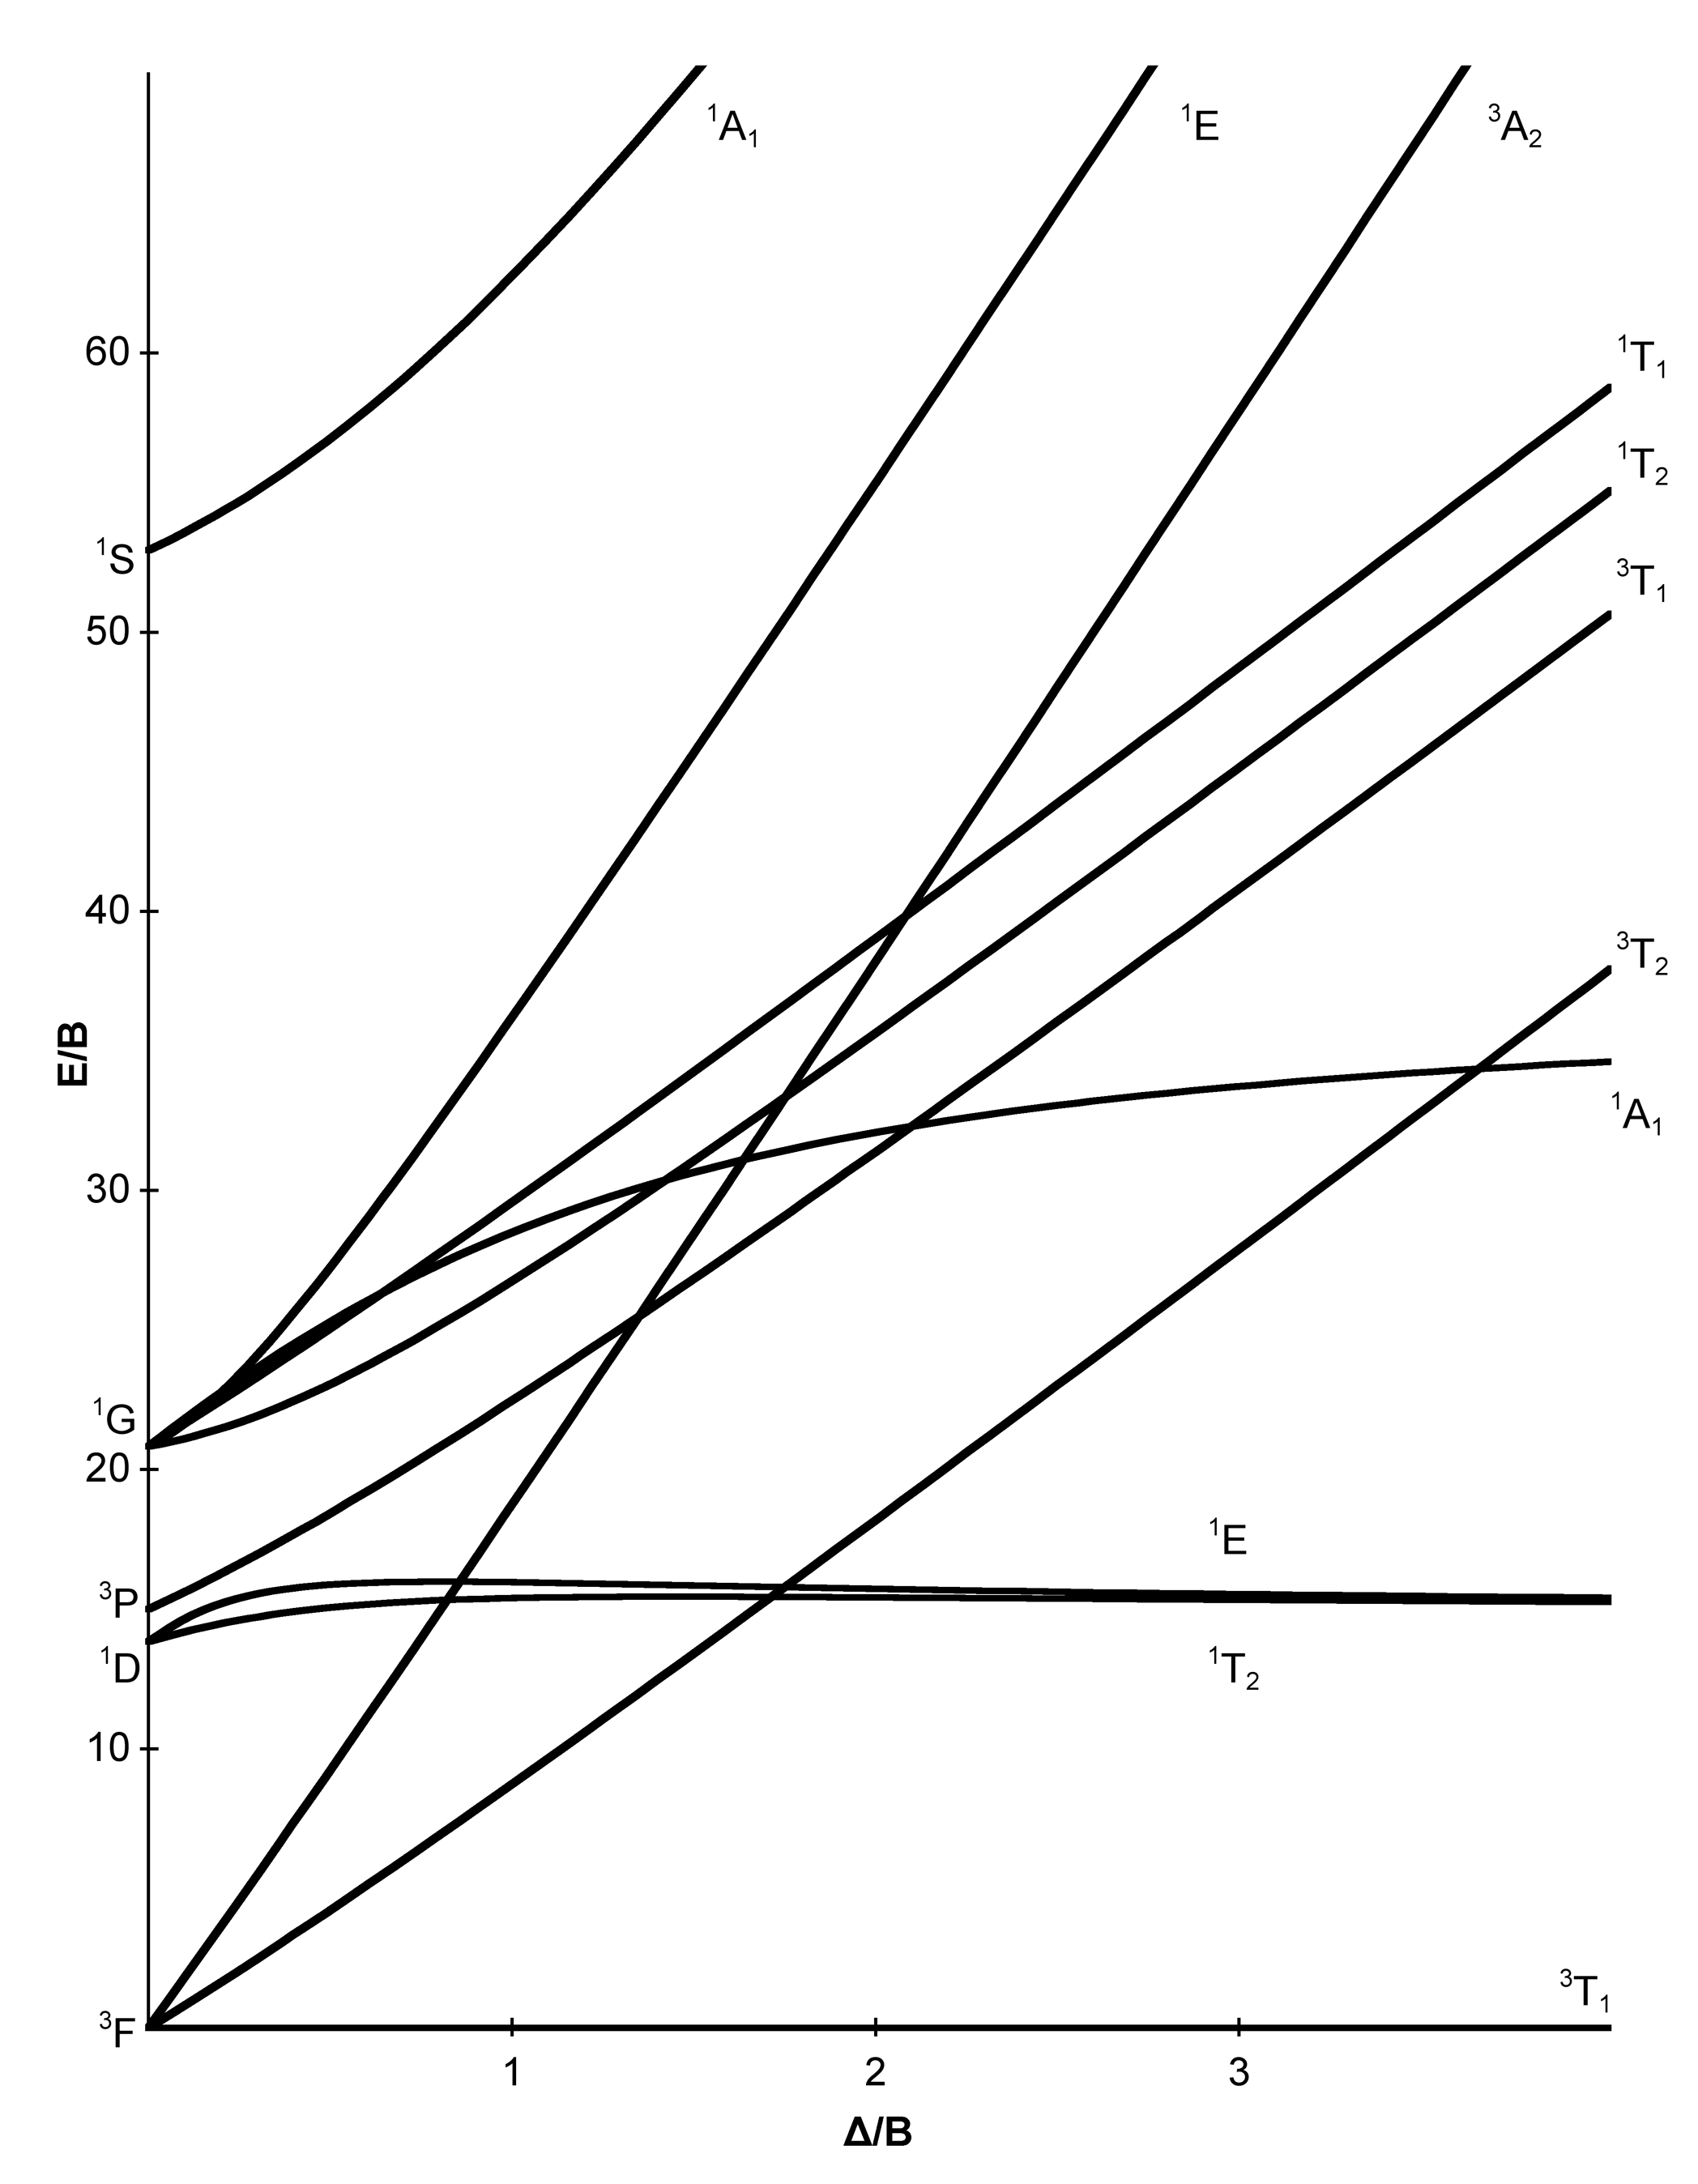
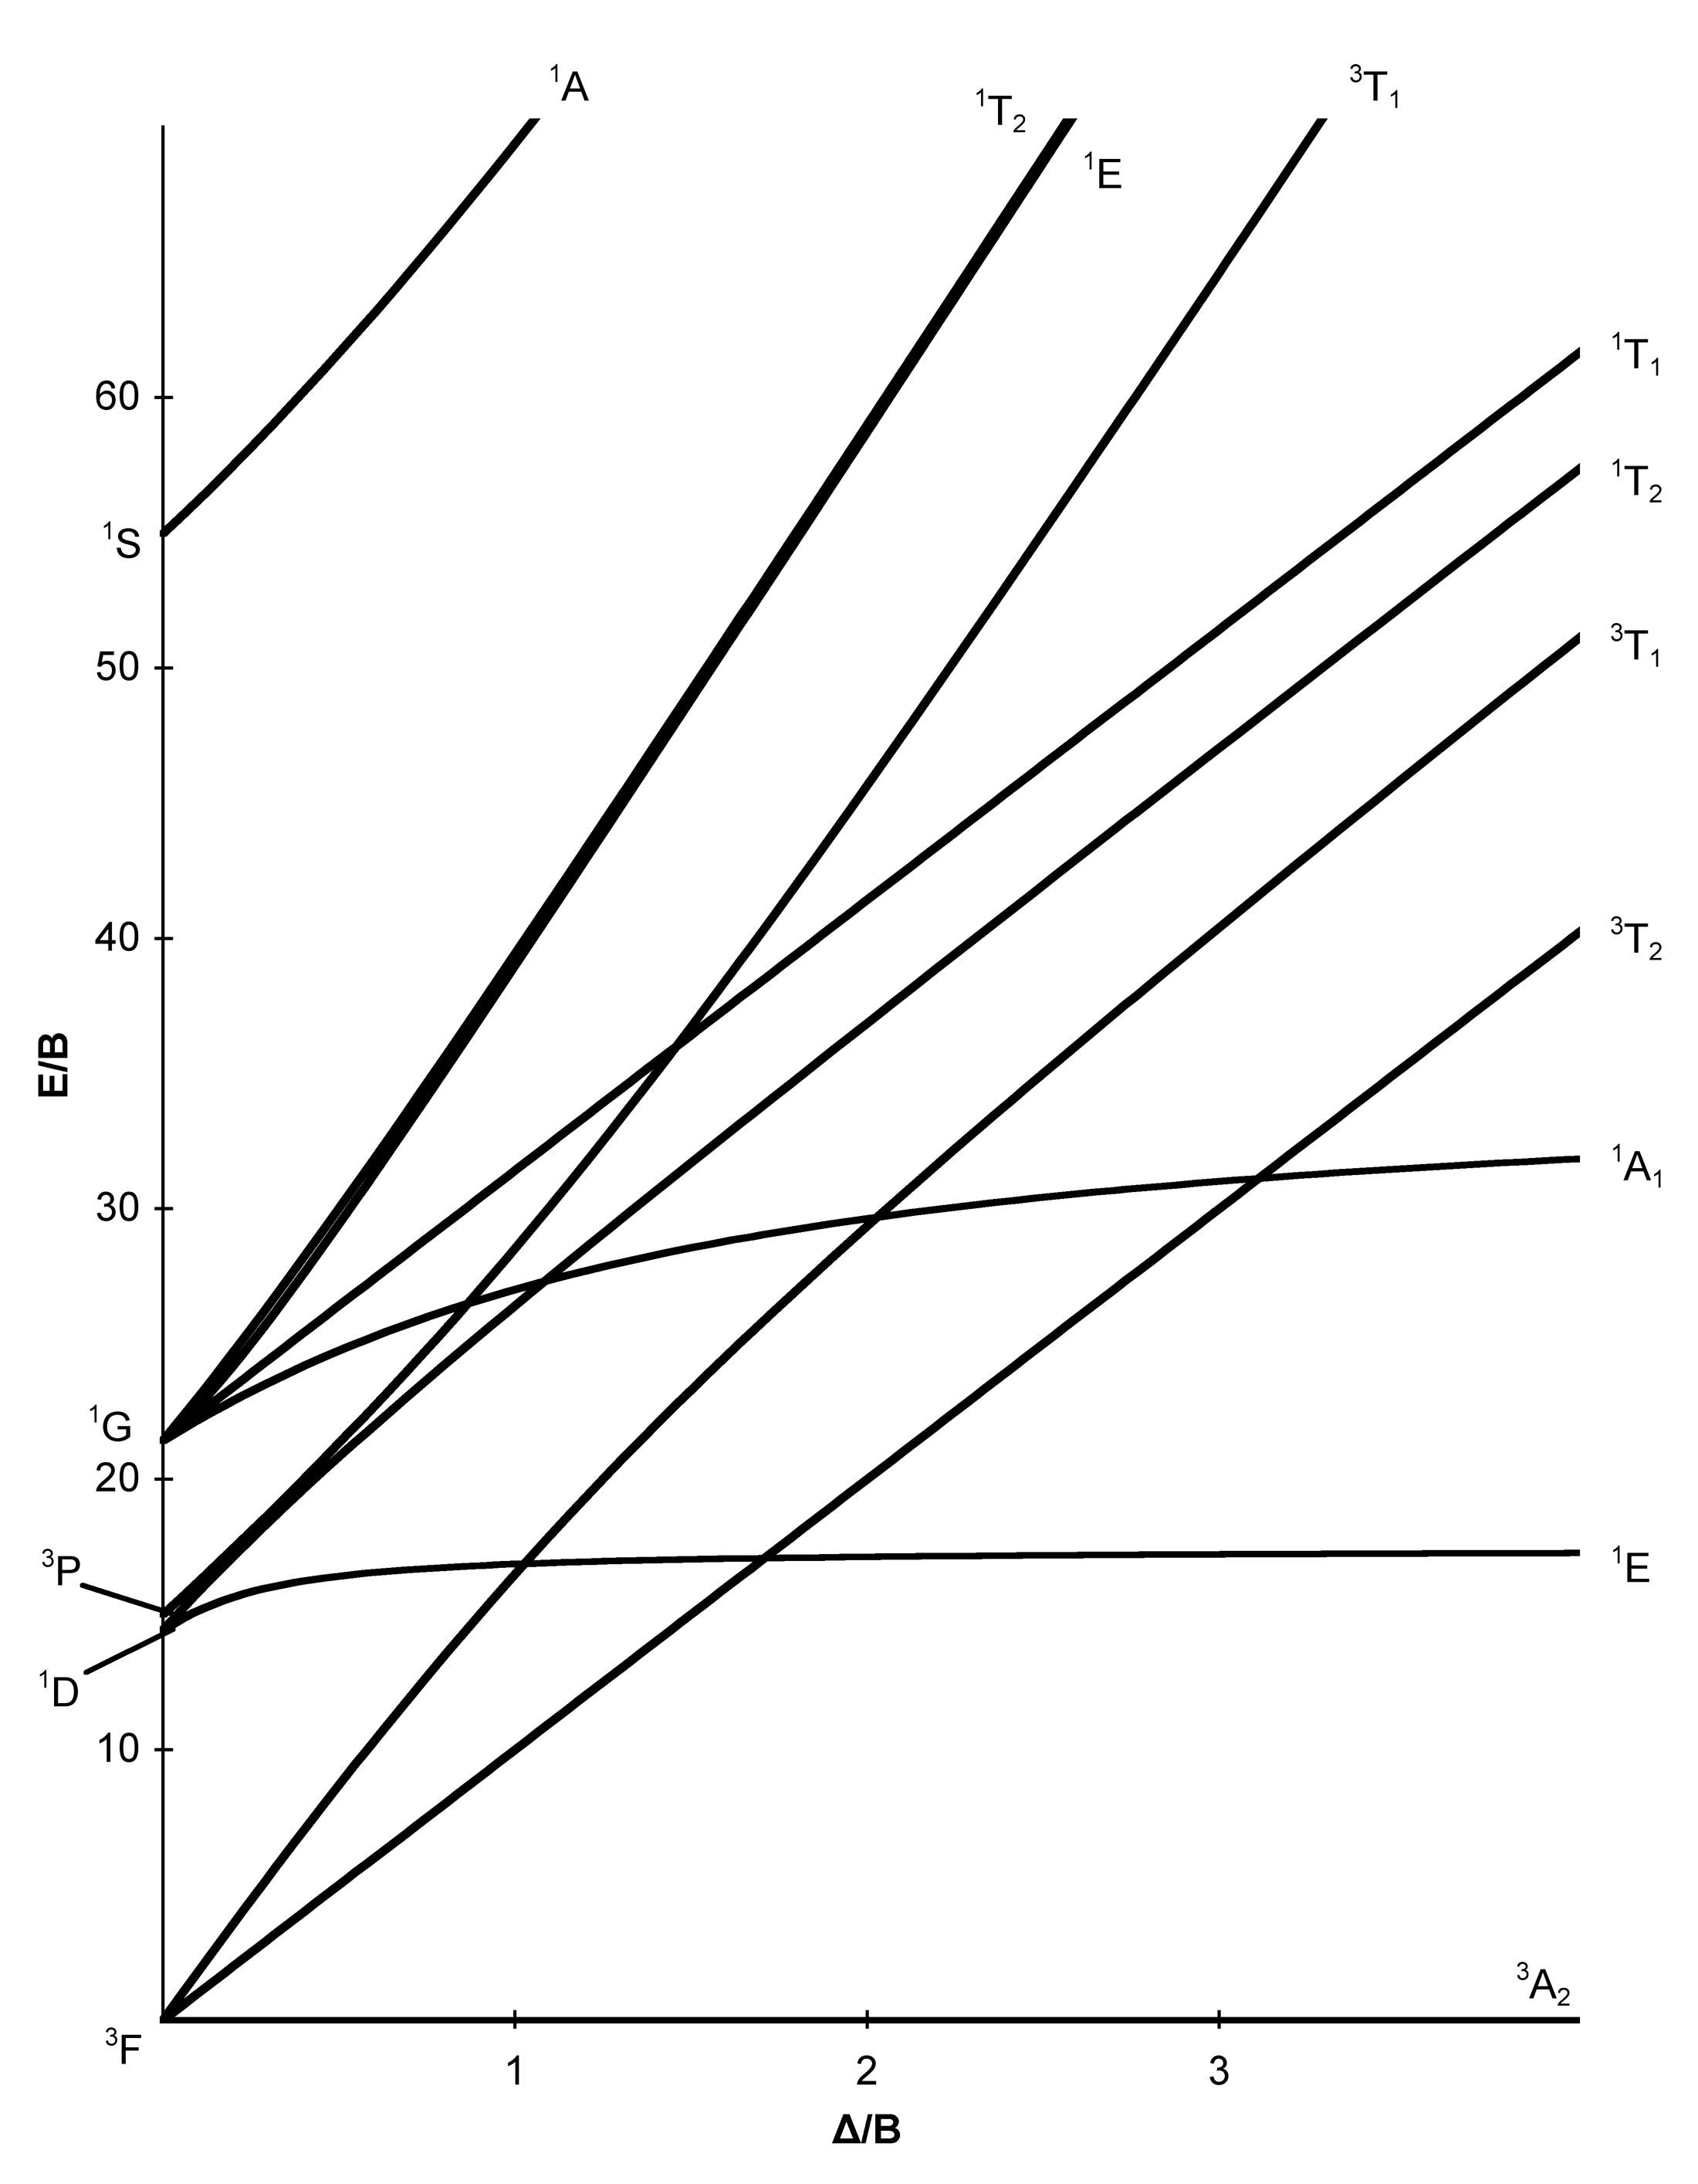
The x-axis in a Tanabe-Sugano diagram is in terms of the crystal field splitting parameter, 10Dq, or Δoct, scaled by the B Racah Parameter. The y-axis is in terms of energy of a electronic transition, E, scaled by B. Each line represents the energy of an electronic state while varying the strength of octahedral ligand field. And while only a few electronic states are spin allowed the spin forbidden electron transitions are included since spin forbidden transitions can appear in spectrum. Each term symbol is created from the splitting of term symbols from spherical to octahedral symmetry. With the relative energy ordering of the states are determined via Hund's rules.
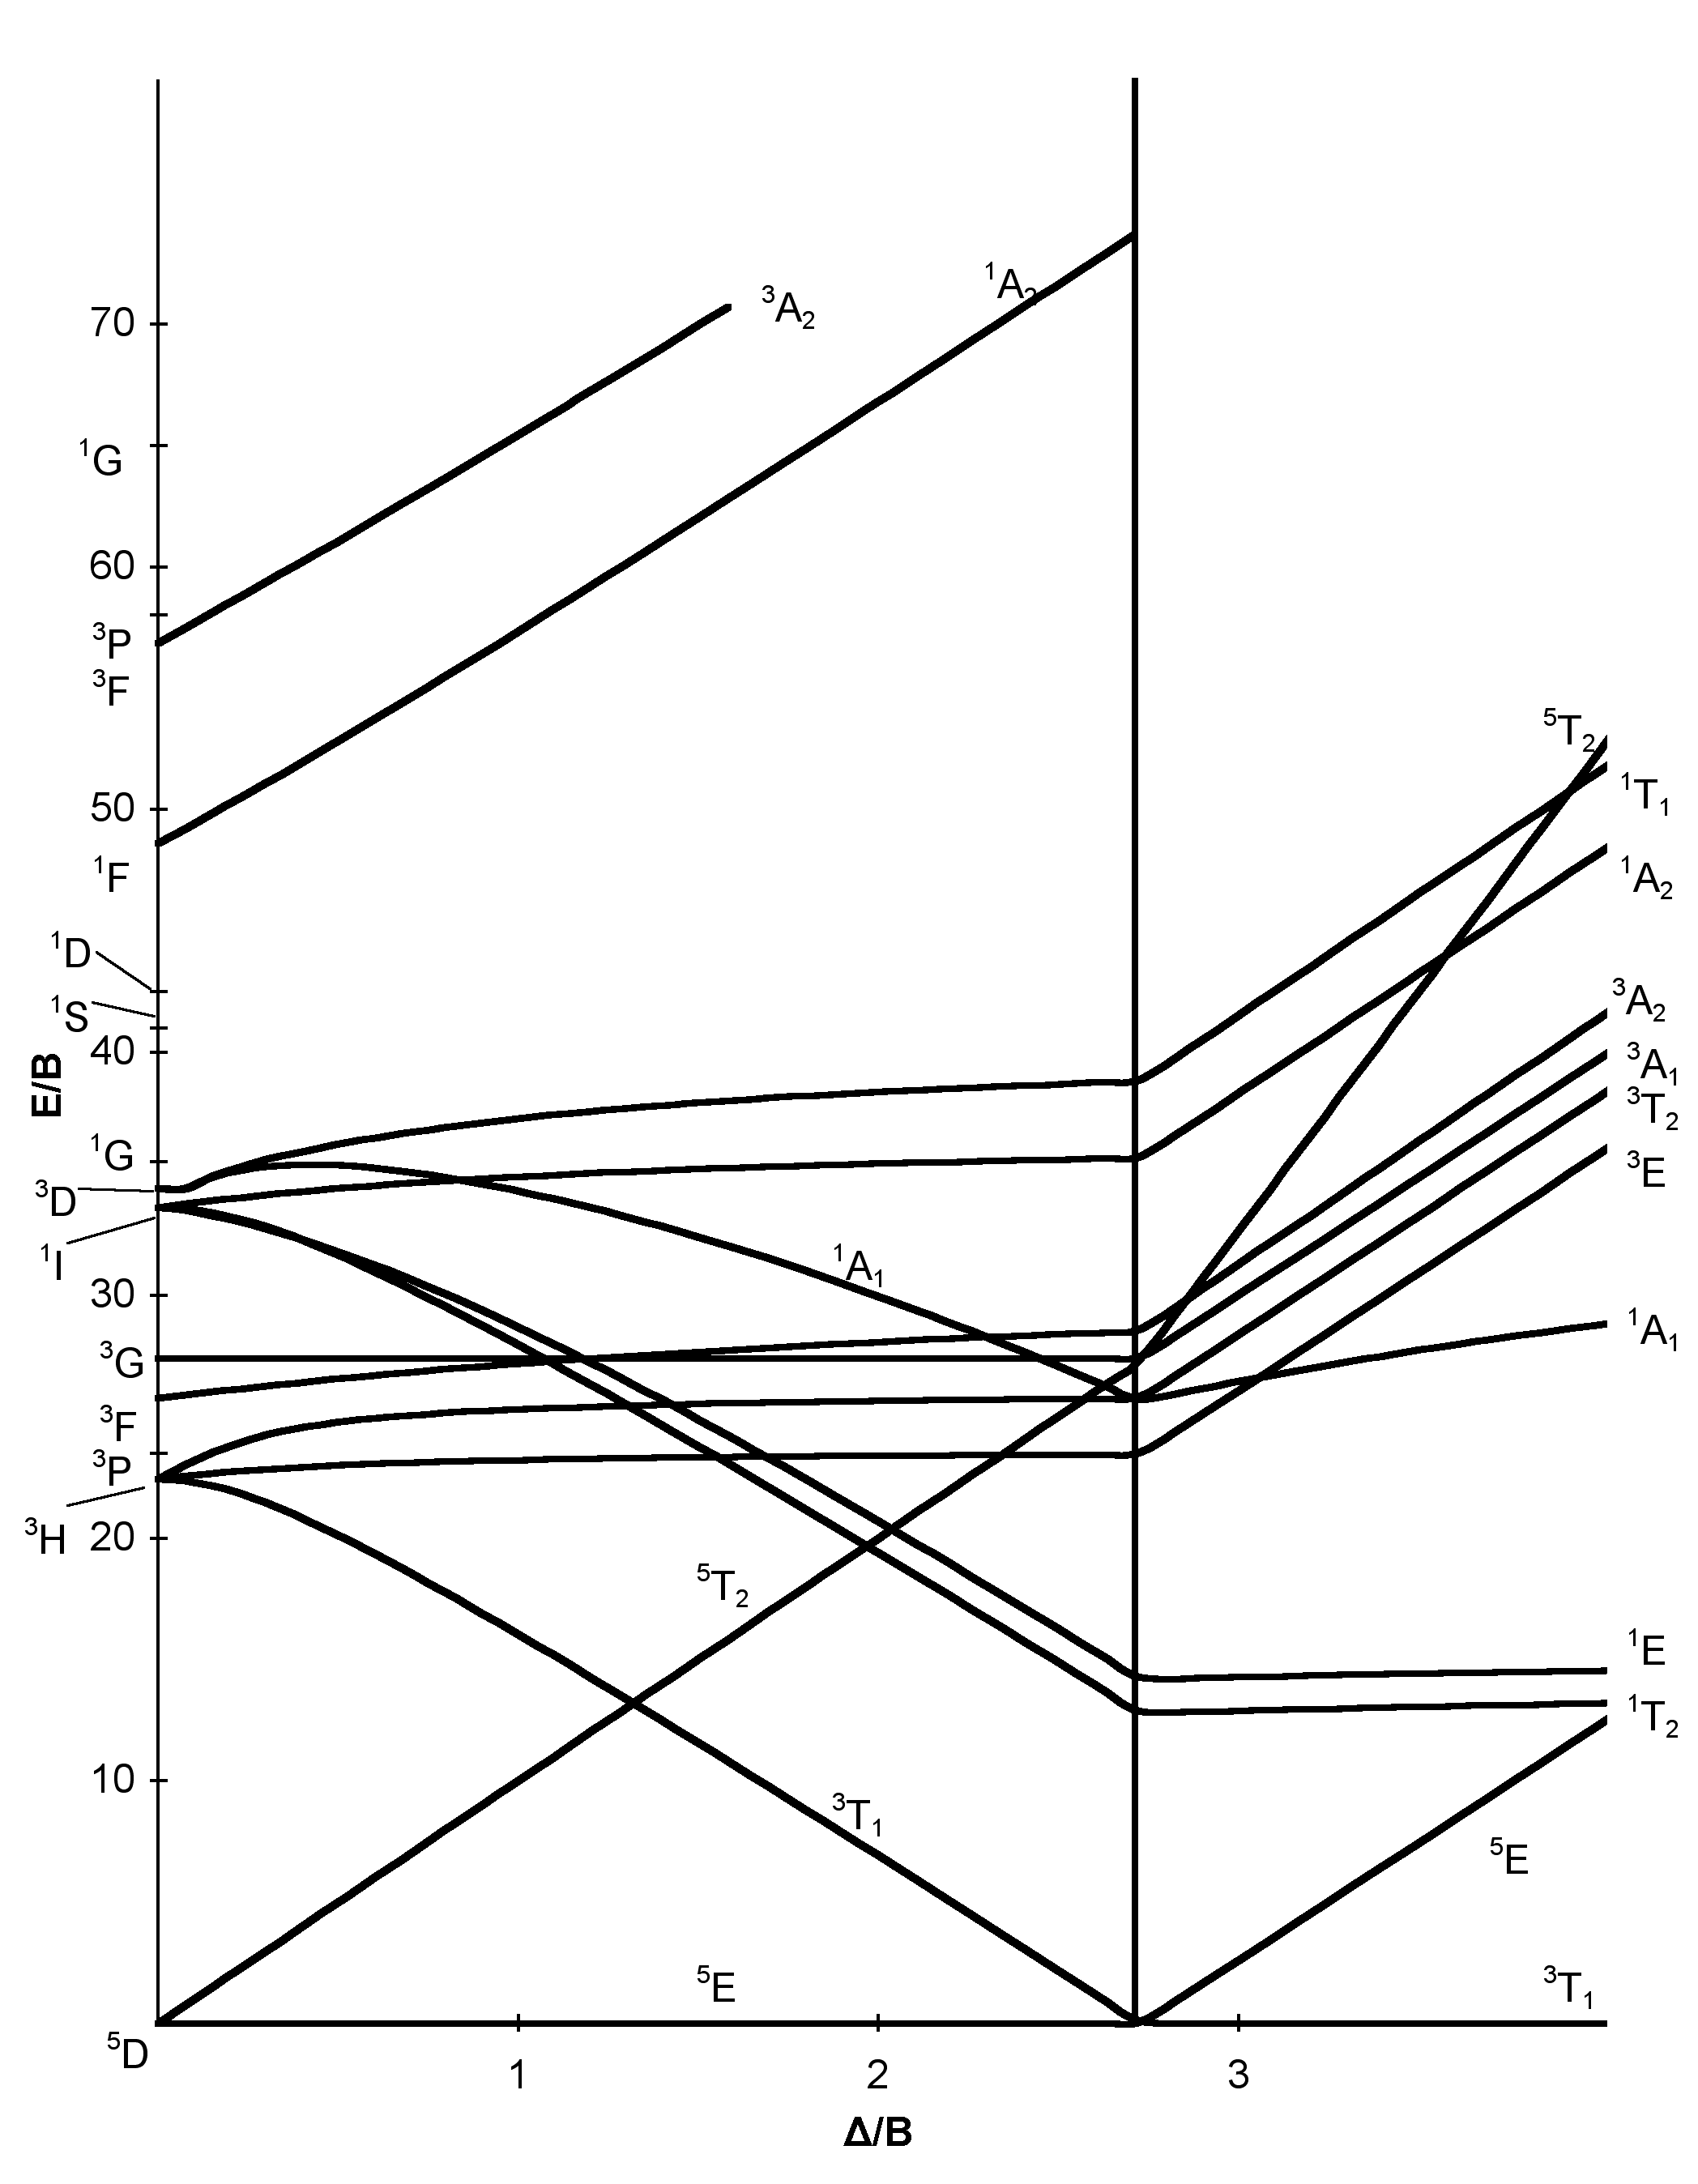
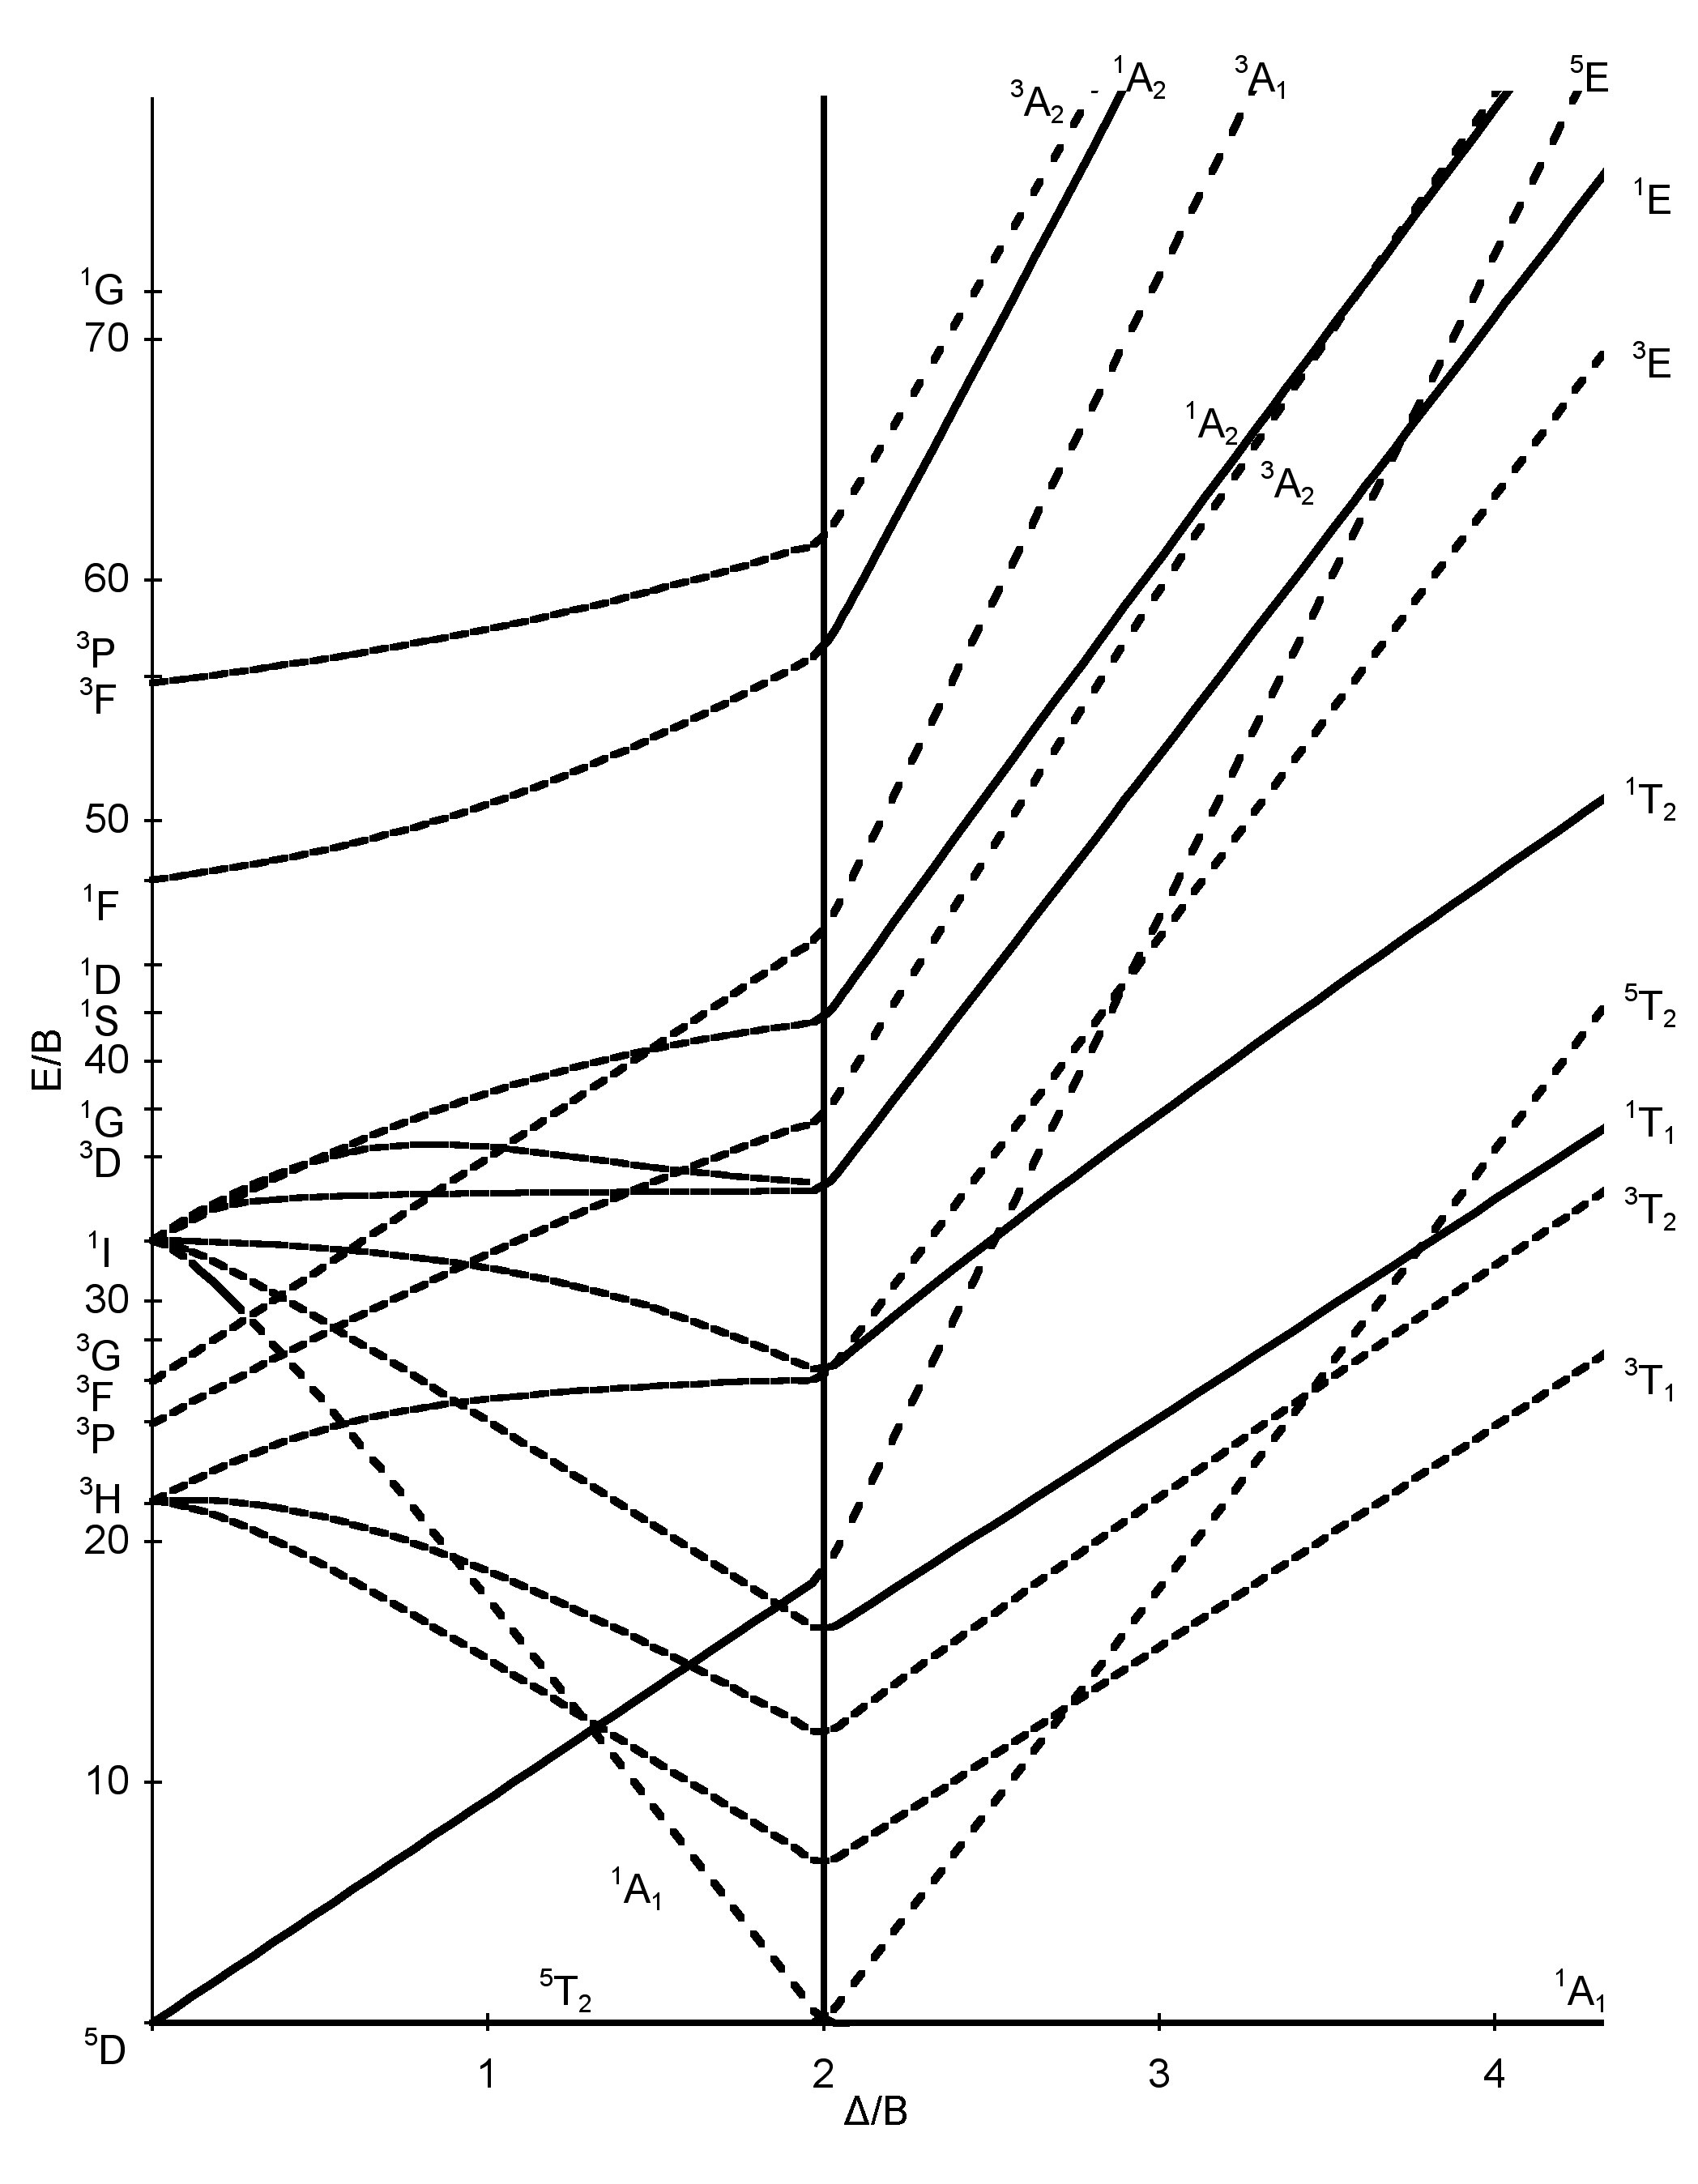
Diagrams for d4, d5, d6, and d7 metal ions have a discontinuity in energies as the ligand field is varied. The discontinuity, shown with the vertical line, represents complexes changing from high-spin to low-spin complexes. At the line, the spin pairing energy is equal to the crystal field splitting energy. To the left of the line metal complexes are high-spin as the spin pairing energy is greater than that of the ligand field splitting. To the right of the line metal complexes are low-spin as the spin pairing energy is less than that of the ligand field splitting energy.
Diagrams
 |
 |
 |
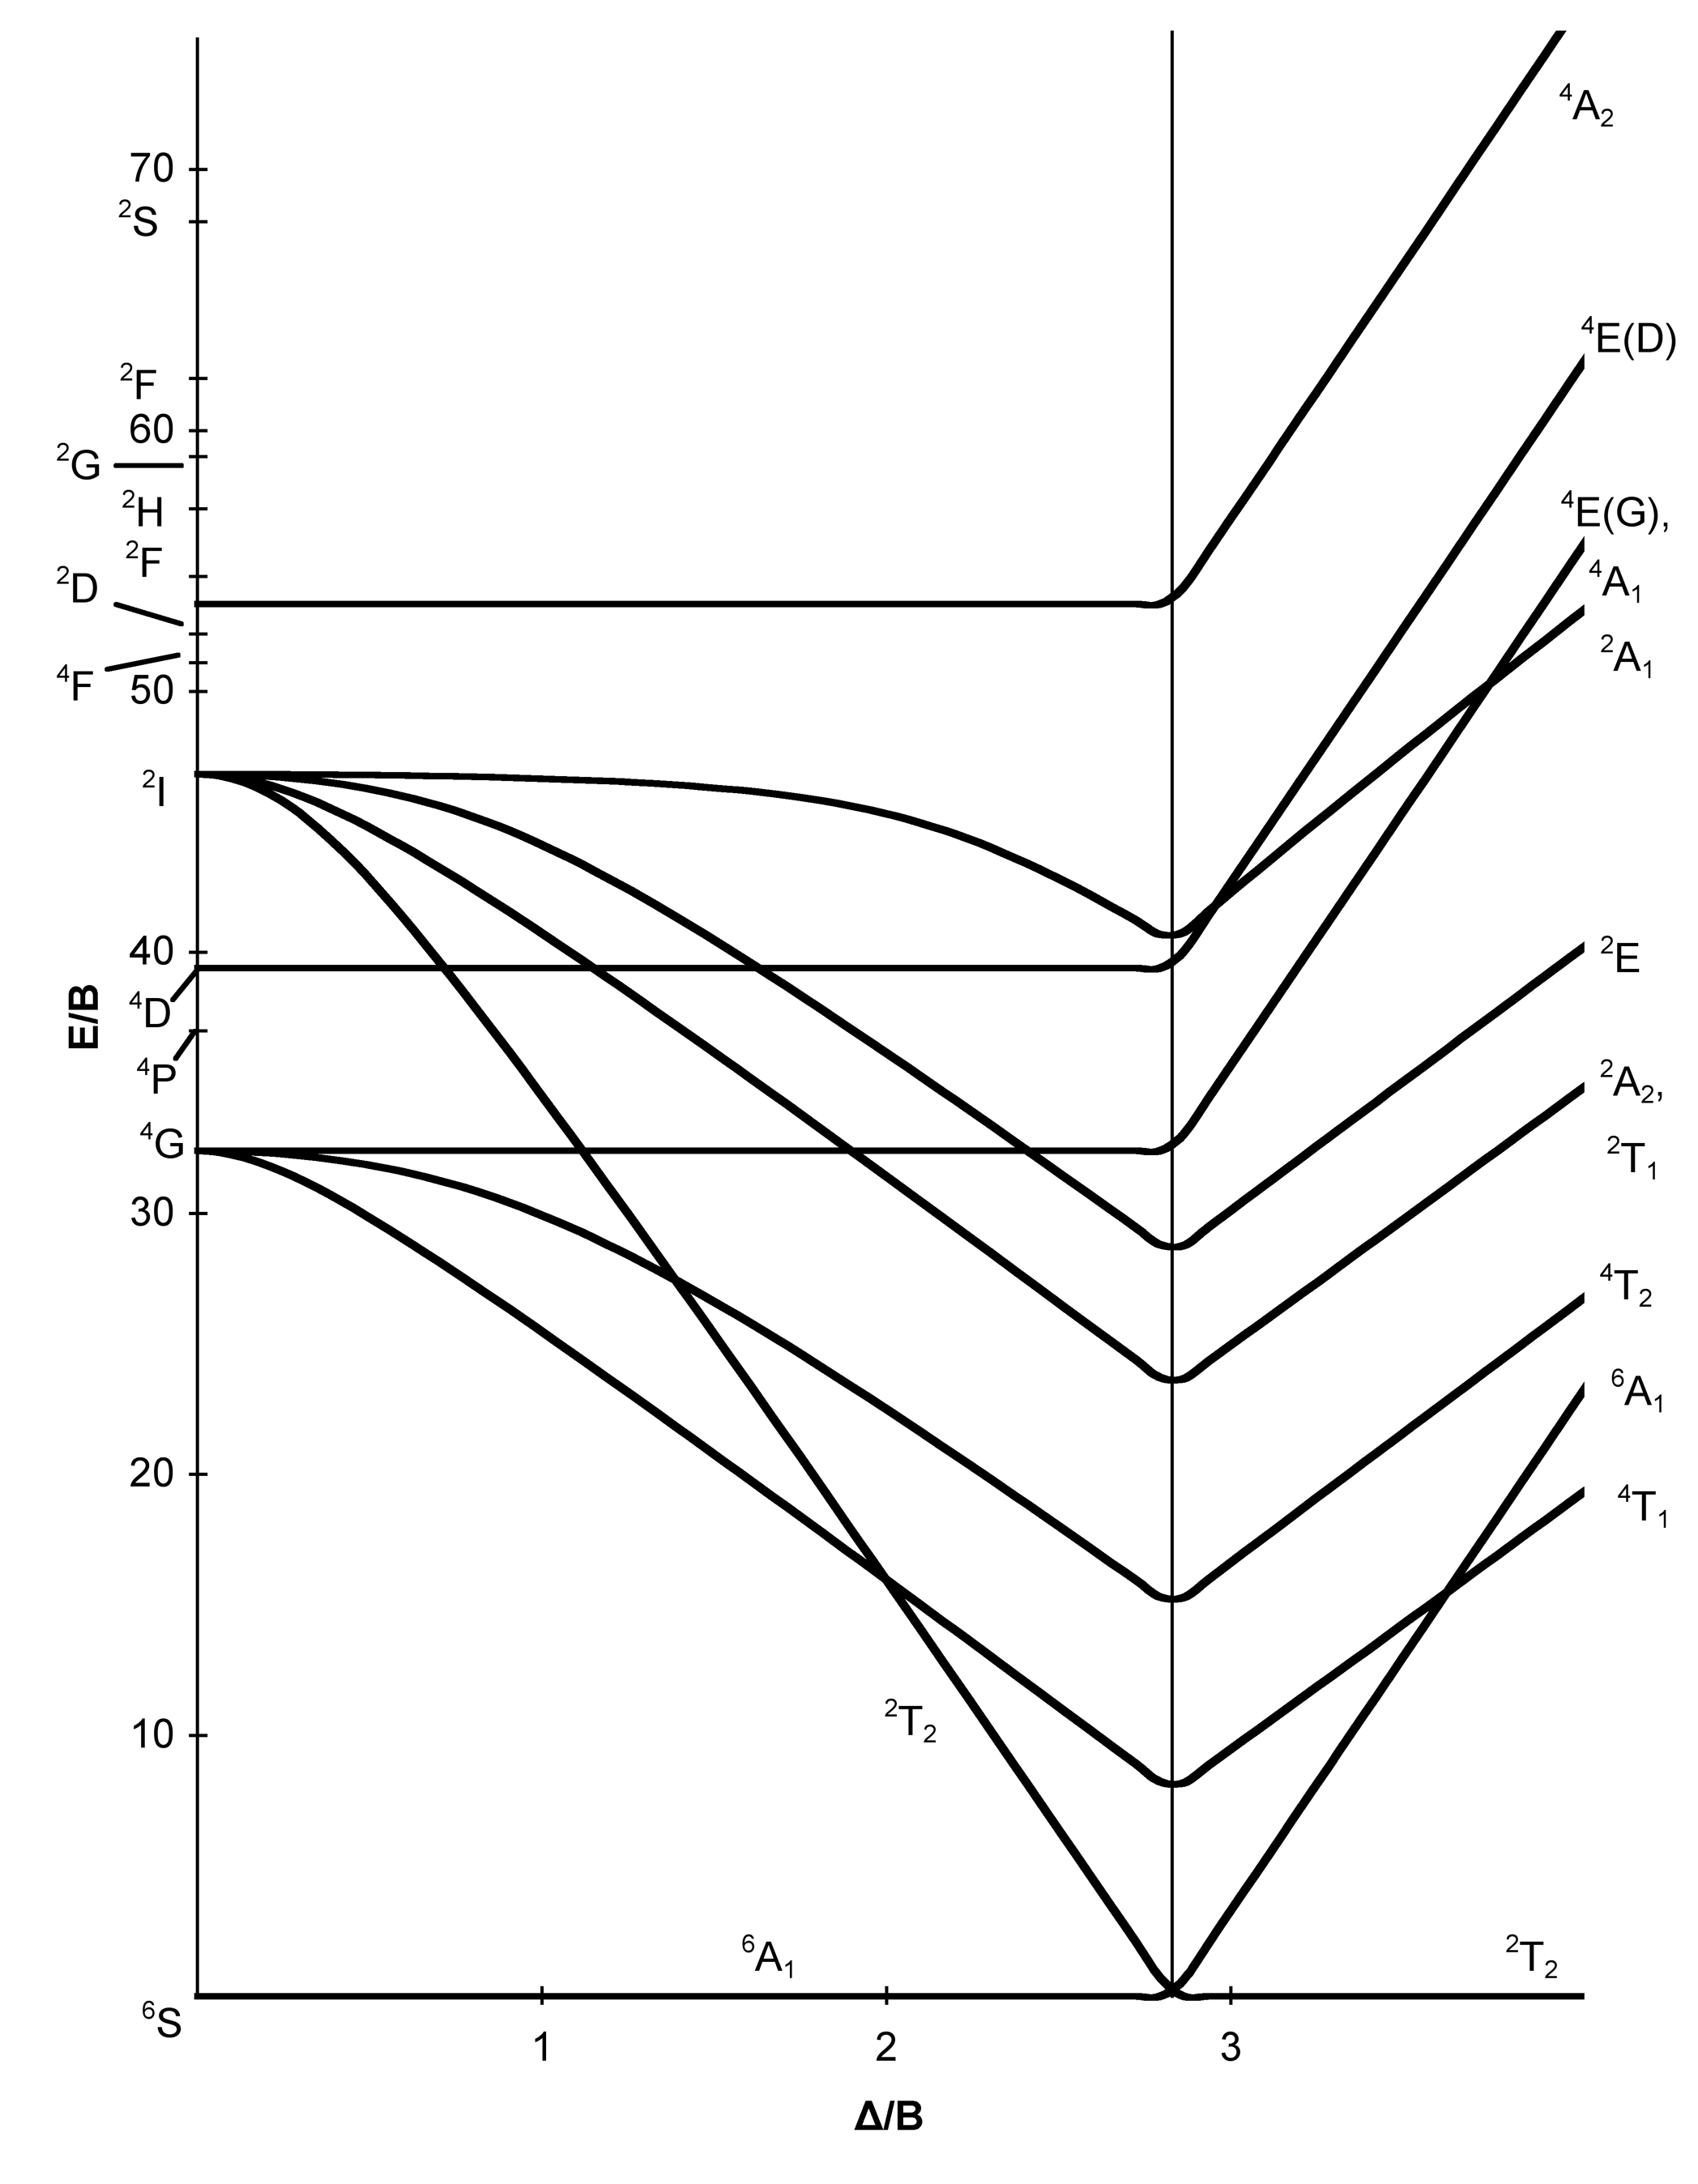 |
| d2 Tanabe-Sugano diagram | d3 Tanabe-Sugano diagram | d4 Tanabe-Sugano diagram | d5 Tanabe-Sugano diagram |
 |
 |
 |
Note: Each of the images is a thumbnail clicking on one will expand the image. |
| d6 Tanabe-Sugano diagram | d7 Tanabe-Sugano diagram | d8 Tanabe-Sugano diagram |
How to use the Diagrams
- Before looking at the diagrams the d-configuration of the metal ion must be determined.
- Choose the appropriate Tanabe-Sugano diagram matching the d-configuration (http://chemistry.bd.psu.edu/jircitano/TSdiagram.pdf has full page diagrams necessary for measurements).
- Take a spectrum of the complex and identify \(\lambda_{max}\) for spin-allowed (strong intensity) and spin forbidden (weak intensity) transitions.
- Convert \( \lambda_{max} \) to wavenumbers and generate energy ratios relative to the lowest allowed transition. (i.e. E2/E1and E3/E1)
- Using a ruler, slide it across the printed diagram until the E/B ratios between lines is equivalent to the ratios found in step 4.
- Solve for B using the E/B values (y-axis, step 4) and Δoct/B (x-axis, step 5) to yield the ligand field splitting energy 10Dq.
A Cr3+ metal complex has strong transitions and \(\lambda_{max}\) at
- 431.03 nm,
- 781.25 nm, and
- 1,250 nm.
Determine the \(Δ_{oct}\) for this complex.
Solution
- Cr has 6 electrons. Cr3+ has three electrons so its has a d-configuration of d3
- Locate the d3 Tanabe-Sugano diagram
- Convert to wavenumbers:
\[\dfrac{10^7(nm/cm)}{1250\; nm}= 8,000\; cm^{-1} \nonumber \]
\[\dfrac{10^7(nm/cm)}{781.25\; nm}= 13,600\; cm^{-1} \nonumber \]
\[\dfrac{10^7(nm/cm)}{431.03\; nm}= 23,200\; cm^{-1} \nonumber \]
- Allowed transitions are \(\ce{^4T_{1g}} \leftarrow \ce{ ^4_{\,}A_{2g}}\), \(\ce{^4T_{1g} \leftarrow ^4_{\,}A_{2g}}\) and \(\ce{^4T_{2g}\leftarrow ^4_{\,}A_{2g}}\).
| Transition | Energy cm-1 | Ratios to lowest |
|---|---|---|
| \(\ce{^4T_{1g}} \leftarrow \ce{ ^4_{\,}A_{2g}}\) | 23,200 | 2.9 |
| \(\ce{^4T_{1g} \leftarrow ^4_{\,}A_{2g}}\) | 13,600 | 1.7 |
| \(\ce{^4T_{2g}\leftarrow ^4_{\,}A_{2g}}\) | 8,000 | 1 |
- Sliding the ruler perpendicular to the x-axis of the d3 diagram yields the following values:
| Δoct/B | 10 | 20 | 30 | 40 |
|---|---|---|---|---|
| Height E(ν3)/B | 29 | 45 | 64 | 84 |
| Height E(ν2)/B | 17 | 30 | 40 | 51 |
| Height E(ν1)/B | 10 | 20 | 30 | 40 |
| Ratio E(ν3)/E(ν1) | 2.9 | 2.25 | 2.13 | 2.1 |
| Ratio E(ν2)/E(ν1) | 1.7 | 1.5 | 1.33 | 1.275 |
- Based on the two tables above it should be assessed that the Δoct/B value is 10. B is found by finding the dividing E by the height.
| Energy cm-1 | Height | B |
|---|---|---|
| 23,200 | 29 | 800 |
| 13,600 | 17 | 800 |
| 8,000 | 10 | 800 |
- Next multiply Δoct/B by B to yield the Δoct energy. \[10 \times 800 = 8000\; cm^{-1}=Δ_{oct} \nonumber \]
Each problem is of varying complexity as several steps may be needed to find the correct Δoct/B values that yield the proper energy ratios.
Nephelauxetic Effect
Imagine you had an abundance of V(H2O)63+ (d2) which has two absorptions. If you had no other available metal centers, but an abundance of ligands, the complex's absorption spectrum (therefore its color) could be changed via application of the spectrochemical series:
I− < Br− < S2− < SCN− < Cl− < NO3− < N3− < F− < OH− < C2O42− ≈ H2O < NCS− < CH3CN < py (pyridine) < NH3 < en (ethylenediamine) < bipy (2,2'-bipyridine) < phen (1,10-phenanthroline) < NO2− < PPh3 < CN− ≈ CO
If you wanted higher energy absorptions (shift toward purple colors) you use ligands to the right of H2O and if you wanted redder colors attach ligands to the left of H2O. Here you could measure the nephelauxetic ratio of the ligands to compare how each ligand modifies the B Racah parameter. The series of complexes would also serve as a very good demonstration for a classroom. The reason behind modifying metal ligands has implications for commercial products. Unique colors in ceramics and glass products can be traced back to many metal compounds.
References
- H.A.O. Hill, P. Day. Physical Methods in Advanced Inorganic Chemistry. John Wiley & Sons, Inc. 1968.
- Tanabe, Yukito; Sugano, Satoru (1954). "On the absorption spectra of complex ions I". Journal of the Physical Society of Japan 9 (5): 753–766.
- Tanabe, Yukito; Sugano, Satoru (1954). "On the absorption spectra of complex ions II". Journal of the Physical Society of Japan 9 (5): 766–779
- Tanabe, Yukito; Sugano, Satoru (1956). "On the absorption spectra of complex ions III". Journal of the Physical Society of Japan 11 (8): 864–877.
Problems
- For a d7 metal ion determine the energy ratios for allowed transitions at Δoct/B of 20.
- For a d6metal ion of Δoct/B = 30 and B=530 cm-1 what would the energies of the 5 allowed transitions be? How many are in the UV-Vis range? How many are in the IR range?
- Write out the allowed transitions for a d5 metal ion in a E/B> 28 ligand field.
- A d4 complex exhibits absorptions at 5500 cm-1 (strong) and 31350 cm-1 (weak). What are the transitions that are being exhibited in the complex? What is the corresponding Δoct for the complex?
- A spectrum of d7 metal complex seemingly exhibits only two intense transitions. What is the Δoct/B that this situation occurs? Please use reference to specific transitions and energy splitting.
Answers
- Δoct/B of 20 yields E/B values of 38, 32, 18. Ratios then are 2.11 and 1.78
- Δoct/B = 30 yields E/B heights of 27, 40, 57, 65, 85. Energies are then 14310, 21200, 30210, 34450 and 45050 cm-1. All are in the UV-Vis range. *note you need to infer the E/B value for the last transition as the diagram does not extend that far up.
- 2A2g<-2T2g, 2T1g<-2T2g, 2Eg<-2T2g, and 2A1g<-2T2g.
- 31,350/5,500 gives a ratio of 5.7/1. The only Δoct/B value that matches is at 10. B value is then 550 cm-1. Δoctequals 5500 cm-1.
- Three transitions are generated at low Δoct/B. However, at about a value of Δoct/B = 13 the transitions 4A2g<-4T1g, and 4T1g<-4T1g have the same energies which results in the appearance of only two absorptions.
Contributors and Attributions
- Evan Sarina, UC Davis