
2.5: Enzyme Kinetics and Inhibition
- Page ID
- 189843

\( \newcommand{\vecs}[1]{\overset { \scriptstyle \rightharpoonup} {\mathbf{#1}} } \)
\( \newcommand{\vecd}[1]{\overset{-\!-\!\rightharpoonup}{\vphantom{a}\smash {#1}}} \)
\( \newcommand{\id}{\mathrm{id}}\) \( \newcommand{\Span}{\mathrm{span}}\)
( \newcommand{\kernel}{\mathrm{null}\,}\) \( \newcommand{\range}{\mathrm{range}\,}\)
\( \newcommand{\RealPart}{\mathrm{Re}}\) \( \newcommand{\ImaginaryPart}{\mathrm{Im}}\)
\( \newcommand{\Argument}{\mathrm{Arg}}\) \( \newcommand{\norm}[1]{\| #1 \|}\)
\( \newcommand{\inner}[2]{\langle #1, #2 \rangle}\)
\( \newcommand{\Span}{\mathrm{span}}\)
\( \newcommand{\id}{\mathrm{id}}\)
\( \newcommand{\Span}{\mathrm{span}}\)
\( \newcommand{\kernel}{\mathrm{null}\,}\)
\( \newcommand{\range}{\mathrm{range}\,}\)
\( \newcommand{\RealPart}{\mathrm{Re}}\)
\( \newcommand{\ImaginaryPart}{\mathrm{Im}}\)
\( \newcommand{\Argument}{\mathrm{Arg}}\)
\( \newcommand{\norm}[1]{\| #1 \|}\)
\( \newcommand{\inner}[2]{\langle #1, #2 \rangle}\)
\( \newcommand{\Span}{\mathrm{span}}\) \( \newcommand{\AA}{\unicode[.8,0]{x212B}}\)
\( \newcommand{\vectorA}[1]{\vec{#1}} % arrow\)
\( \newcommand{\vectorAt}[1]{\vec{\text{#1}}} % arrow\)
\( \newcommand{\vectorB}[1]{\overset { \scriptstyle \rightharpoonup} {\mathbf{#1}} } \)
\( \newcommand{\vectorC}[1]{\textbf{#1}} \)
\( \newcommand{\vectorD}[1]{\overrightarrow{#1}} \)
\( \newcommand{\vectorDt}[1]{\overrightarrow{\text{#1}}} \)
\( \newcommand{\vectE}[1]{\overset{-\!-\!\rightharpoonup}{\vphantom{a}\smash{\mathbf {#1}}}} \)
\( \newcommand{\vecs}[1]{\overset { \scriptstyle \rightharpoonup} {\mathbf{#1}} } \)
\( \newcommand{\vecd}[1]{\overset{-\!-\!\rightharpoonup}{\vphantom{a}\smash {#1}}} \)
\(\newcommand{\avec}{\mathbf a}\) \(\newcommand{\bvec}{\mathbf b}\) \(\newcommand{\cvec}{\mathbf c}\) \(\newcommand{\dvec}{\mathbf d}\) \(\newcommand{\dtil}{\widetilde{\mathbf d}}\) \(\newcommand{\evec}{\mathbf e}\) \(\newcommand{\fvec}{\mathbf f}\) \(\newcommand{\nvec}{\mathbf n}\) \(\newcommand{\pvec}{\mathbf p}\) \(\newcommand{\qvec}{\mathbf q}\) \(\newcommand{\svec}{\mathbf s}\) \(\newcommand{\tvec}{\mathbf t}\) \(\newcommand{\uvec}{\mathbf u}\) \(\newcommand{\vvec}{\mathbf v}\) \(\newcommand{\wvec}{\mathbf w}\) \(\newcommand{\xvec}{\mathbf x}\) \(\newcommand{\yvec}{\mathbf y}\) \(\newcommand{\zvec}{\mathbf z}\) \(\newcommand{\rvec}{\mathbf r}\) \(\newcommand{\mvec}{\mathbf m}\) \(\newcommand{\zerovec}{\mathbf 0}\) \(\newcommand{\onevec}{\mathbf 1}\) \(\newcommand{\real}{\mathbb R}\) \(\newcommand{\twovec}[2]{\left[\begin{array}{r}#1 \\ #2 \end{array}\right]}\) \(\newcommand{\ctwovec}[2]{\left[\begin{array}{c}#1 \\ #2 \end{array}\right]}\) \(\newcommand{\threevec}[3]{\left[\begin{array}{r}#1 \\ #2 \\ #3 \end{array}\right]}\) \(\newcommand{\cthreevec}[3]{\left[\begin{array}{c}#1 \\ #2 \\ #3 \end{array}\right]}\) \(\newcommand{\fourvec}[4]{\left[\begin{array}{r}#1 \\ #2 \\ #3 \\ #4 \end{array}\right]}\) \(\newcommand{\cfourvec}[4]{\left[\begin{array}{c}#1 \\ #2 \\ #3 \\ #4 \end{array}\right]}\) \(\newcommand{\fivevec}[5]{\left[\begin{array}{r}#1 \\ #2 \\ #3 \\ #4 \\ #5 \\ \end{array}\right]}\) \(\newcommand{\cfivevec}[5]{\left[\begin{array}{c}#1 \\ #2 \\ #3 \\ #4 \\ #5 \\ \end{array}\right]}\) \(\newcommand{\mattwo}[4]{\left[\begin{array}{rr}#1 \amp #2 \\ #3 \amp #4 \\ \end{array}\right]}\) \(\newcommand{\laspan}[1]{\text{Span}\{#1\}}\) \(\newcommand{\bcal}{\cal B}\) \(\newcommand{\ccal}{\cal C}\) \(\newcommand{\scal}{\cal S}\) \(\newcommand{\wcal}{\cal W}\) \(\newcommand{\ecal}{\cal E}\) \(\newcommand{\coords}[2]{\left\{#1\right\}_{#2}}\) \(\newcommand{\gray}[1]{\color{gray}{#1}}\) \(\newcommand{\lgray}[1]{\color{lightgray}{#1}}\) \(\newcommand{\rank}{\operatorname{rank}}\) \(\newcommand{\row}{\text{Row}}\) \(\newcommand{\col}{\text{Col}}\) \(\renewcommand{\row}{\text{Row}}\) \(\newcommand{\nul}{\text{Nul}}\) \(\newcommand{\var}{\text{Var}}\) \(\newcommand{\corr}{\text{corr}}\) \(\newcommand{\len}[1]{\left|#1\right|}\) \(\newcommand{\bbar}{\overline{\bvec}}\) \(\newcommand{\bhat}{\widehat{\bvec}}\) \(\newcommand{\bperp}{\bvec^\perp}\) \(\newcommand{\xhat}{\widehat{\xvec}}\) \(\newcommand{\vhat}{\widehat{\vvec}}\) \(\newcommand{\uhat}{\widehat{\uvec}}\) \(\newcommand{\what}{\widehat{\wvec}}\) \(\newcommand{\Sighat}{\widehat{\Sigma}}\) \(\newcommand{\lt}{<}\) \(\newcommand{\gt}{>}\) \(\newcommand{\amp}{&}\) \(\definecolor{fillinmathshade}{gray}{0.9}\)The kinetics of reactions involving enzymes are a little bit different from other reactions. First of all, there are sometimes lots of steps involved. Also, the reaction involves a huge, complicated molecule, the enzyme. Sometimes it's hard to figure out what's going inside that enzyme.
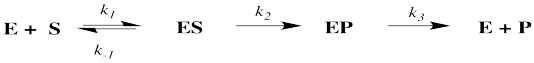
Nevertheless, we can think about that reaction and break it down into just a few different steps. First, the enzyme has to bind the substrate. Second, the enzyme has to transform that substrate into the product. Third, the product must be released.
A reaction progress diagram for this process looks something like this:
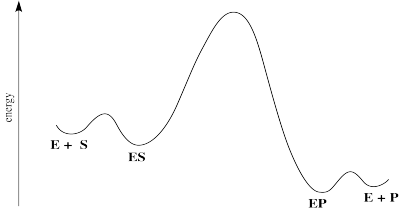
There are some energetic considerations on this diagram that we should think about. In normal reactions, the intermediates that form along the reaction pathway are higher in energy than either the reactants or the products. We can think of the reactants climbing up a hilly mountain range and sliding down the other side, all the way to products.
In many cases of catalysis, the enzyme-substrate complex (ES) is actually lower in energy than the free enzyme and substrate. That's because of the intermolecular attractions that hold the substrate in place within the enzyme. That's good; if the enzyme is able to hold the substrate tightly, it will be able to do its work. Of course, if the ES is too stable, it will just sit there; nothoing will ever happen to it.
The middle hump of the diagram actually represents any number of steps. In reality, we might better represent those steps as a series of individual hills and valleys. We're simplifying a little bit by picturing it this way. Nevertheless, it may often be the case that the highest energy, slowest step of this reaction falls somewhere among these steps.
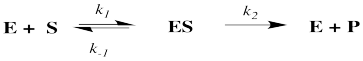
When we looked at reaction kinetics earlier, we made the assumption that anything after the rate determining step had little effect on the rate of the reaction. We'll make that approximation here, too, and think about two main components of the reaction. First, the substrate must be bound in an enzyme-substrate complex. Second, the enzyme has to do something with that substrate, and turn it into somethings else.
Before we start thinking very hard about rate constants, we'll take a look at what data typically looks like in an enzyme-catalysed reaction. Presumably, substrate is required to get anywhere in the reaction, and so the rate of the reaction should go faster if the substrate concentration increases. The more substrate we have reacting, the fatser we should make product.
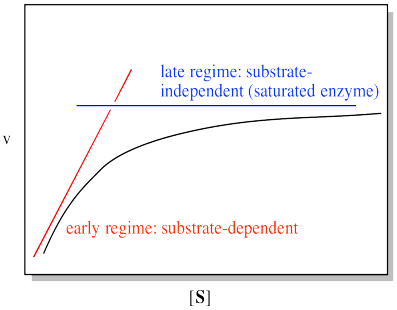
That's true, but only up to a point. Suppose we add more and more substrate to an enzymatic reaction. Look at the following graph of what happens to the rate (usually represented in biochemistry as v for velocity).
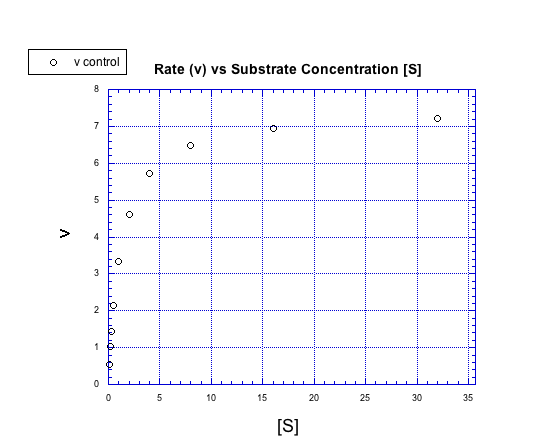
Instead of forming a straight line, the concentration / rate plot is curved. At first, the rate increases with added substrate. Eventually, however, the rate levels off, no matter how much substrate is added.
We can think about the plot falling into two regimes. There is the early regime, at low substrate concentration. Across this range of substrate concentrations, the rate increases with added substrate. There is also the late regime, at high substrate concentration. Across that range of substrate concentrations, the rate remains flat.
There is a simple explanation for this behaviour. It has to do with how enzymatic reactions are carried out, and with catalytic reactions in general. The whole point of a catalyst is that, in addition to facilitating a reaction, it is regenerated. It gets recycled: each enzyme molecule is used multiple times to convert many substrate molecules into product. Consequently, only a very tiny amount of enzyme is needed to efficiently carry out the reaction. The ratio of substrate to enzyme molecules in a typical reaction may be in the millions.
That's all very good in terms of efficiency. However, at some point, it seems like some of those substrate molecules are going to be left waiting around while enzymes are busily working on others. If the enzyme has to bind the substrate and do some work on it, we could easily have a situation in which all the enzyme molecules are full. Additional substrate molecules have to wait their turn. At that point, adding additional substrate doesn't speed up the reaction. We refer to the enzyme as "saturated" at that point, meaning it can't add any more substrate.
- the reaction reaches a maximum rate at high substrate levels
- additional substrate does not increase the rate beyond that point
- the enzyme is saturated with substrate and cannot accommodate more
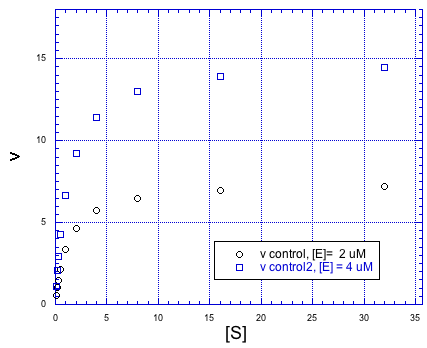
Of course, if we added more enzyme, we could handle more substrate, too. Doubling the amount of anzyme would double the maximum rate of the reaction.
We study the rates of enzymes reactions to learn more about how they work. One of the most important things we can look at is the response of enzymes to inhibitors. Inhibitors are compounds that can slow the enzymatic reaction.
From a purely scientific point of view, how an inhibitor interacts with the enzyme is an interesting question. However, there are many applications for this question in the pharmaceutical industry. Suppose a disease can be controlled by slowing down a particular enzyme that is over-producing some small compound. Inhibitors might make useful pharmaceuticals. However, we would want to have a good idea about how that drug is working. That knowledge might tell us someting about how to build a better drug, for instance.
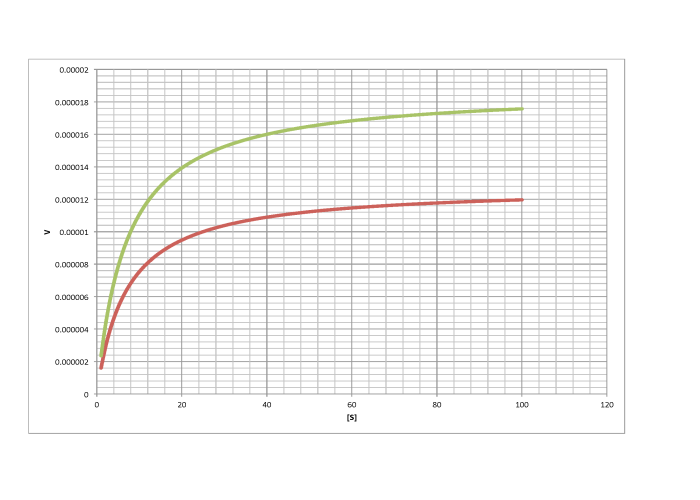
Inhibitors can work in different ways. The effect an inhibitor has on the rate / concentration plot can tell us something about what the inhibitor is doing. For example, look at the following plot. The regular reaction involving the enzyme and the substrate is plotted with black circles. The blue squares show the same reaction in the presence of an inhibitor.
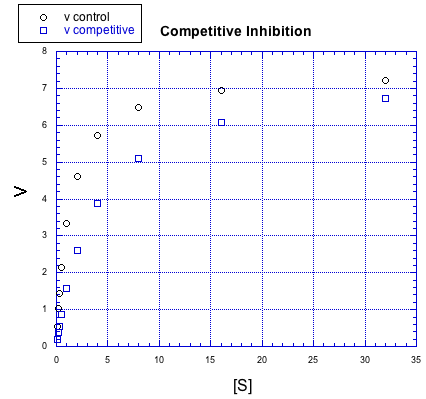
If we compare individual data points from both curves at the same value of [S], it is clear that the speed of the reaction is always slower when the inhibitor is present. For example, when the substrate concentration is about 16 units, the rate of the regular reaction is about 7 units, but the rate of the reaction with added inhibitor is only 6 units.
But something interesting is happenning. By the time we get to the next data point, [S] = 32 units, the rate of the inhibited reaction has almost caught up with the regular one. If you look closely, the inhibited reaction is steadily closing the gap throughout the graph.
That means that if you add enough substrate, you can neutralize the effect of the inhibitor. How does it do that?
The simplest explanation is that the inhibitor can bind to the enzyme in place of the substrate. There is an equilibrium constant for enzyme-inhibitor binding, just as there is an equilibrium constant for enzyme-substrate binding. However, if we add enough substrate, we can displace the inhibitor altogether, binding only substrate. Remember le Chatelier? The more substrate we have, the more the equilibrium shifts toward enzyme-substrate complex.
This type of inhibition is called competitive inhibition. The inhibitor and the substrate are competing for the same binding site on the enzyme.
- A competitive inhibitor competes with the substrate for the binding site on the enzyme.
- As substrate concentration increases, it eventually displaces the inhibitor.
- The reaction rate approaches the normal rate at higher substrate concentrations.
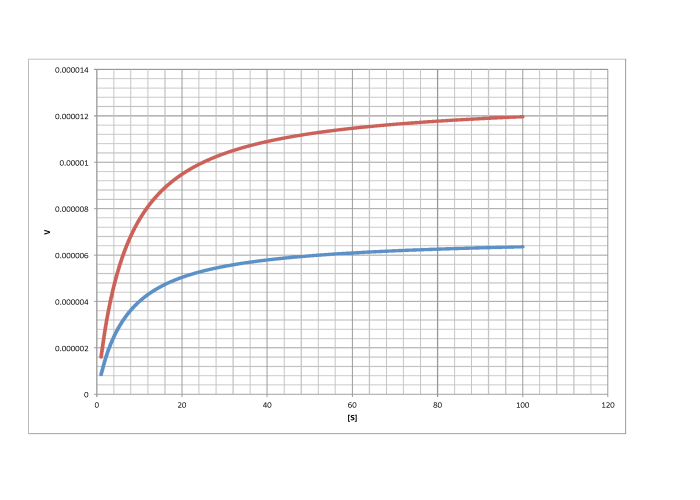
There are other kinds of inhibitors, too. For example, the inhibitor in the following case does not behave the same way.
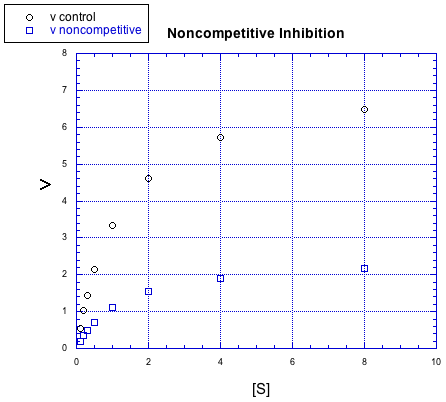
No matter how much substrate is added in this case, the reaction with the inhibitor can't catch up. There is more going on here than just competition for the binding site.
In this case, the inhibitor is directly interfering with the product-forming steps of the reaction. The inhibited reaction starts behind and never catches up. This case is called non-competitive inhibition.
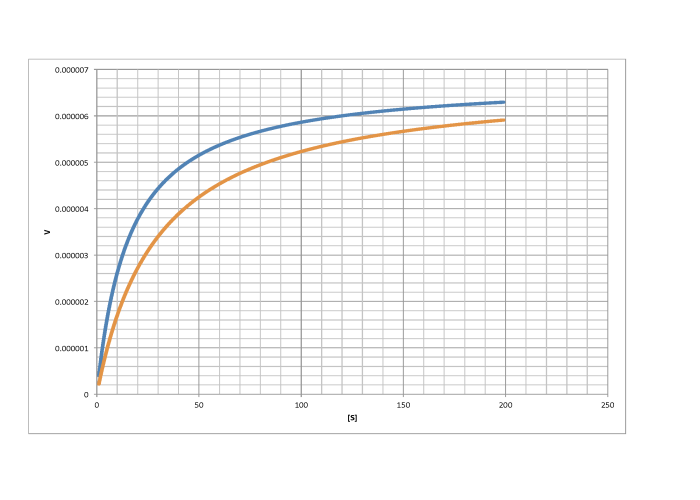
There are other, more subtle variations of inhibition, too. For example, in the following case, the inhibited reaction behaves a little bit differently than in the other cases, but the difference is hard to see at first.
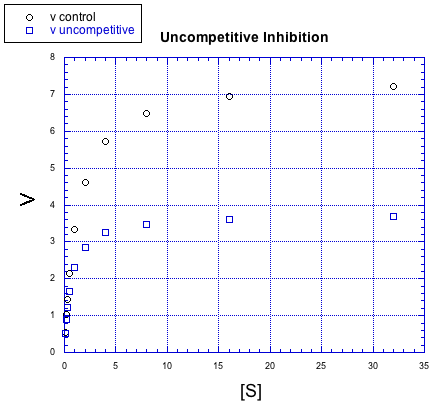
This time, the inhibited reaction seems to be doing OK at first, but it gradually falls off. It can't keep up with the regular reaction. Again, something is interfering with the product-forming steps; that's why added substrate doesn't eventually overcome the inhibitor. But in the early stages, this case looks different from non-competitive inhibition. This case is given the very similar name "uncompetitive inhibition".
To get a little more insight into these inhibitors, we will have to take a look at a mathematical treatment of the kinetics.
Characterise the following graphs as representing either competitive or non-competitive inhibition.
a)
b)
c)
d)
- Answer a
-
non-competitive
- Answer b
-
competitive
- Answer c
-
competitive
- Answer d
-
non-competitive