11.5: Changes of State
- Page ID
- 349560
\( \newcommand{\vecs}[1]{\overset { \scriptstyle \rightharpoonup} {\mathbf{#1}} } \)
\( \newcommand{\vecd}[1]{\overset{-\!-\!\rightharpoonup}{\vphantom{a}\smash {#1}}} \)
\( \newcommand{\id}{\mathrm{id}}\) \( \newcommand{\Span}{\mathrm{span}}\)
( \newcommand{\kernel}{\mathrm{null}\,}\) \( \newcommand{\range}{\mathrm{range}\,}\)
\( \newcommand{\RealPart}{\mathrm{Re}}\) \( \newcommand{\ImaginaryPart}{\mathrm{Im}}\)
\( \newcommand{\Argument}{\mathrm{Arg}}\) \( \newcommand{\norm}[1]{\| #1 \|}\)
\( \newcommand{\inner}[2]{\langle #1, #2 \rangle}\)
\( \newcommand{\Span}{\mathrm{span}}\)
\( \newcommand{\id}{\mathrm{id}}\)
\( \newcommand{\Span}{\mathrm{span}}\)
\( \newcommand{\kernel}{\mathrm{null}\,}\)
\( \newcommand{\range}{\mathrm{range}\,}\)
\( \newcommand{\RealPart}{\mathrm{Re}}\)
\( \newcommand{\ImaginaryPart}{\mathrm{Im}}\)
\( \newcommand{\Argument}{\mathrm{Arg}}\)
\( \newcommand{\norm}[1]{\| #1 \|}\)
\( \newcommand{\inner}[2]{\langle #1, #2 \rangle}\)
\( \newcommand{\Span}{\mathrm{span}}\) \( \newcommand{\AA}{\unicode[.8,0]{x212B}}\)
\( \newcommand{\vectorA}[1]{\vec{#1}} % arrow\)
\( \newcommand{\vectorAt}[1]{\vec{\text{#1}}} % arrow\)
\( \newcommand{\vectorB}[1]{\overset { \scriptstyle \rightharpoonup} {\mathbf{#1}} } \)
\( \newcommand{\vectorC}[1]{\textbf{#1}} \)
\( \newcommand{\vectorD}[1]{\overrightarrow{#1}} \)
\( \newcommand{\vectorDt}[1]{\overrightarrow{\text{#1}}} \)
\( \newcommand{\vectE}[1]{\overset{-\!-\!\rightharpoonup}{\vphantom{a}\smash{\mathbf {#1}}}} \)
\( \newcommand{\vecs}[1]{\overset { \scriptstyle \rightharpoonup} {\mathbf{#1}} } \)
\( \newcommand{\vecd}[1]{\overset{-\!-\!\rightharpoonup}{\vphantom{a}\smash {#1}}} \)
\(\newcommand{\avec}{\mathbf a}\) \(\newcommand{\bvec}{\mathbf b}\) \(\newcommand{\cvec}{\mathbf c}\) \(\newcommand{\dvec}{\mathbf d}\) \(\newcommand{\dtil}{\widetilde{\mathbf d}}\) \(\newcommand{\evec}{\mathbf e}\) \(\newcommand{\fvec}{\mathbf f}\) \(\newcommand{\nvec}{\mathbf n}\) \(\newcommand{\pvec}{\mathbf p}\) \(\newcommand{\qvec}{\mathbf q}\) \(\newcommand{\svec}{\mathbf s}\) \(\newcommand{\tvec}{\mathbf t}\) \(\newcommand{\uvec}{\mathbf u}\) \(\newcommand{\vvec}{\mathbf v}\) \(\newcommand{\wvec}{\mathbf w}\) \(\newcommand{\xvec}{\mathbf x}\) \(\newcommand{\yvec}{\mathbf y}\) \(\newcommand{\zvec}{\mathbf z}\) \(\newcommand{\rvec}{\mathbf r}\) \(\newcommand{\mvec}{\mathbf m}\) \(\newcommand{\zerovec}{\mathbf 0}\) \(\newcommand{\onevec}{\mathbf 1}\) \(\newcommand{\real}{\mathbb R}\) \(\newcommand{\twovec}[2]{\left[\begin{array}{r}#1 \\ #2 \end{array}\right]}\) \(\newcommand{\ctwovec}[2]{\left[\begin{array}{c}#1 \\ #2 \end{array}\right]}\) \(\newcommand{\threevec}[3]{\left[\begin{array}{r}#1 \\ #2 \\ #3 \end{array}\right]}\) \(\newcommand{\cthreevec}[3]{\left[\begin{array}{c}#1 \\ #2 \\ #3 \end{array}\right]}\) \(\newcommand{\fourvec}[4]{\left[\begin{array}{r}#1 \\ #2 \\ #3 \\ #4 \end{array}\right]}\) \(\newcommand{\cfourvec}[4]{\left[\begin{array}{c}#1 \\ #2 \\ #3 \\ #4 \end{array}\right]}\) \(\newcommand{\fivevec}[5]{\left[\begin{array}{r}#1 \\ #2 \\ #3 \\ #4 \\ #5 \\ \end{array}\right]}\) \(\newcommand{\cfivevec}[5]{\left[\begin{array}{c}#1 \\ #2 \\ #3 \\ #4 \\ #5 \\ \end{array}\right]}\) \(\newcommand{\mattwo}[4]{\left[\begin{array}{rr}#1 \amp #2 \\ #3 \amp #4 \\ \end{array}\right]}\) \(\newcommand{\laspan}[1]{\text{Span}\{#1\}}\) \(\newcommand{\bcal}{\cal B}\) \(\newcommand{\ccal}{\cal C}\) \(\newcommand{\scal}{\cal S}\) \(\newcommand{\wcal}{\cal W}\) \(\newcommand{\ecal}{\cal E}\) \(\newcommand{\coords}[2]{\left\{#1\right\}_{#2}}\) \(\newcommand{\gray}[1]{\color{gray}{#1}}\) \(\newcommand{\lgray}[1]{\color{lightgray}{#1}}\) \(\newcommand{\rank}{\operatorname{rank}}\) \(\newcommand{\row}{\text{Row}}\) \(\newcommand{\col}{\text{Col}}\) \(\renewcommand{\row}{\text{Row}}\) \(\newcommand{\nul}{\text{Nul}}\) \(\newcommand{\var}{\text{Var}}\) \(\newcommand{\corr}{\text{corr}}\) \(\newcommand{\len}[1]{\left|#1\right|}\) \(\newcommand{\bbar}{\overline{\bvec}}\) \(\newcommand{\bhat}{\widehat{\bvec}}\) \(\newcommand{\bperp}{\bvec^\perp}\) \(\newcommand{\xhat}{\widehat{\xvec}}\) \(\newcommand{\vhat}{\widehat{\vvec}}\) \(\newcommand{\uhat}{\widehat{\uvec}}\) \(\newcommand{\what}{\widehat{\wvec}}\) \(\newcommand{\Sighat}{\widehat{\Sigma}}\) \(\newcommand{\lt}{<}\) \(\newcommand{\gt}{>}\) \(\newcommand{\amp}{&}\) \(\definecolor{fillinmathshade}{gray}{0.9}\)- To calculate the energy changes that accompany phase changes.
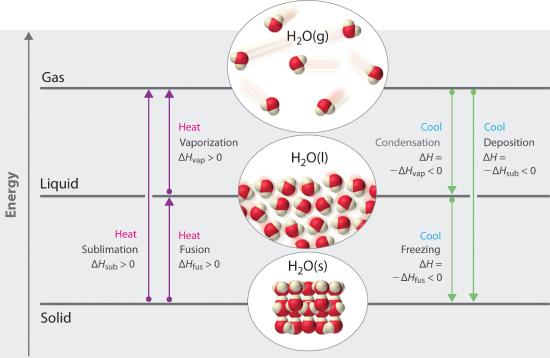
We take advantage of changes between the gas, liquid, and solid states to cool a drink with ice cubes (solid to liquid), cool our bodies by perspiration (liquid to gas), and cool food inside a refrigerator (gas to liquid and vice versa). We use dry ice, which is solid CO2, as a refrigerant (solid to gas), and we make artificial snow for skiing and snowboarding by transforming a liquid to a solid. In this section, we examine what happens when any of the three forms of matter is converted to either of the other two. These changes of state are often called phase changesA change of state that occurs when any of the three forms of matter (solids, liquids, and gases) is converted to either of the other two.. The six most common phase changes are shown in Figure 11.5.1.
Energy Changes That Accompany Phase Changes
Phase changes are always accompanied by a change in the energy of a system. For example, converting a liquid, in which the molecules are close together, to a gas, in which the molecules are, on average, far apart, requires an input of energy (heat) to give the molecules enough kinetic energy to allow them to overcome the intermolecular attractive forces. The stronger the attractive forces, the more energy is needed to overcome them. Solids, which are highly ordered, have the strongest intermolecular interactions, whereas gases, which are very disordered, have the weakest. Thus any transition from a more ordered to a less ordered state (solid to liquid, liquid to gas, or solid to gas) requires an input of energy; it is endothermic. Conversely, any transition from a less ordered to a more ordered state (liquid to solid, gas to liquid, or gas to solid) releases energy; it is exothermic. The energy change associated with each common phase change is shown in Figure 11.5.1.
In Chapter 9, we defined the enthalpy changes associated with various chemical and physical processes. The melting points and molar enthalpies of fusion (ΔHfus), the energy required to convert from a solid to a liquid, a process known as fusion (or melting)The conversion of a solid to a liquid., as well as the normal boiling points and enthalpies of vaporization (ΔHvap) of selected compounds are listed in Table 10.5.1. The substances with the highest melting points usually have the highest enthalpies of fusion; they tend to be ionic compounds that are held together by very strong electrostatic interactions. Substances with high boiling points are those with strong intermolecular interactions that must be overcome to convert a liquid to a gas, resulting in high enthalpies of vaporization. The enthalpy of vaporization of a given substance is much greater than its enthalpy of fusion because it takes more energy to completely separate molecules (conversion from a liquid to a gas) than to enable them only to move past one another freely (conversion from a solid to a liquid).
Table 11.5.1 Melting and Boiling Points and Enthalpies of Fusion and Vaporization for Selected Substances
| Substance | Melting Point (°C) | ΔHfus (kJ/mol) | Boiling Point (°C) | ΔHvap (kJ/mol) |
|---|---|---|---|---|
| N2 | −210.0 | 0.71 | −195.8 | 5.6 |
| HCl | −114.2 | 2.00 | −85.1 | 16.2 |
| Br2 | −7.2 | 10.6 | 58.8 | 30.0 |
| CCl4 | −22.6 | 2.56 | 76.8 | 29.8 |
| CH3CH2OH (ethanol) | −114.1 | 4.93 | 78.3 | 38.6 |
| CH3(CH2)4CH3 (n-hexane) | −95.4 | 13.1 | 68.7 | 28.9 |
| H2O | 0 | 6.01 | 100 | 40.7 |
| Na | 97.8 | 2.6 | 883 | 97.4 |
| NaF | 996 | 33.4 | 1704 | 176.1 |
Note the Pattern
ΔH is positive for any transition from a more ordered to a less ordered state and negative for a transition from a less ordered to a more ordered state.
The direct conversion of a solid to a gas, without an intervening liquid phase, is called sublimationThe conversion of a solid directly to a gas (without an intervening liquid phase).. The amount of energy required to sublime 1 mol of a pure solid is the enthalpy of sublimation (ΔHsub)The enthalpy change that accompanies the conversion of a solid directly to a gas.. Common substances that sublime at standard temperature and pressure (STP; 0°C, 1 atm) include CO2 (dry ice); iodine (Figure 11.5.2 ); naphthalene, a substance used to protect woolen clothing against moths; and 1,4-dichlorobenzene. As shown in Figure 11.5.1 the enthalpy of sublimation of a substance is the sum of its enthalpies of fusion and vaporization provided all values are at the same T; this is an application of Hess’s law. (For more information about Hess’s law, see Section 9.2 ).
\[ \Delta H_{sub} = \Delta H_{fus} + \Delta H_{vap} \tag{11.5.1} \]
Figure 11.5.2 The Sublimation of Solid Iodine When solid iodine is heated at ordinary atmospheric pressure, it sublimes. When the I2 vapor comes in contact with a cold surface, it deposits I2 crystals.
Fusion, vaporization, and sublimation are endothermic processes; they occur only with the absorption of heat. Anyone who has ever stepped out of a swimming pool on a cool, breezy day has felt the heat loss that accompanies the evaporation of water from the skin. Our bodies use this same phenomenon to maintain a constant temperature: we perspire continuously, even when at rest, losing about 600 mL of water daily by evaporation from the skin. We also lose about 400 mL of water as water vapor in the air we exhale, which also contributes to cooling. Refrigerators and air-conditioners operate on a similar principle: heat is absorbed from the object or area to be cooled and used to vaporize a low-boiling-point liquid, such as ammonia or the chlorofluorocarbons (CFCs) and the hydrofluorocarbons (HCFCs) discussed in Section7.6 in connection with the ozone layer. The vapor is then transported to a different location and compressed, thus releasing and dissipating the heat. Likewise, ice cubes efficiently cool a drink not because of their low temperature but because heat is required to convert ice at 0°C to liquid water at 0°C, as demonstrated later in Example 8.
Temperature Curves
The processes on the right side of Figure 11.5.1 —freezing, condensation, and deposition, which are the reverse of fusion, sublimation, and vaporization—are exothermic. Thus heat pumps that use refrigerants are essentially air-conditioners running in reverse. Heat from the environment is used to vaporize the refrigerant, which is then condensed to a liquid in coils within a house to provide heat. The energy changes that occur during phase changes can be quantified by using a heating or cooling curve.
Heating Curves
Figure 11.5.3 shows a heating curveA plot of the temperature of a substance versus the heat added or versus the heating time at a constant rate of heating., a plot of temperature versus heating time, for a 75 g sample of water. The sample is initially ice at 1 atm and −23°C; as heat is added, the temperature of the ice increases linearly with time. The slope of the line depends on both the mass of the ice and the specific heat (Cs)The number of joules required to raise the temperature of 1 g of a substance by 1°C. of ice, which is the number of joules required to raise the temperature of 1 g of ice by 1°C. As the temperature of the ice increases, the water molecules in the ice crystal absorb more and more energy and vibrate more vigorously. At the melting point, they have enough kinetic energy to overcome attractive forces and move with respect to one another. As more heat is added, the temperature of the system does not increase further but remains constant at 0°C until all the ice has melted. Once all the ice has been converted to liquid water, the temperature of the water again begins to increase. Now, however, the temperature increases more slowly than before because the specific heat capacity of water is greater than that of ice. When the temperature of the water reaches 100°C, the water begins to boil. Here, too, the temperature remains constant at 100°C until all the water has been converted to steam. At this point, the temperature again begins to rise, but at a faster rate than seen in the other phases because the heat capacity of steam is less than that of ice or water.
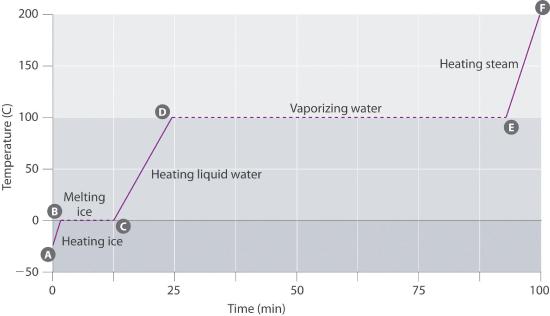
Thus the temperature of a system does not change during a phase change. In this example, as long as even a tiny amount of ice is present, the temperature of the system remains at 0°C during the melting process, and as long as even a small amount of liquid water is present, the temperature of the system remains at 100°C during the boiling process. The rate at which heat is added does not affect the temperature of the ice/water or water/steam mixture because the added heat is being used exclusively to overcome the attractive forces that hold the more condensed phase together. Many cooks think that food will cook faster if the heat is turned up higher so that the water boils more rapidly. Instead, the pot of water will boil to dryness sooner, but the temperature of the water does not depend on how vigorously it boils.
Note the Pattern
The temperature of a sample does not change during a phase change.
If heat is added at a constant rate, as in Figure 11.5.3, then the length of the horizontal lines, which represents the time during which the temperature does not change, is directly proportional to the magnitude of the enthalpies associated with the phase changes. In Figure 11.5.3, the horizontal line at 100°C is much longer than the line at 0°C because the enthalpy of vaporization of water is several times greater than the enthalpy of fusion.
A superheated liquidAn unstable liquid at a temperature and pressure at which it should be a gas. is a sample of a liquid at the temperature and pressure at which it should be a gas. Superheated liquids are not stable; the liquid will eventually boil, sometimes violently. The phenomenon of superheating causes “bumping” when a liquid is heated in the laboratory. When a test tube containing water is heated over a Bunsen burner, for example, one portion of the liquid can easily become too hot. When the superheated liquid converts to a gas, it can push or “bump” the rest of the liquid out of the test tube. Placing a stirring rod or a small piece of ceramic (a “boiling chip”) in the test tube allows bubbles of vapor to form on the surface of the object so the liquid boils instead of becoming superheated. Superheating is the reason a liquid heated in a smooth cup in a microwave oven may not boil until the cup is moved, when the motion of the cup allows bubbles to form.
Cooling Curves
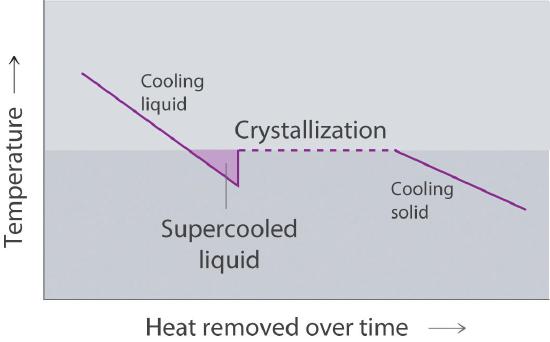
The cooling curveA plot of the temperature of a substance versus the heat removed or versus the cooling time at a constant rate of cooling., a plot of temperature versus cooling time, in Figure 11.5.4 plots temperature versus time as a 75 g sample of steam, initially at 1 atm and 200°C, is cooled. Although we might expect the cooling curve to be the mirror image of the heating curve in Figure 11.5.3 , the cooling curve is not an identical mirror image. As heat is removed from the steam, the temperature falls until it reaches 100°C. At this temperature, the steam begins to condense to liquid water. No further temperature change occurs until all the steam is converted to the liquid; then the temperature again decreases as the water is cooled. We might expect to reach another plateau at 0°C, where the water is converted to ice; in reality, however, this does not always occur. Instead, the temperature often drops below the freezing point for some time, as shown by the little dip in the cooling curve below 0°C. This region corresponds to an unstable form of the liquid, a supercooled liquidA metastable liquid phase that exists below the normal melting point of a substance.. If the liquid is allowed to stand, if cooling is continued, or if a small crystal of the solid phase is added (a seed crystalA solid sample of a substance that can be added to a supercooled liquid or a supersaturated solution to help induce crystallization.), the supercooled liquid will convert to a solid, sometimes quite suddenly. As the water freezes, the temperature increases slightly due to the heat evolved during the freezing process and then holds constant at the melting point as the rest of the water freezes. Subsequently, the temperature of the ice decreases again as more heat is removed from the system.
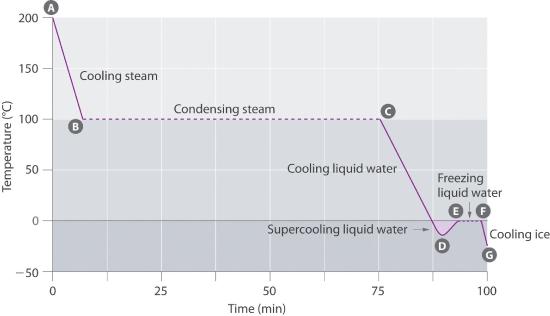
Supercooling effects have a huge impact on Earth’s climate. For example, supercooling of water droplets in clouds can prevent the clouds from releasing precipitation over regions that are persistently arid as a result. Clouds consist of tiny droplets of water, which in principle should be dense enough to fall as rain. In fact, however, the droplets must aggregate to reach a certain size before they can fall to the ground. Usually a small particle (a nucleus) is required for the droplets to aggregate; the nucleus can be a dust particle, an ice crystal, or a particle of silver iodide dispersed in a cloud during seeding (a method of inducing rain). Unfortunately, the small droplets of water generally remain as a supercooled liquid down to about −10°C, rather than freezing into ice crystals that are more suitable nuclei for raindrop formation. One approach to producing rainfall from an existing cloud is to cool the water droplets so that they crystallize to provide nuclei around which raindrops can grow. This is best done by dispersing small granules of solid CO2 (dry ice) into the cloud from an airplane. Solid CO2 sublimes directly to the gas at pressures of 1 atm or lower, and the enthalpy of sublimation is substantial (25.3 kJ/mol). As the CO2 sublimes, it absorbs heat from the cloud, often with the desired results.
Example 11.5.1
If a 50.0 g ice cube at 0.0°C is added to 500 mL of tea at 20.0°C, what is the temperature of the tea when the ice cube has just melted? Assume that no heat is transferred to or from the surroundings. The density of water (and iced tea) is 1.00 g/mL over the range 0°C–20°C, the specific heats of liquid water and ice are 4.184 J/(g·°C) and 2.062 J/(g·°C), respectively, and the enthalpy of fusion of ice is 6.01 kJ/mol.
Given: mass, volume, initial temperature, density, specific heats, and ΔHfus
Asked for: final temperature
Strategy:
Substitute the values given into the general equation relating heat gained to heat lost (Equation 9.6.7) to obtain the final temperature of the mixture.
Solution:
Recall from Chapter 9 that when two substances or objects at different temperatures are brought into contact, heat will flow from the warmer one to the cooler. The amount of heat that flows is given by
q = mCsΔT
where q is heat, m is mass, Cs is the specific heat, and ΔT is the temperature change. Eventually, the temperatures of the two substances will become equal at a value somewhere between their initial temperatures. Calculating the temperature of iced tea after adding an ice cube is slightly more complicated. The general equation relating heat gained and heat lost is still valid, but in this case we also have to take into account the amount of heat required to melt the ice cube from ice at 0.0°C to liquid water at 0.0C:
\[ q_{lost}=-q_{gained} \notag \]
\[ m_{iced \; tea}C_{s}\left ( H_{2}O \right )\Delta T_{iced \; tea}=-\left [ m_{ice}C_{s}\left ( H_{2}O \right )\Delta T_{ice} \right ]+mol_{ice} \Delta H_{fus}\left ( H_{2}O \right ) \notag \]
\[ 500 \; \cancel{g} \left [ 4.184 \; J/\left ( \cancel{g}\cdot ^{o}C \right ) \right ]\left ( T_{f}-20.0 \; ^{o}C \right ) = -50 \; \cancel{g} \left [ 4.184 \; J/\left ( \cancel{g}\cdot ^{o}C \right ) \right ]\left ( T_{f}-0.0 \; ^{o}C \right )-\dfrac{50.0 \; \cancel{g}}{18.0 \; \cancel{g}/\cancel{mol}}6.01\times 10^{3} \; J/\cancel{mol} \notag \]
\[ \left ( 2090 \; J/^{o}C \right )\left ( T_{f}-20.0 \; ^{o}C \right )= -\left ( 209 \; J/^{o}C \right )T_{f} - 1.67\times 10^{4} J \notag \]
\[ 2.53 \times 10^{4} J= \left ( 2310 \; J/^{o}C \right )T_{f} \notag \]
\[ 11.0 \; ^{o}C=T_{f} \notag \]
Exercise
Suppose you are overtaken by a blizzard while ski touring and you take refuge in a tent. You are thirsty, but you forgot to bring liquid water. You have a choice of eating a few handfuls of snow (say 400 g) at −5.0°C immediately to quench your thirst or setting up your propane stove, melting the snow, and heating the water to body temperature before drinking it. You recall that the survival guide you leafed through at the hotel said something about not eating snow, but you can’t remember why—after all, it’s just frozen water. To understand the guide’s recommendation, calculate the amount of heat that your body will have to supply to bring 400 g of snow at −5.0°C to your body’s internal temperature of 37°C. Use the data in Example 8
Answer: 200 kJ (4.1 kJ to bring the ice from −5.0°C to 0.0°C, 133.6 kJ to melt the ice at 0.0°C, and 61.9 kJ to bring the water from 0.0°C to 37°C), which is energy that would not have been expended had you first melted the snow.
Summary
Changes of state are examples of phase changes, or phase transitions. All phase changes are accompanied by changes in the energy of a system. Changes from a more-ordered state to a less-ordered state (such as a liquid to a gas) are endothermic. Changes from a less-ordered state to a more-ordered state (such as a liquid to a solid) are always exothermic. The conversion of a solid to a liquid is called fusion (or melting). The energy required to melt 1 mol of a substance is its enthalpy of fusion (ΔHfus). The energy change required to vaporize 1 mol of a substance is the enthalpy of vaporization (ΔHvap). The direct conversion of a solid to a gas is sublimation. The amount of energy needed to sublime 1 mol of a substance is its enthalpy of sublimation (ΔHsub) and is the sum of the enthalpies of fusion and vaporization. Plots of the temperature of a substance versus heat added or versus heating time at a constant rate of heating are called heating curves. Heating curves relate temperature changes to phase transitions. A superheated liquid, a liquid at a temperature and pressure at which it should be a gas, is not stable. A cooling curve is not exactly the reverse of the heating curve because many liquids do not freeze at the expected temperature. Instead, they form a supercooled liquid, a metastable liquid phase that exists below the normal melting point. Supercooled liquids usually crystallize on standing, or adding a seed crystal of the same or another substance can induce crystallization.
Key Takeaway
- Fusion, vaporization, and sublimation are endothermic processes, whereas freezing, condensation, and deposition are exothermic processes.
Conceptual Problems
-
In extremely cold climates, snow can disappear with no evidence of its melting. How can this happen? What change(s) in state are taking place? Would you expect this phenomenon to be more common at high or low altitudes? Explain your answer.
-
Why do car manufacturers recommend that an automobile should not be left standing in subzero temperatures if its radiator contains only water? Car manufacturers also warn car owners that they should check the fluid level in a radiator only when the engine is cool. What is the basis for this warning? What is likely to happen if it is ignored?
-
Use Hess’s law and a thermochemical cycle to show that, for any solid, the enthalpy of sublimation is equal to the sum of the enthalpy of fusion of the solid and the enthalpy of vaporization of the resulting liquid.
-
Three distinct processes occur when an ice cube at −10°C is used to cool a glass of water at 20°C. What are they? Which causes the greatest temperature change in the water?
-
When frost forms on a piece of glass, crystals of ice are deposited from water vapor in the air. How is this process related to sublimation? Describe the energy changes that take place as the water vapor is converted to frost.
-
What phase changes are involved in each process? Which processes are exothermic, and which are endothermic?
- ice melting
- distillation
- condensation forming on a window
- the use of dry ice to create a cloud for a theatrical production
-
What phase changes are involved in each process? Which processes are exothermic, and which are endothermic?
- evaporation of methanol
- crystallization
- liquefaction of natural gas
- the use of naphthalene crystals to repel moths
-
Why do substances with high enthalpies of fusion tend to have high melting points?
-
Why is the enthalpy of vaporization of a compound invariably much larger than its enthalpy of fusion?
-
What is the opposite of fusion, sublimation, and condensation? Describe the phase change in each pair of opposing processes and state whether each phase change is exothermic or endothermic.
-
Draw a typical heating curve (temperature versus amount of heat added at a constant rate) for conversion of a solid to a liquid and then to a gas. What causes some regions of the plot to have a positive slope? What is happening in the regions of the plot where the curve is horizontal, meaning that the temperature does not change even though heat is being added?
-
If you know the mass of a sample of a substance, how could you use a heating curve to calculate the specific heat of the substance, as well as the change in enthalpy associated with a phase change?
-
Draw the heating curve for a liquid that has been superheated. How does this differ from a normal heating curve for a liquid? Draw the cooling curve for a liquid that has been supercooled. How does this differ from a normal cooling curve for a liquid?
Answers
-
When snow disappears without melting, it must be subliming directly from the solid state to the vapor state. The rate at which this will occur depends solely on the partial pressure of water, not on the total pressure due to other gases. Consequently, altitude (and changes in atmospheric pressure) will not affect the rate of sublimation directly.
-
The general equations and enthalpy changes for the changes of state involved in converting a solid to a gas are:
\[ \begin{matrix}
solid \rightarrow liquid & \Delta H_{fus}\\
liquid \rightarrow gas & \Delta H_{vap}\\
solid \rightarrow gas & \Delta H_{sub}=\Delta H_{fus}+\Delta H_{vap}
\end{matrix} \notag \]The relationship between these enthalpy changes is shown schematically in the thermochemical cycle below:

-
The formation of frost on a surface is an example of deposition, which is the reverse of sublimation. The change in enthalpy for deposition is equal in magnitude, but opposite in sign, to ΔHsub, which is a positive number: ΔHsub = ΔHfus + ΔHvap.
-
- liquid + heat → vapor: endothermic
- liquid → solid + heat: exothermic
- gas → liquid + heat: exothermic
- solid + heat → vapor: endothermic
-
The enthalpy of vaporization is larger than the enthalpy of fusion because vaporization requires the addition of enough energy to disrupt all intermolecular interactions and create a gas in which the molecules move essentially independently. In contrast, fusion requires much less energy, because the intermolecular interactions in a liquid and a solid are similar in magnitude in all condensed phases. Fusion requires only enough energy to overcome the intermolecular interactions that lock molecules in place in a lattice, thereby allowing them to move more freely.
-
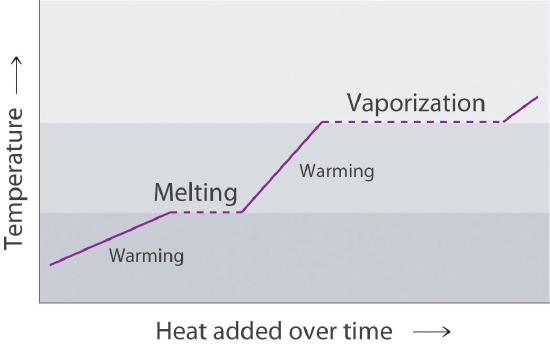
The portions of the curve with a positive slope correspond to heating a single phase, while the horizontal portions of the curve correspond to phase changes. During a phase change, the temperature of the system does not change, because the added heat is melting the solid at its melting point or evaporating the liquid at its boiling point.
-
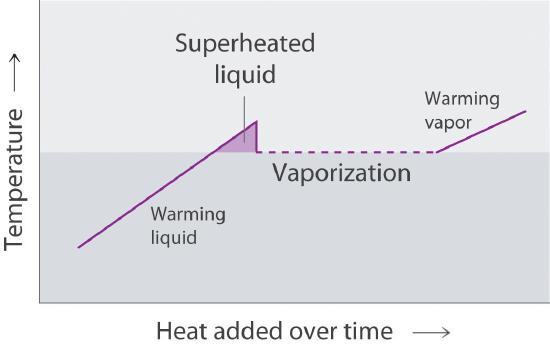
A superheated liquid exists temporarily as liquid with a temperature above the normal boiling point of the liquid. When a supercooled liquid boils, the temperature drops as the liquid is converted to vapor.
Conversely, a supercooled liquid exists temporarily as a liquid with a temperature lower than the normal melting point of the solid. As shown below, when a supercooled liquid crystallizes, the temperature increases as the liquid is converted to a solid.
Numerical Problems
-
The density of oxygen at 1 atm and various temperatures is given in the following table. Plot the data and use your graph to predict the normal boiling point of oxygen.
T (K) 60 70 80 90 100 120 140 d (mol/L) 40.1 38.6 37.2 35.6 0.123 0.102 0.087 -
The density of propane at 1 atm and various temperatures is given in the following table. Plot the data and use your graph to predict the normal boiling point of propane.
T (K) 100 125 150 175 200 225 250 275 d (mol/L) 16.3 15.7 15.0 14.4 13.8 13.2 0.049 0.044 -
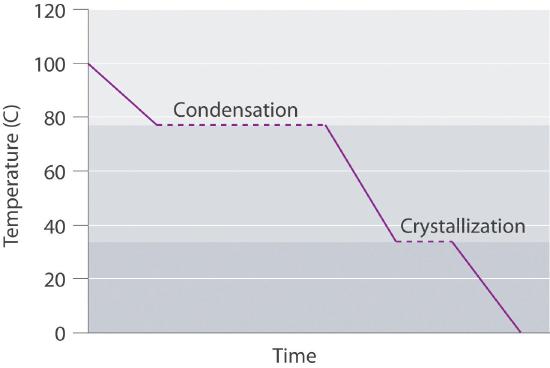
Draw the cooling curve for a sample of the vapor of a compound that has a melting point of 34°C and a boiling point of 77°C as it is cooled from 100°C to 0°C.
-
Propionic acid has a melting point of −20.8°C and a boiling point of 141°C. Draw a heating curve showing the temperature versus time as heat is added at a constant rate to show the behavior of a sample of propionic acid as it is heated from −50°C to its boiling point. What happens above 141°C?
-
A 0.542 g sample of I2 requires 96.1 J of energy to be converted to vapor. What is the enthalpy of sublimation of I2?
-
A 2.0 L sample of gas at 210°C and 0.762 atm condenses to give 1.20 mL of liquid, and 476 J of heat is released during the process. What is the enthalpy of vaporization of the compound?
-
One fuel used for jet engines and rockets is aluminum borohydride [Al(BH4)3], a liquid that readily reacts with water to produce hydrogen. The liquid has a boiling point of 44.5°C. How much energy is needed to vaporize 1.0 kg of aluminum borohydride at 20°C, given a ΔHvap of 30 kJ/mol and a molar heat capacity (Cp) of 194.6 J/(mol·K)?
-
How much energy is released when freezing 100.0 g of dimethyl disulfide (C2H6S2) initially at 20°C? Use the following information: melting point = −84.7°C, ΔHfus = 9.19 kJ/mol, Cp = 118.1 J/(mol·K).
The following four problems use the following information (the subscript p indicates measurements taken at constant pressure): ΔHfus(H2O) = 6.01 kJ/mol, ΔHvap(H2O) = 40.66 kJ/mol, Cp(s)(crystalline H2O) = 38.02 J/(mol·K), Cp(l)(liquid H2O) = 75.35 J/(mol·K), and Cp(g)(H2O gas) = 33.60 J/(mol·K).
-
How much heat is released in the conversion of 1.00 L of steam at 21.9 atm and 200°C to ice at −6.0°C and 1 atm?
-
How much heat must be applied to convert a 1.00 g piece of ice at −10°C to steam at 120°C?
-
How many grams of boiling water must be added to a glass with 25.0 g of ice at −3°C to obtain a liquid with a temperature of 45°C?
-
How many grams of ice at −5.0°C must be added to 150.0 g of water at 22°C to give a final temperature of 15°C?
Answers
-

The transition from a liquid to a gaseous phase is accompanied by a drastic decrease in density. According to the data in the table and the plot, the boiling point of liquid oxygen is between 90 and 100 K (actually 90.2 K).
-
-
45.0 kJ/mol
-
488 kJ
-
32.6 kJ
-
57 g
Contributors
- Anonymous
Video 11.5.3 from the North Carolina School of Science and Mathematics @ YouTube
Thumbnail from Wikimedia


