14.10: Titration Curves
- Page ID
- 49693

\( \newcommand{\vecs}[1]{\overset { \scriptstyle \rightharpoonup} {\mathbf{#1}} } \)
\( \newcommand{\vecd}[1]{\overset{-\!-\!\rightharpoonup}{\vphantom{a}\smash {#1}}} \)
\( \newcommand{\id}{\mathrm{id}}\) \( \newcommand{\Span}{\mathrm{span}}\)
( \newcommand{\kernel}{\mathrm{null}\,}\) \( \newcommand{\range}{\mathrm{range}\,}\)
\( \newcommand{\RealPart}{\mathrm{Re}}\) \( \newcommand{\ImaginaryPart}{\mathrm{Im}}\)
\( \newcommand{\Argument}{\mathrm{Arg}}\) \( \newcommand{\norm}[1]{\| #1 \|}\)
\( \newcommand{\inner}[2]{\langle #1, #2 \rangle}\)
\( \newcommand{\Span}{\mathrm{span}}\)
\( \newcommand{\id}{\mathrm{id}}\)
\( \newcommand{\Span}{\mathrm{span}}\)
\( \newcommand{\kernel}{\mathrm{null}\,}\)
\( \newcommand{\range}{\mathrm{range}\,}\)
\( \newcommand{\RealPart}{\mathrm{Re}}\)
\( \newcommand{\ImaginaryPart}{\mathrm{Im}}\)
\( \newcommand{\Argument}{\mathrm{Arg}}\)
\( \newcommand{\norm}[1]{\| #1 \|}\)
\( \newcommand{\inner}[2]{\langle #1, #2 \rangle}\)
\( \newcommand{\Span}{\mathrm{span}}\) \( \newcommand{\AA}{\unicode[.8,0]{x212B}}\)
\( \newcommand{\vectorA}[1]{\vec{#1}} % arrow\)
\( \newcommand{\vectorAt}[1]{\vec{\text{#1}}} % arrow\)
\( \newcommand{\vectorB}[1]{\overset { \scriptstyle \rightharpoonup} {\mathbf{#1}} } \)
\( \newcommand{\vectorC}[1]{\textbf{#1}} \)
\( \newcommand{\vectorD}[1]{\overrightarrow{#1}} \)
\( \newcommand{\vectorDt}[1]{\overrightarrow{\text{#1}}} \)
\( \newcommand{\vectE}[1]{\overset{-\!-\!\rightharpoonup}{\vphantom{a}\smash{\mathbf {#1}}}} \)
\( \newcommand{\vecs}[1]{\overset { \scriptstyle \rightharpoonup} {\mathbf{#1}} } \)
\( \newcommand{\vecd}[1]{\overset{-\!-\!\rightharpoonup}{\vphantom{a}\smash {#1}}} \)
\(\newcommand{\avec}{\mathbf a}\) \(\newcommand{\bvec}{\mathbf b}\) \(\newcommand{\cvec}{\mathbf c}\) \(\newcommand{\dvec}{\mathbf d}\) \(\newcommand{\dtil}{\widetilde{\mathbf d}}\) \(\newcommand{\evec}{\mathbf e}\) \(\newcommand{\fvec}{\mathbf f}\) \(\newcommand{\nvec}{\mathbf n}\) \(\newcommand{\pvec}{\mathbf p}\) \(\newcommand{\qvec}{\mathbf q}\) \(\newcommand{\svec}{\mathbf s}\) \(\newcommand{\tvec}{\mathbf t}\) \(\newcommand{\uvec}{\mathbf u}\) \(\newcommand{\vvec}{\mathbf v}\) \(\newcommand{\wvec}{\mathbf w}\) \(\newcommand{\xvec}{\mathbf x}\) \(\newcommand{\yvec}{\mathbf y}\) \(\newcommand{\zvec}{\mathbf z}\) \(\newcommand{\rvec}{\mathbf r}\) \(\newcommand{\mvec}{\mathbf m}\) \(\newcommand{\zerovec}{\mathbf 0}\) \(\newcommand{\onevec}{\mathbf 1}\) \(\newcommand{\real}{\mathbb R}\) \(\newcommand{\twovec}[2]{\left[\begin{array}{r}#1 \\ #2 \end{array}\right]}\) \(\newcommand{\ctwovec}[2]{\left[\begin{array}{c}#1 \\ #2 \end{array}\right]}\) \(\newcommand{\threevec}[3]{\left[\begin{array}{r}#1 \\ #2 \\ #3 \end{array}\right]}\) \(\newcommand{\cthreevec}[3]{\left[\begin{array}{c}#1 \\ #2 \\ #3 \end{array}\right]}\) \(\newcommand{\fourvec}[4]{\left[\begin{array}{r}#1 \\ #2 \\ #3 \\ #4 \end{array}\right]}\) \(\newcommand{\cfourvec}[4]{\left[\begin{array}{c}#1 \\ #2 \\ #3 \\ #4 \end{array}\right]}\) \(\newcommand{\fivevec}[5]{\left[\begin{array}{r}#1 \\ #2 \\ #3 \\ #4 \\ #5 \\ \end{array}\right]}\) \(\newcommand{\cfivevec}[5]{\left[\begin{array}{c}#1 \\ #2 \\ #3 \\ #4 \\ #5 \\ \end{array}\right]}\) \(\newcommand{\mattwo}[4]{\left[\begin{array}{rr}#1 \amp #2 \\ #3 \amp #4 \\ \end{array}\right]}\) \(\newcommand{\laspan}[1]{\text{Span}\{#1\}}\) \(\newcommand{\bcal}{\cal B}\) \(\newcommand{\ccal}{\cal C}\) \(\newcommand{\scal}{\cal S}\) \(\newcommand{\wcal}{\cal W}\) \(\newcommand{\ecal}{\cal E}\) \(\newcommand{\coords}[2]{\left\{#1\right\}_{#2}}\) \(\newcommand{\gray}[1]{\color{gray}{#1}}\) \(\newcommand{\lgray}[1]{\color{lightgray}{#1}}\) \(\newcommand{\rank}{\operatorname{rank}}\) \(\newcommand{\row}{\text{Row}}\) \(\newcommand{\col}{\text{Col}}\) \(\renewcommand{\row}{\text{Row}}\) \(\newcommand{\nul}{\text{Nul}}\) \(\newcommand{\var}{\text{Var}}\) \(\newcommand{\corr}{\text{corr}}\) \(\newcommand{\len}[1]{\left|#1\right|}\) \(\newcommand{\bbar}{\overline{\bvec}}\) \(\newcommand{\bhat}{\widehat{\bvec}}\) \(\newcommand{\bperp}{\bvec^\perp}\) \(\newcommand{\xhat}{\widehat{\xvec}}\) \(\newcommand{\vhat}{\widehat{\vvec}}\) \(\newcommand{\uhat}{\widehat{\uvec}}\) \(\newcommand{\what}{\widehat{\wvec}}\) \(\newcommand{\Sighat}{\widehat{\Sigma}}\) \(\newcommand{\lt}{<}\) \(\newcommand{\gt}{>}\) \(\newcommand{\amp}{&}\) \(\definecolor{fillinmathshade}{gray}{0.9}\)When an acid is titrated with a base, there is typically a sudden change in the pH of the solution at the equivalence point (where the amount of titrant added equals the amount of acid originally present). If a few drops of indicator solution have been added, this sharp increase in pH causes an abrupt change in color, which is called the endpoint of the indicator. The actual magnitude of the jump in pH, and the pH range which it covers depend on the strength of both the acid and the base involved, and so the choice of indicator can vary from one titration to another. To learn how to choose an appropriate indicator, we need to study in some detail the variation of pH during a titration.
For reference as you read this section, cm3 is equivalent to mL.
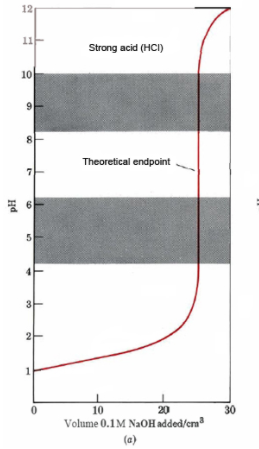 First we shall consider titration of a strong acid such as HCl with a strong base such as NaOH. Suppose we place 25.00 cm³ (mL) of 0.10 M HCl solution in a flask and add 0.10 M NaOH from a buret. The pH of the solution in the flask varies with added NaOH, as shown in Figure 1a. The pH changes quite slowly at the start of the titration, and almost all the increase in pH takes place in the immediate vicinity of the endpoint.
The pH change during this titration is caused by the proton-transfer reaction
\[\text{H}_{3}\text{O}^{+} + \text{ OH}^{-} \rightarrow \text{ H}_{2}\text{O } + \text{ H}_{2}\text{O} \nonumber \]
which occurs as hydroxide ions are added from the buret. Though hydronium ions are being consumed by hydroxide ions in the early stages of the titration, the hydronium-ion concentration remains in the vicinity of 10–1 or 10–2 mol L–1. As a result, the pH remains in the range 1 to 2. As an example of this behavior let us consider the situation halfway to the endpoint, i.e., when exactly 12.50 cm³ of 0.10 M NaOH have been added to 25.00 cm3 (mL) of 0.10 M HCl in the flask. The amount of hydronium ion has been reduced at this point from an original 2.5 mmol to half this value, 1.25 mmol. At the same time the volume of solution has increased from 25 cm3 to (25 + 12.50) cm3 = 37.50 cm3. Therefore, the hydronium-ion concentration is 1.25 mmol/37.50 cm3 = 0.0333 mol L–1, and the resultant pH is 1.48. Though the titration is half completed, this is not very different from the initial pH of 1.00.
The pH of the solution in the flask will only change drastically when we reach that point in the titration when only a minute fraction of the hydronium ions remain unconsumed, i.e., as we approach the endpoint, seen on the graph. Only then will we have reduced the hydronium-ion concentration by several powers of 10, and consequently increased the pH by several units. When 24.95 cm3 of base have been added, we are only 0.05 cm3 (approximately one drop) short of the endpoint. At this point 24.95 cm3 × 0.10 mmol cm–3 = 2.495 mmol hydroxide ions have been added. These will have consumed 2.495 mmol hydronium ions, leaving (2.5 – 2.495) mmol = 0.005 mmol hydronium ions in a volume of 49.95 cm3. The hydronium-ion concentration will now be:
\[[\text{ H}_{3}\text{O}^{+}]=\frac{\text{0.005 mmol}}{\text{49.95 cm}^{3}}=\text{1.00 }\times \text{ 10}^{-4}\text{ mol L}^{-1} \nonumber \]
giving a pH of 4.00. Because almost all the hydronium ions have been consumed, only a small fraction (one five-hundredth) remains and the volume of solution has nearly doubled. This reduces the hydronium-ion concentration by a factor of 10–3, and the pH increases by three units from its original value of 1.00.
When exactly 25.00 cm3 of base have been added, we have reached the theoretical equivalence point, and the flask will contain 2.5 mmol of both sodium and chloride ions in 50 cm3 of solution; i.e., the solution is 0.05 M NaCl. Furthermore its pH will be exactly 7.00, as seen on the graph, since neither the sodium ion nor the chloride ion exhibits any appreciable acid-base properties.
Immediately after this equivalence point the addition of further NaOH to the flask results in a sudden increase in the concentration of hydroxide ions, since there are now virtually no hydronium ions left to consume them. Thus even one drop (0.05 cm3) of base added to the equivalence point solution adds 0.005 mmol hydroxide ions and produces a hydroxide-ion concentration of 0.005 mmol/50.05 cm3 = 1.00 × 10⁻⁴ mol L–1. The resultant pOH = 4.00, and the pH = 10.00. The addition of just two drops of base results in a pH jump from 4.00 to 7.00 to 10.00. This rapid rise causes the indicator to change color, so the endpoint matches the equivalence point if the indicator is chosen properly.
Titration of a strong base with a strong acid can be handled in essentially the same way as the strong acid-strong base situation we have just described.
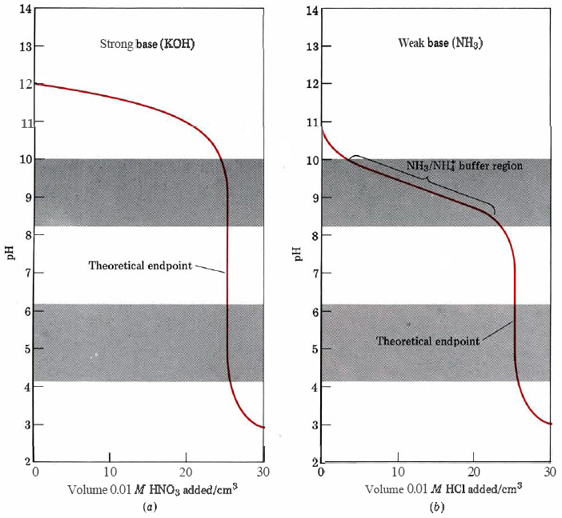
Suppose that 25.00 cm3 of 0.010 M KOH is titrated with 0.01 M HNO3. Find the pH of the solution in the flask (a) before any HNO3 is added; (b) halfway to the endpoint; (c) one drop (0.05 cm3) before the endpoint; (d) one drop after the endpoint.
Solution:
a) Since KOH is a strong base, [OH–] = 0.010 = 10–2. Thus \(\text{pOH}={2}\) and \(\text{pH}={14} - {2} = {12}\) b) Halfway to the endpoint means that half the OH– has been consumed. The original amount of OH– was\(\begin{align}n_{\text{OH}^{-}}=V_{\text{NaOH}}\times c_{\text{NaOH}}\\\text{ }=\text{25.00 cm}^{3}\times \frac{\text{0.010 mmol}}{\text{1 cm}^{3}}\\={0.25 mmol}\end{align}\)
so the amount remaining is 0.125 mmol OH–. It must have required 0.125 mmol HNO3 to consume the other 0.125 mmol OH–, and so the volume of HNO3 added is\(\begin{align}V_{\text{HNO}_{3}}=\frac{n_{\text{HNO}_{3}}}{c_{\text{HNO}_{3}}}\\\text{ }=\frac{\text{0.125 mmol}}{\text{0.010 mmol cm}^{-3}}\\={12.50 cm}^{3}\end{align}\)
The total volume of solution is thus (12.50 + 25.00) cm3 = 37.50 cm3, and\(\begin{align}\text{ }[\text{ OH}^{-}]= \frac{\text{0.125 mmol}}{\text{37.50 cm}^{3}}\\\text{ }=\text{3.33 }\times \text{ 10}^{-3}\text{ mmol cm}^{-3}\\\text{ }=\text{3.33 }\times \text{ 10}^{-3}\text{ mol L}^{-1}\end{align}\)
\(\text{pOH} = -\text{log }(\text{3.33} \times \text{10}^{-3})= {2.48}\) and \(\text{pH}={14}-{2.48}={11.52}\) c) When 24.95cm3 of HNO3 solution has been added, the amount of H3O+ added is\(\begin{align}n_{\text{H}_{3}\text{O}^{+}}=\text{24.95 cm}^{3}\times \frac{\text{0.010 mmol}}{\text{1 cm}^{3}}\\\text{ }=\text{0.2495 mmol}\end{align}\)
This would consume an equal amount of OH–, and so the amount of OH– remaining is (0.2500 – 0.2495) mmol = 0.0005 mmol. Thus\(\begin{align}\text{ }[\text{ OH}^{-}]=\frac{\text{0.0005 mmol}}{\text{(25.00 + 24.95) cm}^{3}}\\\text{ }=\text{1.0 }\times \text{ 10}^{-5}\text{ mmol cm}^{-3}\\\text{ }=\text{1.0 }\times \text{ 10}^{-5}\text{ mol L}^{-1}\end{align}\)
\(\text{pOH} = {5.0}\) and \(\text {pH}= {9.0}\) d) An excess of 0.05 cm3 of acid will add\(\begin{align}n_{\text{H}_{3}\text{O}^{+}}=\text{0.05 cm}^{3}\times \frac{\text{0.010 mmol}}{\text{1 cm}^{3}}\\\text{ }=\text{5 }\times \text{ 10}^{-4}\text{ mmol}\end{align}\)
of H3O+ to a neutral solution whose volume is (25.00 + 25.05)cm3 = 50.05 cm3.Thus
\([\text{ H}_{3}\text{O}^{+}]=\frac{\text{5 }\times \text{ 10}^{-4}\text{ mmol}}{\text{50.05 cm}^{3}}=\text{1 }\times \text{ 10}^{-5}\text{ mol L}^{-1}\)
\(\text {pH}= {5}\)In this case, because the solutions were one-tenth as concentrated as in the titration of HCl with NaOH worked out in the text, the jump in pH (from 9 to 5) at the endpoint is smaller.
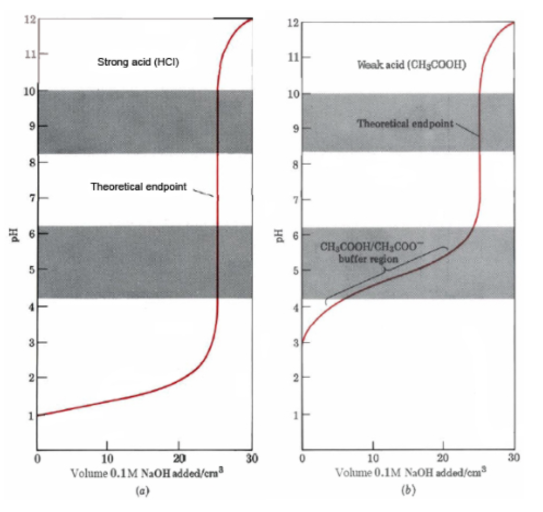
A wide choice of indicators like this is not possible for titrations involving weak acids or bases. When 25.00 cm3 of 0.10M CH3COOH is titrated with 0.10M NaOH, for instance, there is a very much smaller change in pH at the equivalence point, as shown in Figure 1b, and the choice of indicators is correspondingly narrowed. The behavior of the pH in this case is very different from that of the titration of HCl with NaOH, because the acid-base reaction is different.
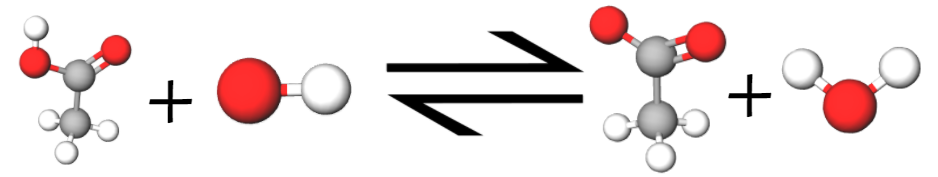
When CH3COOH is titrated with NaOH, the OH– ions consume CH3COOH molecules according to the equation:
\[\text{ CH}_{3}\text{COOH } + \text{OH}^{-} \rightarrow \text{ CH}_{3}\text{COO}^{-} + \text{ H}_{2}\text{O } \nonumber \]
As a result, the solution in the titration flask soon becomes a buffer mixture with appreciable concentrations of the CH3COO– ion as well as its conjugate acid. The [H3O+] and the pH are then controlled by the ratio of acid to conjugate base (equations 2 and 3 in the section on buffer solutions). When we are halfway to the endpoint, for example, [CH3COOH] will be essentially the same as [CH3COO–], and
\[\begin{align}\text{ }[\text{ H}_{3}\text{O}^{\text{+}}]=K_{a}\times \frac{[\text{ CH}_{3}\text{COOH }]}{[\text{ CH}_{3}\text{COO}^{-}]}\\\text{ }\approx \text{ }K_{a}=\text{1.8 }\times \text{ 10}^{-5}\text{ mol L}^{-1}\end{align} \nonumber \]
while the pH will be given by the Henderson-Hasselbalch equation as
\[\begin{align}\text{pH}=\text{p}K_{a}\text{ + log }\frac{[\text{ CH}_{3}\text{COOH }]}{[\text{ CH}_{3}\text{COO}^{-}]}\\\text{ }\approx \text{ p}K_{a}=\text{4.74}\end{align} \nonumber \]
Comparing this to the pH of 1.78 calculated above for the halfway stage in the titration of HCl, we find a difference of roughly three pH units. The effect of the buffering action of the CH3COOH/ CH3COO– conjugate pair is thus to keep the pH some three units higher than before and hence to cut the jump in pH at the endpoint by approximately this amount.
Exactly at the equivalence point we no longer have a buffer mixture but a 0.05-M solution of sodium acetate. This solution is slightly basic, and its pH of 8.72 can be calculated from equation 4 on the section covering the pH of weak base solutions. Beyond this equivalence point, the story is much the same as in the strong-acid case. Addition of even a drop (0.05cm3) of excess base raises the OH– concentration to 10–4 mol L–1 and the pH to 10. Of the three indicators which could be used in the titration of HCl, only one is useful for acetic acid. This is phenolphthalein, which changes color to the pinkish hue, as seen below, when in the pH range 8.3 to 10.0.
The titration of a weak base with a strong acid also involves a buffer solution and consequently requires a more careful choice of indicator.
For the titration of 25.00 cm3 of 0.010 M NH3 with 0.010 M HCl, calculate the pH (a) before any acid is added; (b) after 12.50 cm3 of HCl has been added; (c) at the equivalence point; (d) after 30.00 cm3 of HCl has been added.
Solution:
a) Before any acid is added, we have a solution of a weak base, and equation 4 from the section on weak bases applies:\(\begin{align}\text{ }[\text{ OH}^{-}]=\sqrt{K_{b}c_{b}}\\\text{ }=\sqrt{\text{1.8 }\times \text{ 10}^{-5}\text{ mol L}^{-1}\times \text{ 1.0 }\times \text{ 10}^{-2}\text{ mol L}^{-1}}\\\text{ }=\text{4.24 }\times \text{ 10}^{-4}\text{ mol L}^{-1}\end{align}\)
\(\text{pOH} = -\text{log }(\text{4.24} \times \text{10}^{-4})= \text{3.37}\)
and \(\text{pH}={14}-{3.37}={10.63}\)b) Since the concentrations of base and acid are equal, 12.50 cm3 of HCl is enough to consume half the NH3, converting it to the conjugate acid NH4+.
The Henderson-Hasselbalch equation may be used to obtain the pH of this buffer system, provided we use pKa(NH4+). Rearranging equation 2 from the section on acid-base pairs and pH,
\(\begin{align}\text{p}K_{a}\text{(NH}_{4}^{+}\text{)}=\text{14}-\text{p}K_{b}\text{(NH}_{3}\text{)}\\\text{ }=\text{14 + log(1.8 }\times \text{ 10}^{-5}\text{)}\\\text{ }=\text{14}-\text{4.74}=\text{9.26}\end{align}\)
Since \([\text{ NH}_{4}^{+}]\approx [\text{ NH}_{3}]\)
\(\begin{align}\text{pH}=\text{p}K_{a}\text{ + log}\frac{[\text{ A}^{-}]}{[\text{ HA }]}\\\text{ }=\text{p}K_{a}\text{ + log}\frac{[\text{ NH}_{3}]}{[\text{ NH}_{4}^{+}]}\\\text{ }\approx \text{p}K_{a}=\text{9.25}\end{align}\)
c) At the equivalence point all the NH3 has been converted to NH4+, and so we have a solution of NH4Cl. The volume of solution has doubled because 25.00 cm3 of HCl was added, and so cNH4+ must be half the original cNH3; that is, cNH4+ = 0.0005 mol L–1. Ka(NH4+) is obtained from Kb(NH3) using equation 1 from the section on acid-base pairs and pH:\(\begin{align}K_{a}\text{(NH}_{4}^{+}\text{)}=\frac{K_{w}}{K_{b}\text{(NH}_{3}\text{)}}\\\text{ }=\frac{\text{1.00 }\times \text{ 10}^{-14}\text{ mol}^{2}\text{ L}^{-2}}{\text{1.8 }\times \text{ 10}^{-5}\text{ mol L}^{-1}}\\\text{ }=\text{5.56 }\times \text{ 10}^{-10}\text{ mol L}^{-1}\end{align}\)
Thus\(\begin{align}\text{ }[\text{ H}_{3}\text{O}^{+}]=\sqrt{K_{a}c_{a}}\\\text{ }=\sqrt{\text{5.56 }\times \text{ 10}^{-10}\text{ mol L}^{-1}\times \text{ 5.0 }\times \text{ 10}^{-3}\text{ mol L}^{-1}}\\text{ }=\text{1.67 }\times \text{ 10}^{-6}\text{ mol L}^{-1}\\\text{ }\\\text{pH}= -\text{log }(\text{1.67} \times \text{10}^{-6})= \text{5.78}\end{align}\)
d) By adding an excess 5.0 cm3 of HCl we have added a strong acid to a solution which previously contained the very weak acid NH4+. To a first approximation, then, we consider only H3O+ produced by HCl.
\(\begin{align}\text{ }[\text{ H}_{3}\text{O}^{+}]=K_{a}\times \frac{\text{5.0 cm}^{3}\times \text{ 0.010 mol L}^{-1}}{\text{55.00 cm}^{3}}\\\text{ }=\text{9.1 }\times \text{ 10}^{-4}\text{ mol L}^{-1}\\\text{ }\\\text{pH}= -\text{log }({1.69.17} \times{10}^{-4})= \text{3.04}\end{align}\)
The pH variation during titrations of strong and weak bases with strong acid are shown in Figure \(\PageIndex{2}\). In the case of the titration of 0.010 M NH3 with 0.010 M HCl, methyl red, but not phenolphthalein, would be a suitable indicator. In general the best indicator for a given titration is the one whose pKa most nearly matches the pH calculated at the theoretical endpoint.