The Effect of Changing Conditions on Enzyme Catalysis
- Page ID
- 3965
\( \newcommand{\vecs}[1]{\overset { \scriptstyle \rightharpoonup} {\mathbf{#1}} } \)
\( \newcommand{\vecd}[1]{\overset{-\!-\!\rightharpoonup}{\vphantom{a}\smash {#1}}} \)
\( \newcommand{\dsum}{\displaystyle\sum\limits} \)
\( \newcommand{\dint}{\displaystyle\int\limits} \)
\( \newcommand{\dlim}{\displaystyle\lim\limits} \)
\( \newcommand{\id}{\mathrm{id}}\) \( \newcommand{\Span}{\mathrm{span}}\)
( \newcommand{\kernel}{\mathrm{null}\,}\) \( \newcommand{\range}{\mathrm{range}\,}\)
\( \newcommand{\RealPart}{\mathrm{Re}}\) \( \newcommand{\ImaginaryPart}{\mathrm{Im}}\)
\( \newcommand{\Argument}{\mathrm{Arg}}\) \( \newcommand{\norm}[1]{\| #1 \|}\)
\( \newcommand{\inner}[2]{\langle #1, #2 \rangle}\)
\( \newcommand{\Span}{\mathrm{span}}\)
\( \newcommand{\id}{\mathrm{id}}\)
\( \newcommand{\Span}{\mathrm{span}}\)
\( \newcommand{\kernel}{\mathrm{null}\,}\)
\( \newcommand{\range}{\mathrm{range}\,}\)
\( \newcommand{\RealPart}{\mathrm{Re}}\)
\( \newcommand{\ImaginaryPart}{\mathrm{Im}}\)
\( \newcommand{\Argument}{\mathrm{Arg}}\)
\( \newcommand{\norm}[1]{\| #1 \|}\)
\( \newcommand{\inner}[2]{\langle #1, #2 \rangle}\)
\( \newcommand{\Span}{\mathrm{span}}\) \( \newcommand{\AA}{\unicode[.8,0]{x212B}}\)
\( \newcommand{\vectorA}[1]{\vec{#1}} % arrow\)
\( \newcommand{\vectorAt}[1]{\vec{\text{#1}}} % arrow\)
\( \newcommand{\vectorB}[1]{\overset { \scriptstyle \rightharpoonup} {\mathbf{#1}} } \)
\( \newcommand{\vectorC}[1]{\textbf{#1}} \)
\( \newcommand{\vectorD}[1]{\overrightarrow{#1}} \)
\( \newcommand{\vectorDt}[1]{\overrightarrow{\text{#1}}} \)
\( \newcommand{\vectE}[1]{\overset{-\!-\!\rightharpoonup}{\vphantom{a}\smash{\mathbf {#1}}}} \)
\( \newcommand{\vecs}[1]{\overset { \scriptstyle \rightharpoonup} {\mathbf{#1}} } \)
\( \newcommand{\vecd}[1]{\overset{-\!-\!\rightharpoonup}{\vphantom{a}\smash {#1}}} \)
\(\newcommand{\avec}{\mathbf a}\) \(\newcommand{\bvec}{\mathbf b}\) \(\newcommand{\cvec}{\mathbf c}\) \(\newcommand{\dvec}{\mathbf d}\) \(\newcommand{\dtil}{\widetilde{\mathbf d}}\) \(\newcommand{\evec}{\mathbf e}\) \(\newcommand{\fvec}{\mathbf f}\) \(\newcommand{\nvec}{\mathbf n}\) \(\newcommand{\pvec}{\mathbf p}\) \(\newcommand{\qvec}{\mathbf q}\) \(\newcommand{\svec}{\mathbf s}\) \(\newcommand{\tvec}{\mathbf t}\) \(\newcommand{\uvec}{\mathbf u}\) \(\newcommand{\vvec}{\mathbf v}\) \(\newcommand{\wvec}{\mathbf w}\) \(\newcommand{\xvec}{\mathbf x}\) \(\newcommand{\yvec}{\mathbf y}\) \(\newcommand{\zvec}{\mathbf z}\) \(\newcommand{\rvec}{\mathbf r}\) \(\newcommand{\mvec}{\mathbf m}\) \(\newcommand{\zerovec}{\mathbf 0}\) \(\newcommand{\onevec}{\mathbf 1}\) \(\newcommand{\real}{\mathbb R}\) \(\newcommand{\twovec}[2]{\left[\begin{array}{r}#1 \\ #2 \end{array}\right]}\) \(\newcommand{\ctwovec}[2]{\left[\begin{array}{c}#1 \\ #2 \end{array}\right]}\) \(\newcommand{\threevec}[3]{\left[\begin{array}{r}#1 \\ #2 \\ #3 \end{array}\right]}\) \(\newcommand{\cthreevec}[3]{\left[\begin{array}{c}#1 \\ #2 \\ #3 \end{array}\right]}\) \(\newcommand{\fourvec}[4]{\left[\begin{array}{r}#1 \\ #2 \\ #3 \\ #4 \end{array}\right]}\) \(\newcommand{\cfourvec}[4]{\left[\begin{array}{c}#1 \\ #2 \\ #3 \\ #4 \end{array}\right]}\) \(\newcommand{\fivevec}[5]{\left[\begin{array}{r}#1 \\ #2 \\ #3 \\ #4 \\ #5 \\ \end{array}\right]}\) \(\newcommand{\cfivevec}[5]{\left[\begin{array}{c}#1 \\ #2 \\ #3 \\ #4 \\ #5 \\ \end{array}\right]}\) \(\newcommand{\mattwo}[4]{\left[\begin{array}{rr}#1 \amp #2 \\ #3 \amp #4 \\ \end{array}\right]}\) \(\newcommand{\laspan}[1]{\text{Span}\{#1\}}\) \(\newcommand{\bcal}{\cal B}\) \(\newcommand{\ccal}{\cal C}\) \(\newcommand{\scal}{\cal S}\) \(\newcommand{\wcal}{\cal W}\) \(\newcommand{\ecal}{\cal E}\) \(\newcommand{\coords}[2]{\left\{#1\right\}_{#2}}\) \(\newcommand{\gray}[1]{\color{gray}{#1}}\) \(\newcommand{\lgray}[1]{\color{lightgray}{#1}}\) \(\newcommand{\rank}{\operatorname{rank}}\) \(\newcommand{\row}{\text{Row}}\) \(\newcommand{\col}{\text{Col}}\) \(\renewcommand{\row}{\text{Row}}\) \(\newcommand{\nul}{\text{Nul}}\) \(\newcommand{\var}{\text{Var}}\) \(\newcommand{\corr}{\text{corr}}\) \(\newcommand{\len}[1]{\left|#1\right|}\) \(\newcommand{\bbar}{\overline{\bvec}}\) \(\newcommand{\bhat}{\widehat{\bvec}}\) \(\newcommand{\bperp}{\bvec^\perp}\) \(\newcommand{\xhat}{\widehat{\xvec}}\) \(\newcommand{\vhat}{\widehat{\vvec}}\) \(\newcommand{\uhat}{\widehat{\uvec}}\) \(\newcommand{\what}{\widehat{\wvec}}\) \(\newcommand{\Sighat}{\widehat{\Sigma}}\) \(\newcommand{\lt}{<}\) \(\newcommand{\gt}{>}\) \(\newcommand{\amp}{&}\) \(\definecolor{fillinmathshade}{gray}{0.9}\)This page looks at the effect of changing substrate concentration, temperature and pH on reactions involving enzymes. It follows on from a page describing in simple terms how enzymes function as catalysts.
The effect of substrate concentration on the rate of enzyme-controlled reactions
Remember that in biology or biochemistry, the reactant in an enzyme reaction is known as the "substrate". What follows is a very brief and simple look at a very complicated topic. Anything beyond this is the stuff of biochemistry degree courses!
A reminder about the effect of concentration on rate in ordinary chemical reactions
If you have done any work on rates of reaction (especially if you have done orders of reaction), you will have come across cases where the rate of reaction is proportional to the concentration of a reactant, or perhaps to the square of its concentration.
You would discover this by changing the concentration of one of the reactants, keeping everything else constant, and measuring the initial rate of the reaction. If you measure the rate after the reaction has been going for a while, the concentration of the reactant(s) will have changed and that just complicates things. That's why initial rates are so useful - you know exactly how much you have of everything. If you plotted a graph of initial reaction rate against the concentration of a reactant, then there are various possibilities depending on the relationship between the concentration and the rate.
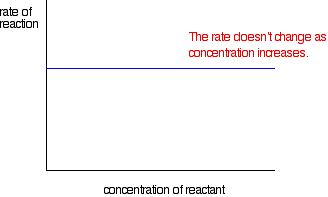
If the rate is independent of the concentration
This is called a zero order reaction.
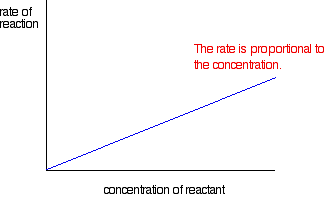
If the rate is proportional to the concentration
This is called a first order reaction.
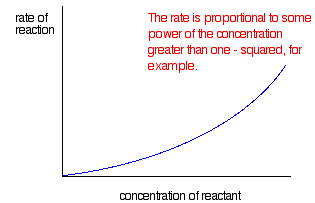
If the rate is proportional to some power of the concentration greater than one
In this case, you get a curve. If the rate was proportional to the square of the concentration, that's a second order reaction.
With reactions controlled by enzymes, you get a completely different type of graph.
Plotting initial rates of enzyme-controlled reactions against substrate concentration
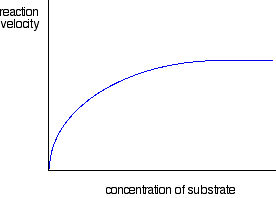
The graph for enzyme controlled reactions looks like this:
Two minor things to notice before we discuss it . . .
- Biochemists talk about a reaction velocity instead of a reaction rate. If you have done any physics, you will know that this is a misuse of the word "velocity"! But that's what you will find in biochemistry sources, so that's what we will have to use.
- In chemistry, rates are normally measured in terms of rate of change of concentration, with units like mol dm-3 s-1 (moles per cubic decimeter per second). Biochemists often quote it in terms of the number of molecules of substrate which a single molecule of enzyme is processing per unit time - per second, for example. It is easier to visualize, but involves a messy calculation to get there. That's not our problem for this topic!
So why is the graph the shape it is?
For very, very low substrate concentrations, the graph is almost a straight line - like the second chemistry rate graph above. In other words, at very, very low concentrations, the rate is proportional to the substrate concentration.
But as concentration increases, increasing the concentration more has less and less effect - and eventually the rate reaches a maximum. Increasing the concentration any more makes no difference to the rate of the reaction.
If you know about orders of reaction, the reaction has now become zero order with respect to the substrate.
The reason for this is actually fairly obvious if you think about it. After a certain concentration of substrate is reached, every enzyme molecule present in the mixture is working as fast as it can. If you increase the substrate concentration any more, there aren't any enzyme molecules free to help the extra substrate molecules to react.
Is this unique to enzyme-controlled reactions? No! It can happen in some ordinary chemistry cases as well, usually involving a solid catalyst working with gases. At very high gas pressures (in other words, very high concentrations of gas molecules), the surface of the catalyst can be completely full of gas molecules. If you increase the amount of gas any more, there isn't any available surface for it to stick to and react.
\(V_{max}\) and \(K_M\)
The maximum rate for a particular enzyme reaction is known as Vmax. (That's V for velocity - a bit confusing for chemists where V is almost always used for volume!) This is easily measured by drawing a line on the graph:
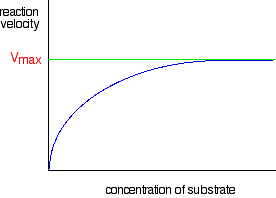
This is sometimes reported as a "turnover number", measured as the number of molecules of substrate processed by a single enzyme molecule per second, or per minute. KM is known as the Michaelis constant or the Michaelis-Menten constant (for reasons which needn't concern us), and is a useful measure of the efficiency of an enzyme.
KM is the concentration of the substrate in mol dm-3 which produces a reaction rate of half Vmax. So it is found like this . . .
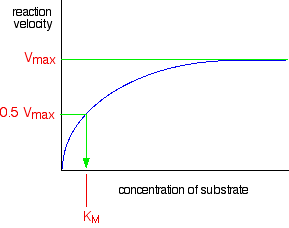
A low value of KM means that the reaction is going quickly even at low substrate concentrations. A higher value means the enzyme isn't as effective.
The effect of temperature on the rate of enzyme-controlled reactions
Remember that for molecules to react, they have to collide with an energy equal to or greater than the activation energy for the reaction. Heating a reaction makes the molecules move faster and so collide more often. More collisions in a given time means a faster reaction. But far more importantly, increasing the temperature has a very big effect on the number of collisions with enough energy to react. Quite a small temperature rise can produce a large increase in rate.
As a reasonable approximation for many (although not all) reactions close to room temperature, a 10°C increase in temperature will double the rate of a chemical reaction. This is only an approximation - it may take 9°C or 11°C or whatever, but it gives you an idea of what to expect.
Plotting rates of enzyme-controlled reactions against temperature
For low temperatures up to about 40°C, enzyme-controlled reactions behave much as you would expect any other chemical reaction to behave. But above about 40°C (the exact temperature varies from enzyme to enzyme), there is a dramatic fall in reaction rate. A typical graph of rate against temperature might look like this:
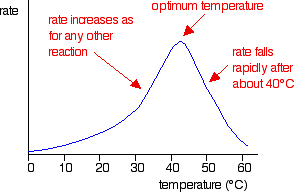
The temperature at which the rate is fastest is called the optimum temperature for that enzyme. Different enzymes have different optimum temperatures. Some enzymes, for example, in organisms known as thermophiles or extremophiles are capable of working at temperatures like 80°C or even higher. The optimum temperature for a particular enzyme varies depending on how long it is exposed to the higher temperatures. Enzymes can withstand temperatures higher than their normal optimum if they are only exposed to the higher temperatures for a very short time.
Explaining the rate against temperature graph
At lower temperatures, the shape of the graph is exactly what you would expect for any reaction. All that needs explaining is why the rate falls above the optimum temperature.
- Remember that the enzyme works because its substrate fits into the active site on the protein molecule. That active site is produced because of the way the protein is folded into its tertiary structure.
- Heating an enzyme gives the protein chains extra energy and makes them move more. If they move enough, then the bonds holding the tertiary structure in place will come under increasing strain.
- The weaker bonds will break first - van der Waals attractions between side groups, and then hydrogen bonds. As soon as these bonds holding the tertiary structure together are broken, then the shape of the active site is likely to be lost.
- Obviously, the longer the enzyme is held at the higher temperature, the more time there is for the enzyme structure to be broken up. Given enough time and high enough temperatures, the enzyme structure is broken permanently. The enzyme is said to be denatured. For example, boiling an egg for 5 minutes denatures the proteins in the egg. Once that has happened, you can't un-boil it by cooling it!
The effect of pH on the rate of enzyme-controlled reactions
In the same way that every enzyme has an optimum temperature, so each enzyme also has an optimum pH at which it works best. For example, trypsin and pepsin are both enzymes in the digestive system which break protein chains in the food into smaller bits - either into smaller peptide chains or into individual amino acids. Pepsin works in the highly acidic conditions of the stomach. It has an optimum pH of about 1.5. On the other hand, trypsin works in the small intestine, parts of which have a pH of around 7.5. Trypsin's optimum pH is about 8.
If you think about the structure of an enzyme molecule, and the sorts of bonds that it may form with its substrate, it isn't surprising that pH should matter. Suppose an enzyme has an optimum pH around 7. Imagine that at a pH of around 7, a substrate attaches itself to the enzyme via two ionic bonds. In the diagram below, the groups allowing ionic bonding are caused by the transfer of a hydrogen ion from a -COOH group in the side chain of one amino acid residue to an -NH2 group in the side chain of another.
In this simplified example, that is equally true in both the substrate and the enzyme.
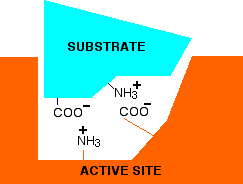
Now think about what happens at a lower pH - in other words under acidic conditions. It won't affect the -NH3+ group, but the -COO- will pick up a hydrogen ion. What you will have will be this:
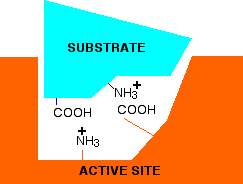
You no longer have the ability to form ionic bonds between the substrate and the enzyme. If those bonds were necessary to attach the substrate and activate it in some way, then at this lower pH, the enzyme won't work. What if you have a pH higher than 7 - in other words under alkaline conditions. This time, the -COO- group won't be affected, but the -NH3+ group will lose a hydrogen ion. That leaves . . .

Again, there is no possibility of forming ionic bonds, and so the enzyme probably won't work this time either. At extreme pH's, something more drastic can happen. Remember that the tertiary structure of the protein is in part held together by ionic bonds just like those we've looked at between the enzyme and its substrate. At very high or very low pH's, these bonds within the enzyme can be disrupted, and it can lose its shape. If it loses its shape, the active site will probably be lost completely. This is essentially the same as denaturing the protein by heating it too much.


